

Introduction
Materials and Methods
Bud Load Levels
Irrigation Treatments
Analysis of Sugars and Organic Acids
Analysis of Phenolic Compounds
Analysis of Antioxidants
Statistical Analysis
Results and Discussion
Introduction
Grape production is increasing world-wide due to the benefits that grape consumption has for human health and nutrition. The biochemical composition of the grapes is the main determinant of quality. Sugars, organic acids, and phenolic compounds are the main constituents in grapes (Zhu et al., 2012; Eshghi et al., 2014; Rahmani et al., 2015). Grapes have a high adaptability to different conditions and are used for various purposes such as direct consumption of the fruits and for making wine, raisins, vinegar, molasses, and juice, all of which add economic value to grape production.
Although the nutritional value of grapes is high, consumers demand not only aesthetically pleasing fruit, but also environmentally friendly production. Therefore, recent research has focused on the analysis of the biochemical compounds (Beslic et al., 2010; Wessner and Kurtural, 2013; Kurtural et al., 2013) and the antioxidant contents of grapes (Zhu et al., 2012; Rahmani et al., 2015). Many studies have documented large amounts of antioxidants and phenolic compounds in table grapes, wines, raisins, and other grape products (Breksa et al., 2010; Gokturk Baydar et al., 2011; Kelebek et al., 2013; Wessner and Kurtural, 2013). Recent research has reported that phenolic compounds have antioxidant, anti-allergenic, anti-cancer, anti-microbial, anti-ageing, and anti-inflammatory properties (Beslic et al., 2010; Rahmani et al., 2015). The phenolic compounds in grapes are divided into colored phenols, such as anthocyanins and flavonoids, and non-colored phenols, including phenolic acids, stilbenes, and flavan-3-ols (Silva et. al., 2005; Sun et al., 2007; Kelebek, 2009; Kelebek et al. 2013). The content of phenolic compounds in grapes is affected by variety, maturity, and several environmental and cultural factors including the vine-training system, biotic and abiotic stress conditions, crop load, irrigation, fertility, and summer pruning, among others (Kennedy et al., 2002; Beslic et al., 2010; Fawzi et al., 2010; Terry and Kurtural, 2011; Kurtural et al., 2013).
Pruning is an essential cultural practice in grape production. It affects the form and size of the vine and establishes a balance between shoot and fruit growth. Hence, the level of pruning has an effect on yield, quality, and fruit composition (Kurtural et al., 2013; Wessner and Kurtural, 2013; Rahmani et al., 2015) due to altered canopy size, shoot development, and fruit cluster numbers per vine.
Irrigation also affects the quality of the grapes. In locations with an annual rainfall of 500-600 mm, rain-fed viticulture can be successful depending on the soil type. However, supplementary irrigation might be necessary to maintain high yield and quality when the seasonal distribution of rainfall is not adequate (Çelik, 2011).
Kalecik Karası (Vitis vinifera L.) is one of the most important Turkish grape cultivars grown for red wine production. It originated from Kalecik, a town in the Ankara province, mid-north Turkey. Information on the effects of irrigation and pruning to manage fruit load is lacking for this variety. The objective of this study was to evaluate the effect of different irrigation applications (IA) and bud loads (BL) on the biochemical composition of Kalecik Karası grown in the high plateau regions.
Materials and Methods
Berries from own rooted sixteen-year-old grape vines of cv. Kalecik Karası (Vitis vinifera L.) grown in the Pozantı Agricultural Research Centre (1,080 m above sea level) (37°28’38.1”N, 34°54’09.5”E) of Cukurova University (Adana, Turkey) were used as the plant material in 2013 and 2014. The vines, grown in 2m × 3m (vine x row) plots in an east-west orientation, were trained to a bilateral cordon system. The soil in the experimental vineyard was slightly alkaline (pH 7.64-7.77) with clay-loam and loam textures on the surface and at a 30-60 cm soil depth. The field capacity and the permanent wilting point (average values for the two soil depths) were 25.7 and 17.5%, respectively. Climatic data were obtained from the Climate Station of Regional Directorate of Meteorology in Pozantı, Turkey. In April through October of 2013 and 2014, the average daily temperatures were 19.1 and 18.5°C, relative humidity was 45.8 and 59.2% and total precipitation was 135.0 and 321.2 mm with a 2.2 and 4.4 m·s-1 wind speed, respectively.
Three treatments were used in the experiment, one increased bud load treatment and a normal bud load control and two irrigation treatments and a non-irrigated (rain-fed) control.
Bud Load Levels
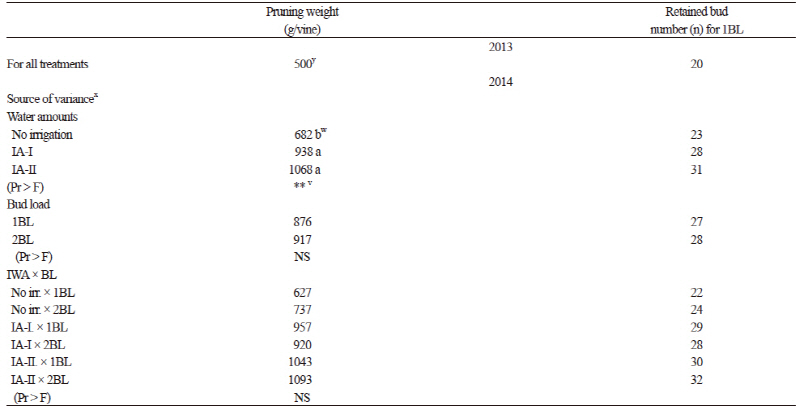
Vines maintained at the normal bud load (1BL, control) according to traditional practices (20 buds for the first 500 g of pruning weights and 10 more buds for every subsequent 500 g of pruning weight) (Winkler et al., 1974; Çelik, 2011) and increased bud loads (2BL, double the buds of the control) (Table 1) were used for all irrigation treatments. After dormant pruning, the average pruning weights to determine the number of buds to be retained were measured on March 8th and 10th in 2013 and 2014, respectively.
Irrigation Treatments
In both of the irrigation treatments, the timing of irrigation was scheduled according to the midday leaf water potential (LWP), a widely used measurement of plant water status, while the irrigation volume applied was calculated using the cumulative evaporation (Epan) values obtained from Class-A Evaporation Pans (METOS Inc., Mersin, Turkey). The midday LWP values that dictated when irrigation was to be applied differed for each plant growth stage: -10 bars for the period before flowering, -13 bars for the period between fruit set and ripening and -12 bars for the post-ripening stage. Water amounts applied to the IA-I plots were 50% of the cumulative evaporation from the Class A Pan for the berry setting through veraison growth stage and 75% for the veraison through harvest growth stage. For the IA-II plots, the water amounts applied were 75% of the evaporation from the Pan for the berry setting through veraison growth stage and 50% for the veraison through harvest growth stage. The irrigation water amount was calculated using the following equation based on cumulative Class-A pan evaporation within the irrigation intervals.
I = A × Epan × Kpc × P
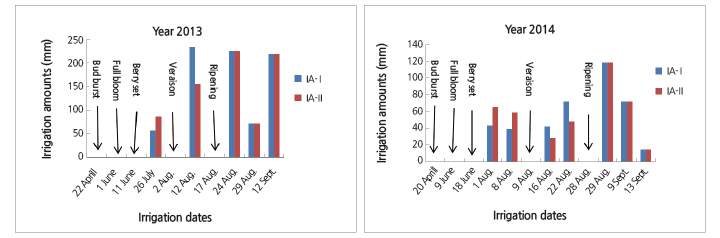
I: Irrigation volume (mm or L), A: parcel area (6 m2), Epan: Evaporation from the class-A pan (mm or L), Kpc: The crop and pan coefficient (0.6) and P: Percentage of wetted area (0.5). P value was calculated as the percentage of the average area shaded by the canopy measured at noon. Drip lines with an emitter spaced every 20 cm were placed close to the vine rows and were operated at a 2 L/h flow rate and a pressure of 1.5 bars. Irrigation amounts and dates of irrigation are presented in Fig. 1.
Four fully expanded leaves exposed to direct sunlight were chosen for the leaf water potential (LWP) measurement in each plot. To measure midday LWP (between 11:30 and 14:00 hrs), the targeted leaves were first covered entirely with a small plastic bag and then the petiole of the bagged leaf was cut from the shoot with a sharp blade. A pressure chamber device (Model 600, PMS Instrument Co. Albany, Oregon, USA) was used for the LWP measurements. Stomatal conductance and leaf temperature were measured using a leaf porometer (Model SC-1, Decagon devices Inc., Pullman, WA 99163, USA) on two fully expanded leaves exposed to direct sunlight and light intensity was measured using a Light Meter (Model LX-1102, Lutron Electronic Enterprise Co. Ltd., Taipei, TAIWAN). During harvest (when the amount of total soluble solids (TSS) has reached approximately 22-23%) 500 g of berries with pedicels were taken from the inner two vines with two replicates. These samples were stored at -80°C until the following analyses were performed.
Analysis of Sugars and Organic Acids
To determine sugars and organic acids, samples were prepared according to the method proposed by Sturm et al. (2003). Briefly, 100 g of whole fruit without pedicel was converted into pulp by a mixer and homogenized with an Ultra-Turrax T-25 (IKA Laboratory Equipment). The fruit puree (10 g) was diluted to 100 mL with double-distilled water and centrifuged at 5,000 rpm for 15 min. The extract was filtered through 0.45 μm Millipore filters and a 20 μL sample was used for HPLC analysis of sugars and organic acids. An Agilent 1100 HPLC system (Agilent Technologies, Palo Alto, CA, USA) equipped with a pump system, a refractive index detector for sugar analysis, and a diode array detector was monitored at 210 nm for the analysis of organic acids. Sugars and organic acids were simultaneously analysed using an Aminex HPX-87H column (300 × 7.8 mm) (Bio-Rad, UK) and maintained at 55°C. The analytical conditions used were as follows, flow: 0.3 mL·min-1, eluent: 0.045 NH2SO4 with 6% acetonitrile (v/v). The chromatographic peaks corresponding to each sugar and organic acid were identified by comparing the retention times with that of a standard.
Analysis of Phenolic Compounds
Extracts for analysis of phenolic compounds were prepared from whole fruits without pedicels according to the method of Breksa et al. (2010). An Agilent 1100 HPLC system, as described above, with a diode array detector operated by Windows NT-based ChemStation software was used. Separation was performed on a Beckman Ultrasphere ODS column (Roissy, France; 4.6 mm × 250 mm, 5 μm). The mobile phase consisted of water with 5% formic acid (solvent A; v/v) and acetonitrile with 40% solvent A (solvent B; v/v). The elution program was conducted as previously described (Kelebek et al., 2013). The identification and determination of each compound was done by comparing their retention times and UV spectra to standards and also confirmed by an Agilent 6430LC-MS/MS spectrometer equipped with an electrospray ionization source. The electrospray ionization mass spectrometry detection was performed in negative ion mode with the following optimized parameters: capillary temperature 400°C, capillary voltage -3V, nebulizer gas flow 1.75 L·min-1, desolation gas flow 1 L·min-1 and spray voltage 5 kV. The analysis was conducted in negative and positive modes (Kelebek et al., 2013). Data gaining was achieved in the multiple reaction monitoring (MRM) mode that only monitors specific mass transitions during preset retention times. Dynamic MRM also has the ability to simultaneously carry through electrospray ionization in both positive modes (for anthocyanins) and negative modes (for phenolic acids, flavonols and flavanols), allowing for the analysis of different phenolic classes within a single chromatographic run.
Analysis of Antioxidants
The electron donation ability of the fruit extract was measured by bleaching the purple-colored solution of 1,1-diphenyl-2-picrylhydrazyl (DPPH) radical described by Kelebek et al. (2013). Three different dilutions of the grape extracts (1, 20 and 50 mg·mL-1) were prepared in ethanol/water (4/1, v/v). An aliquot of 0.1 mL of diluted grape extract was added to 3.9 mL of DPPH solution in methanol (6 × 10⁻⁵ M). The mixture was shaken vigorously and left at room temperature for 30 min. The absorbance of the resulting solution was then measured at 515 nm by a Cary 60 UV-Vis spectrophotometer (Agilent Technologies, Palo Alto, CA, USA) until the reaction reached the plateau (steady state).
Statistical Analysis
The experiment was designed as a split plot with two replicates. Each experimental unit consisted of five vines. Twelve samples were used for each attribute analysed. The irrigation treatments were the main plots and the bud load treatments were sub plots. Analysis of variance (ANOVA) was done using the JMP computer program for statistics developed by the JMP business unit of SAS Institute and the least significant difference (LSD) test was used for separation of the means at a 5% significance level. Interactions between year and treatments were tested and analysis was conducted separately whenever these interactions were significant (p ≤ 0.05).
Results and Discussion
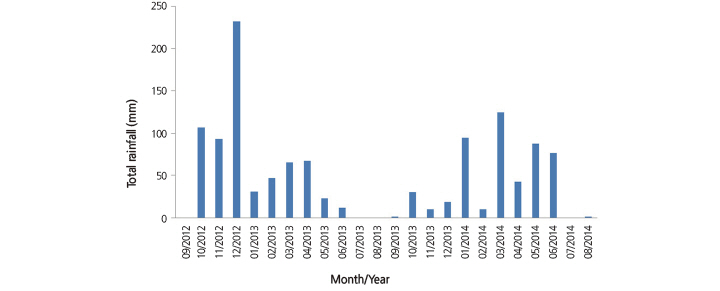
The applied irrigation volume (IA) in different periods for each treatment is given in Figure 1. The first irrigation in 2013 was applied on July 26 and in 2014 the first irrigation was applied on August 1. LWP values were below the threshold of -10 bars until berry set and -13 bars after berry set; therefore, the recorded 247 mm and 437.4 mm of precipitation from January to August in 2013 and 2014, respectively, (Fig. 2) was considered sufficient for grape cultivation (Winkler et al., 1974; Weaver, 1976; Ward, 1984; Çelik et al., 1998; Çelik, 2011). Ward (1984) suggested that for successful vine production, average annual rainfall should not exceed 762 mm, and during the growing period precipitation should remain below 350 mm. Winkler et al., (1974) indicated that some varieties of grapes can be grown in cool regions with 381 mm of water, and occasionally less. Similarly, Weaver (1976) stated that annual rainfall varies between 300-800 mm in cooler regions of California and Arizona. Çelik et al. (1998) and Çelik (2011) also stated that grape vines can be successfully grown in areas with an average annual precipitation between 450-500 mm.
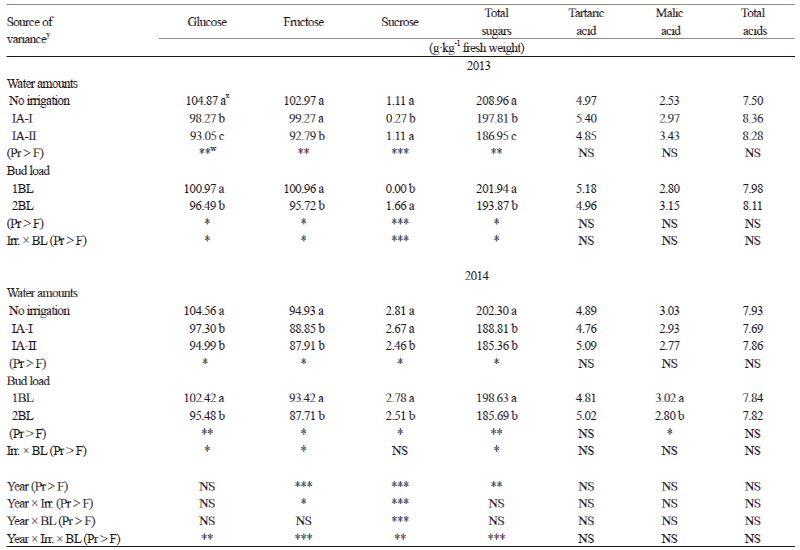
Glucose, fructose (except in 2013), and total sugars (Table 2) were highest in the non-irrigated control. The lowest values for glucose, fructose, and total sugars were found in the IA-II treatment (except in 2014) where more water was applied between berry set and veraison (85.7 mm/vine and 123.8 mm/vine for 2013 and 2014, respectively) than in the IA-I treatment. Glucose, fructose, and total sugars were also significantly higher (p ≤ 0.05) in the traditional BL control compared to those in the 2BL (increased BL) treatment in both years. Our results were in accordance with other studies that reported that excessive bud load can reduce available sugars and water absorption in the berries (Winkler et al., 1974; Cus et al., 2004; Çelik, 2011). Total soluble solids were also not affected by pruning treatments in Wilson et al. (2014). Sucrose was very low compared to other sugar components. Both IA and BL treatments had no effect on tartaric, malic and total organic acids of ‘Kalecik Karası’ berries in either year of the our study. Cus et al. (2004) also found a similar effect of the crop load in their research.
| |
Fig. 2. Total monthly rainfall between September, 2012 and August, 2014 in the experimental plots (Regional Directorate of Me-teorology, Climate Station, Pozantı, south Turkey) | |
In total, thirteen anthocyanin compounds were detected in the grapes from our study. Five were monoglucosides, four were acetylated and the remaining four compounds were coumarylated (Table 3). Considering all of the anthocyanin compounds (except delphinidin 3-glucoside), the significantly highest values were obtained from the grapevines grown under the rain-fed conditions (p ≤ 0.05) followed by the IA-II treatment. Total anthocyanin content was also greater in the non-irrigated berries in previous reports (Esteban et al., 2001; Chaves et al., 2007; özden et al., 2010; Santesteban et al., 2011), but not in Zarrouk et al. (2012). According to the results of Kyraleou et al. (2015) water restriction had positive effects on total anthocyanin levels, which has also been noted in their varieties (Castellarin et al., 2007; Bucchetti et al., 2011). The normal BL level based on traditional practices resulted in greater amounts of total anthocyanin in both years of the study (Table 3). Increases in the anthocyanin concentration in the berries from the rain-fed and the 1BL controls may be affected by changes in leaf stomatal conductance, leaf temperature, and light intensity within the canopy (Table 4) (Downey et al., 2004) or from direct effects on the expression of genes of the flavonoid pathway (Castellarin et al., 2007). Kurtural et al. (2013) also showed that anthocyanins in berry skin decreased with a 45 shoots/m treatments when compared with 40 shoots/m treatments.
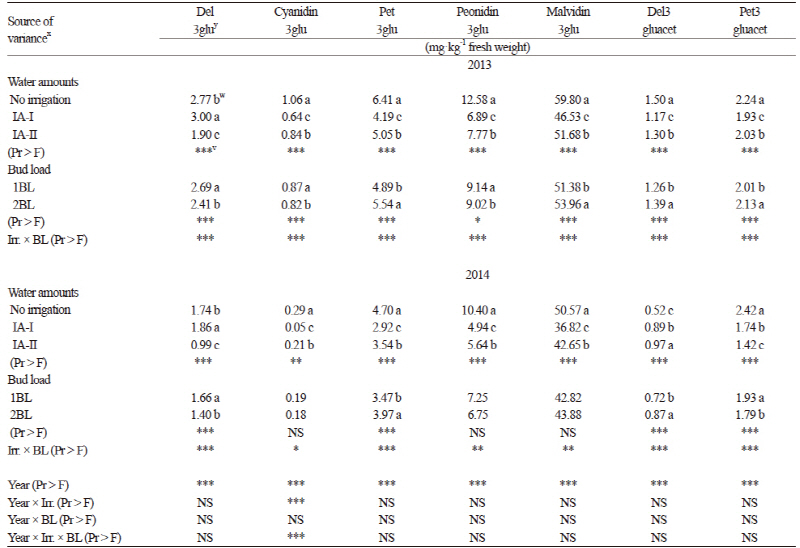
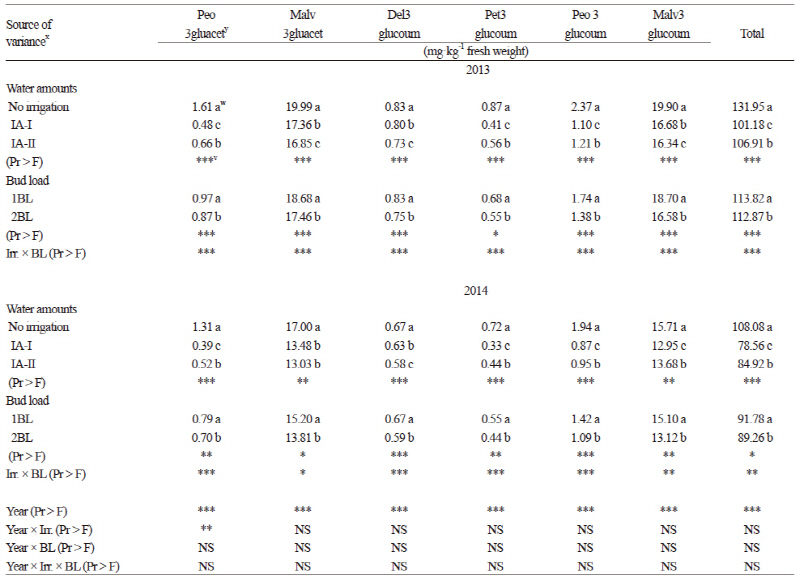
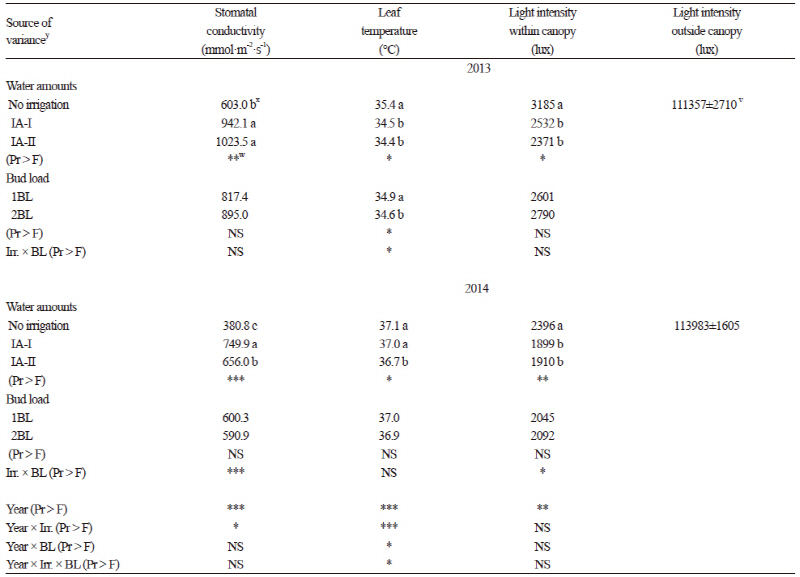
Water stress or limited water led to a less-dense canopy, which may have resulted in greater irradiance within the fruit zone of the rain-fed plots. The non-irrigated plants also had greater leaf temperature and lower stomatal conductance compared to the irrigated plants. Accordingly, higher sugar and anthocyanin contents have been found in grape berries of plants under rain-fed conditions. Previous studies (Shellie, 2011; Terry and Kurtural, 2011; Zarrouk, et al., 2012; Nelson et al., 2015) showed that water deficits affected the physiological and hormonal responses of field and glasshouse grown grapevines. Generally, the less water applied, the more stomatal conductance was reduced. Bindon et al. (2011) reported that frequent irrigation can cause a remarkable restriction of anthocyanin biosynthesis. Chalmers (2007) examined the effects of different levels of irrigation on grapes and also found total anthocyanin between 1.77 and 1.07 mg·g-1 for full (100%) irrigation but found higher values (1.22 and 2.25 mg·g-1) in limited water (45% of full irrigation) conditions. In our study, total anthocyanin varied between 101.18 mg·kg-1 (IA-I) and 131.95 mg·kg-1 (rain-fed) for 2013 and 78.56 mg·kg-1 (IA-I) and 108.08 mg·kg-1 (rain-fed) for 2014 (Table 3), which were close to the values found by Cantos et al. (2002). Anthocyanins were the main phenolic compounds in red grapes ranging from 151 to 689 mg·kg-1 fresh berry weight. Previous studies reported higher anthocyanin values, such as between 471 and 1,242 mg kg-1 (Bindon et al., 2011) and 940 to 1,270 mg·kg-1 (Chalmers, 2007). The anthocyanin values in the skin of the berries varied between 355.9 and 902.1 mg·kg-1 for the Syrah variety in Wessner and Kurtural (2013). Eshghi et al. (2014) also reported that the total anthocyanin content of berries varied significantly among the 35 grape cultivars grown in Iran. They indicated that the total content of anthocyanin in the berries of grapevine cultivars varied from 42.74 mg·kg-1 to 619.04 mg·kg-1 based on fresh weight. The order of amounts of non-acylated anthocyanins in both years was malvidin > peonidin > petunidin > delphinidin > cyanidin, consistent with previous results obtained for different native Greek varieties (Kallithraka et al., 2005) and for Syrah grapes grown under semiarid conditions (Kyraleou et al., 2015). The cyanidin level was as low as 1% of total anthocyanins (Winkler et al., 1974; Kelebek, 2009). Although our values are partially in agreement with those reported in previous studies, the differences may result from variety, maturation stage, ecological conditions, viticultural practices, and different analysis methods (Cantos et al., 2002; Chalmers, 2007; Kelebek 2009; Lachman et al., 2009; Kurtural et al., 2013).
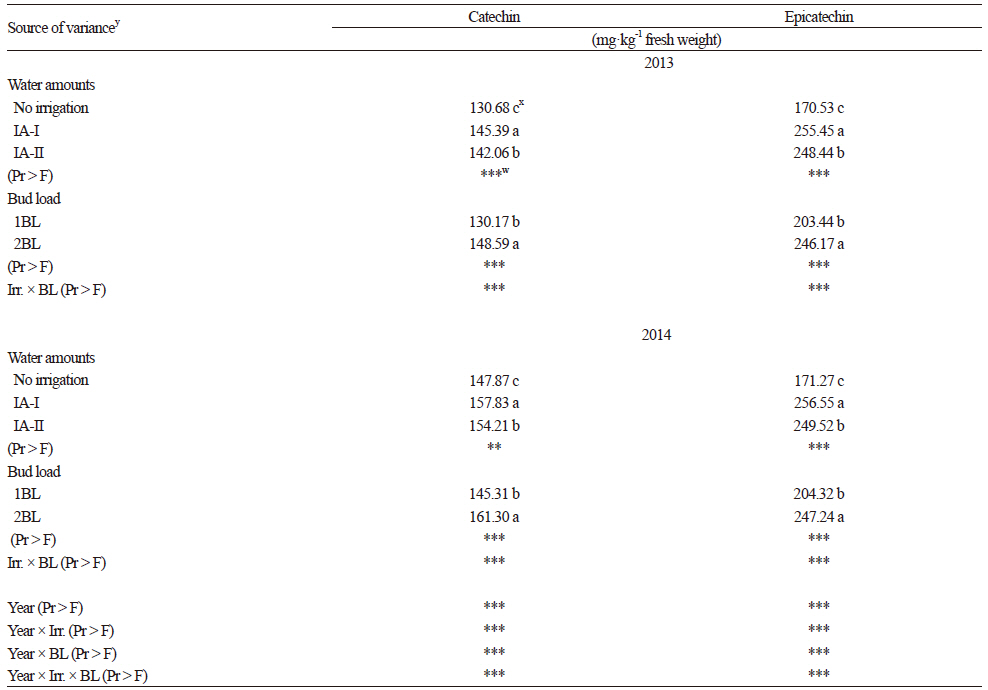
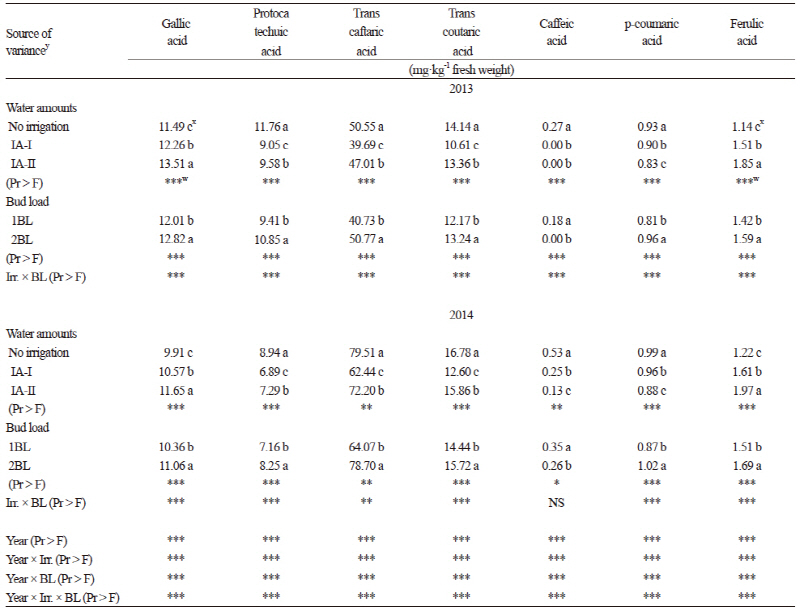
For the non-colored phenolic compounds (NPC), two flavanols (Table 5), seven phenol acids (Table 6), and four flavonols (Table 7) were identified and quantified in Kalecik Karası berries. All of these compounds were affected by the treatments in both years of the study. The levels of flavanols, some phenolic acids (gallic and ferulic), and total NPC were increased by the irrigation treatments in both years. Catechin and epicatechin (Table 5) were significantly higher (p ≤ 0.05) in the IA-I treatment than in the other treatment and the control for both years of the study. Gallic acid, ferulic acid and total NPC were the highest in the IA-II treatment. Quercetin 3-glucoside was significantly higher (p ≤ 0.05) in the IA-I treatment in both years. Considering the other NPCs, values significantly increased in the non-irrigated vines (p ≤ 0.05) (Table 6 and 7). Flavanols (Table 5), phenol acids (except caffeic acid) (Table 6), and total NPC values were significantly higher in the 2BL treatment (p ≤ 0.05) compared to the 1BL treatment. The total NPC values ranged from 403.29 mg·kg-1 and 449.94 mg·kg-1 (in the non-irrigated control) to 486.34 mg·kg-1 and 524.33 mg·kg-1 (in the IA-II treatment) in 2013 and 2014, respectively (Table 7). These values are in accordance with results from Cantos et al. (2002) in which total phenolics ranged from 115 (Dominga) to 361 (Flame seedless) mg·kg-1 fresh weight of berries. Lachman et al. (2009) also indicated that the values of total phenolics of berry skin obtained from different regions ranged from 370.1 mg·L-1 to 238.7 mg·L-1. Our results are also in accordance with the values found by Kelebek (2009), Gökturk Baydar et al. (2011), and Eshghi et al. (2014). Catechin and epicatechin are presumed to be the most important elements among the NPCs (Kennedy et al., 2002). According to Zarrouk et al. (2012), the effect of water amounts on grape flavanol levels seems to be controversial since they have been reported to be moderately affected by deficit irrigation and also not affected by water stress (Kennedy et al., 2002). In our study, the accumulation of total phenols and especially flavanols was enhanced by irrigation in comparison to the non-irrigated berries. This suggests that water availability has a positive effect on the accumulation and biosynthesis of phenols.
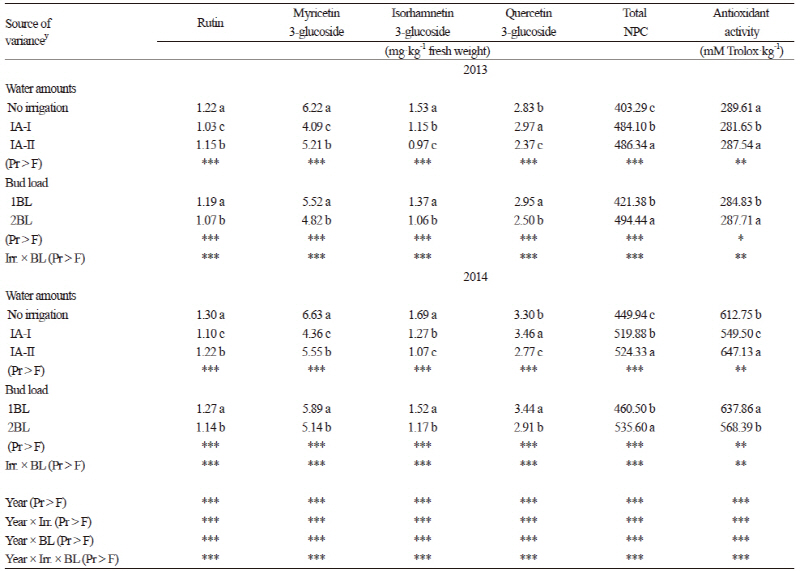
No clear relationship was found between the treatments and antioxidant contents (Table 7). The effects of the treatments on antioxidant content changed in the different years of this study. According to Kyraleou et al. (2015), the antioxidant content of skin extracts was not affected by irrigation, whereas özden et al. (2010) reported a decrease in antioxidants with increasing irrigation levels.
Romero et al. (2010) examined the effects of various levels of irrigation on phenolic compounds of Shiraz grapes during flowering through veraison and veraison through maturity growth stages. The biosynthesis of compounds varied according to irrigation levels and application periods. Similarly, other studies showed that fruit composition was slightly or inconsistently affected by water shortage and fruit load (Keller et al., 2008; Bowen et al., 2011).
Generally, water stress promotes the accumulation of sugar and anthocyanin (Roby et al. 2004; Castellarin et al., 2007) at the expense of a decrease in yield. Yield results of our study (data not shown) showed that an increase in yield can occur with moderate irrigation and increased bud loads in the high plateau regions without significant changes in the values of important health-related compounds.
