Introduction
Materials and Methods
Results and Discussion
Weather Conditions and The Quantity of Applied Irrigation Water
Morphological Parameters
Physiological Parameters and Nitrogen Content
Fruiting Response and Production Function
Correlation Coefficients of Yield and Morpho-Physiological Properties Under Different Irrigation and Bio-Stimulant Application Regimes
Introduction
Strawberries are one of the most economically important horticultural crops in Turkey. The country is the largest strawberry grower in Europe and is third worldwide after The United States and Mexico (FAOSTAT, 2016), with an average annual production of 375 metric tons (TUIK, 2016). In 2016,
14.189 ha was dedicated to strawberry cultivation with 3.325 ha of this area allocated to high tunnel production (TUIK, 2016). Cultivation under a high tunnel system provides an economical means to improve production (William, 2009). Plastic mulches over drip irrigation systems are increasingly used in the raised-bed cultivation of strawberry to save water, reduce weeds and enhance fruit yield and quality (Yuan et al., 2004).
Reduced availability of fresh water has become a world-wide problem, particularly for Turkey. Around 75% of fresh water resources have been exploited for agricultural irrigation, (SDP, 2014) and the decreased supply has had an effect. A review of the current trends of water availability reveal that agricultural practices are approaching a “water crisis” in some regions of Turkey, most notably in the Mediterranean region (Sezen et al., 2011). Thus, to successfully manage water limitations, scheduling water application is critical to obtaining optimal plant growth and fruiting. Even under optimum conditions, proper irrigation is necessary for strawberries, due to their shallow root systems and sensitivitity to water stress (Farhan and Pritts, 1997). Despite widespread use of irrigation in strawberries, their specific water requrements are uncertain (Lozano et al., 2016). In previous studies, a wide range of irrigation water applications have been reported, but differ depending on the cultivar, production method, climate and water requirement calculations (Hancock, 1999; Lozano et al., 2016). In the Huelva region of Spain, the irrigation supply calculated for strawberry varies between 564 and 795 mm/yr, while the fruit yield varied between 1,027 and 1,084 g/plant(Lozano et al., 2016). In the central coast of California, the irrigation water applied to strawberries varied from 300 to 700 mm/yr and yields ranged from 20 to 50 t·ha-1(McNiesh et al., 1985). In Czechoslovakia, an average of 1,000 mm of water was required to produce approximately 16 t·ha-1 of berries (Prazak, 1979). Irrigation studies with strawberry in Bulgaria suggest that 700 to 800 mm of irrigation water was needed for optimal yield (Ivanov, 1977). In Italy, the optimal water application on strawberries was 485 mm; (Giovanardi and Testolin, 1984) while trials conducted in France and Japan demonstrated utilization of 415 and 336 mm of irrigation water, respectively (Lemaitre, 1976; Yuan et al., 2004) In another study, 300 mm of water in strawberry irrigation was found to be ideal in California, USA (Trout and Gartung, 2004). Variations in irrigation water use suggest that locally conducted trials are required to improve irrigation management in specific regions and cultural systems (Kirschbaum et al., 2004). Excessive irrigation water can result in nutrient leaching and depletion, reduced aeration in the effective root zone, increased disease susceptibility and decreased yield (Farhan and Pritts, 1997). Limited fresh water resources and insufficient irrigation water application induces drought stress, which can lead to reduced fruit yield and quality if it occurs during fruit development (Natsheh et al., 2015). Therefore, water application scheduling is critical to make the most effective use of drip irrigation (Yuan et al., 2004) and optimization of irrigation water use and bio-stimulant applicationare important to improving strawberry production under high tunnels.
A relatively modern agricultural practice for increasing yields is the application of seaweed extracts to horticultural crops. Since 2012, seaweed extracts have attained wider acceptance as “plant bio-stimulants” in Europe (Battacharyya et al., 2015; Calvo et al., 2014) and the European Bio-stimulants Industry Council indicates that in 2012, they were utilized in over 6.2 million hectares planted in Europe (EBIC, 2013). Seaweed bio-stimulants can play a significant role in improving crop production, by reducing the impact of drought stress. Moreover, the bioactive compounds existing in seaweed extracts can enhance the performance of plants under stress conditions (Battacharyya et al., 2015), proving beneficial as an alternative to other stress mitigation practices.
The importance of strawberry to farmers in Mediterranean Turkey, necessitates investigations into the irrigation and agricultural practices affecting its productivity and quality. Although there are a number of separate studies on irrigation and bio-stimulants, this study evaluates the mutual effects of irrigation regimes and bio-stimulant application. The objectives of this work were, (1) to determine the response in strawberry growth and productivity to various drip irrigation regimes under high tunnels in the Mediterranean environment of Turkey, (2) to test the effectiveness of bio-stimulants on strawberry yield and water stress and (3) to provide guidance and recommendations to regional growers on irrigation water and bio-stimulant application for a specific strawberry cultivar.
Materials and Methods
The experiment was executed inside the high tunnel at the Çukurova University experimental farm (latitude: 36°59'N, longitude 35°27'E, 20 m above sea level). A typical Mediterranean climate prevails in the experimental area, with cool, rainy winters and hot, dry summers. The soils at the site have been classified as Xerofluvents of the Entisol order with heavy clay texture (Dingil et al., 2010). The soil bulk density for the top 0.3 m is 1.6 g·cm-1 and the pH is 7.6. The soil water content at field capacity and permanent wilting point are 36% and 16%, respectively. The strawberry (Fragaria-ananassa Duch.) ‘Rubygem’, of short day type, earliness, good taste and aroma, was planted on November 10 [referred to as 0 d after planting (DAP)] 2015 and cropping continued until June 8, 2016. The frigo plant material was used. The high tunnel was made of a steel frame covered by 0.1 mm thick transparent polyethylene (PE) film, with a center height at 2.50 m and 0.8 m at the open sides (40 m long and 6.5 m wide). To monitor temperature and humidity, a data logger (Extech instruments, model 42270) was (1.5 m above soil surface) placed in the center of the high tunnel. The area inside the tunnel was heated solely by solar radiation.
The berries were planted in trapezoidal raised beds measuring 0.70 m at the base, 0.50 m at the top, with a height of 0.30 m, and a 0.3 m distance between each bed. Each were covered with a 0.05 mm thick, two-sided polyethylene mulch cover, having a grey upper side and black under side, (in accordance with conventional cultural practices in the area) with surface drip irrigation installed down the center. Strawberries were planted in two rows, 0.3 m apart, with plants set 30 cm apart, to an equivalent plant density of 6.65 plants/m2. Each tunnel had four beds. After planting, sufficient water was applied until the plants were well developed. Fertilizer was applied uniformly to each treatment by drip irrigation and foliar application of agricultural pesticides served to control foliar and fruit diseases.
The trial was implemented as a 4×2 factorial scheme of irrigation levels and bio-stimulant use, in a split-plot design with 4 replicates (blocks) combined over six periods, totaling 32 plots. Applications (bio-stimulant use and control) were designed over the main plot and different irrigation regimes were arranged as the sub plots. The obtained data were analyzed with the statistical program JMP version 5.0.1 (SAS Institute Inc., Cary, NC, USA). ANOVA was calculated to determine the effects of irrigation regime and bio-stimulant on the observed parameters, combined over six periods. A Least Significant Difference test was performed to examine the differences among groups. Comparisons that yielded p≤0.05 were considered statistically significant. Additionally, using JMP 5.0.1., the multivariate method was used to determine the correlation among all the obtained results, with p≤0.05. The four irrigation treatments were designated Ir50, Ir75, Ir100, and Ir125, where the water quantities applied were 0.5, 0.75, 1.00 and 1.25 times the pan evaporation (Epan). Epan value was determinated using the US Weather Service Class A pan, with a standard 120.7 cm diameter and 25 cm depth, as placed over the crop canopy in the center of the high tunnel. Four irrigation treatments were established in four beds of four, 10 m by 4 m plots, with 266 plants per plot. Soil moisture sensors (Decagon Ech10HS, USA) were installed 30 cm deep to monitor soil water content throughout the vegetation period. Two beds per plot were allocated to receive the commercial seaweed bio-stimulant application, in soluble powder form, along with control beds. The content of the bio-stimulant was certified by BCS, the EU-accredited inspection and certification body, (BCS Öko-Garantie GMBH, Nurnberg, Germany) as seaweed extract, containing organic matter (67%), K2O (1.5%), alginic acid (18%) and gibberellic acid (250 ppm). The bio-stimulant was applied as a foliar spray at approximately 9:00 am on 64, 84, 104 and 124 DAP. Each treatment consisted of 40 g extract per 30 L of water. Fresh water (salinity 0.18 dS·m-1) was applied using the drip tube, with emitters spaced every 30 cm, and a flow rate of 2.7 L·h-1. The quantity of irrigation water applied was calculated using Eq. (1)
Where, t is the irrigation time (h), A is the plot area (m2), Epan is the cumulative free surface water evaporation at irrigation interval (mm), Pc is the plant cover (%), Kcp is the crop-pan coefficient (0.7) (Kanber, 2006), q is the flow rate of emitters, and n is the number of emitters in the plot.
In order to evaluate the morpho-physiological responses of strawberry, several samplings were taken from plants at 79, 107, 137, 164, 192 and 209 DAP. Evaluation of leaf area (LA), above ground dry matter (DM), crown number (CN), crown diameter (CD), midday leaf water potential (Ψb, µmol·m-2·s-1) and stomatal conductance (gs, bar) were conducted to characterize the vegetative growth and physiological responses at each instance of sampling.
Midday leaf water potential (Ψl) was measured with a pressure chamber (Soil Moisture Equipment Corp., Santa Barbara, CA, USA) and stomatal conductance (gs) was measured with a Model SC-1 Leaf porometer (Decagon Devices). Measurements were taken on fully expanded upper canopy leaves (three leaves per plot) from 11:00 to 13:00. Three plants from each plot were cut at the soil surface, their leaflets separated from the petioles, and LA measured with a leaf area meter (model 3050A; Li-Cor Lincoln, NE, USA). To obtain a value for DM, the above-ground tissue was dried in an oven at 70°C until the weight was maintained. The same plants were used to determine the CD and CN. The CD value measurs the irregularity in crown shape, as a whole (Cantliffe et al., 2007).
Fruits and leaves were analyzed for their N content on a fresh weight basis. For total N estimation, dried plant samples were digested in a di-acid mixture of HClO4 and H2SO4 (4:1), along with a catalyst mixture, at 360 to 410°C in a digestion assembly, followed by distillation and titration of absorbed ammonia in boric acid (Jackson, 1973).
Mature strawberry fruits were harvested twice a week from late February through June. The average fruit yield in g/plant under different treatments was based on the total weight of fruits harvested from ten plants, selected from each treatment. The mean fruit weight was calculated by weighing each fruit on each harvest date.
Results and Discussion
Weather Conditions and The Quantity of Applied Irrigation Water
The climate of a region describes the long-term average temperature, humidity and precipitation and, in the absence of any weather extremes, determines the realized yields for a given region (Holliger and Angel, 2011). The average air temperature and humidity during the 2015-2016 strawberry growing season was near long term (1960 to 2014) averages (0.3°C higher and 1.6% lower, respectively). Inside the high tunnel, the average growing season temperature ranged between 2 and 4.4°C higher than the outside temperature, while humidity was approximately the same. Powell and coworkers, (2013) obtained similar results, showing that high tunnels maintained temperatures about 3 to 4°C higher than the outside temperature with similar relative humidity levels. Due to technical constraints, the temperature and relative humidity measurements were only obtained from January on in the high tunnel.
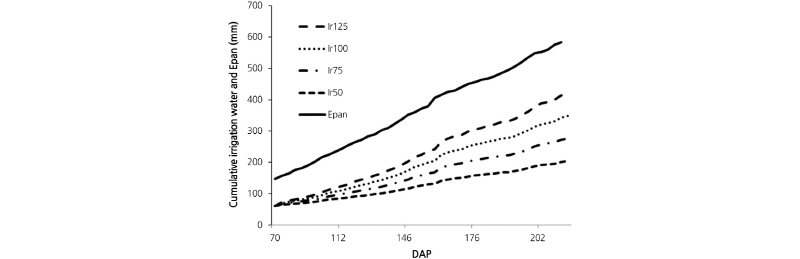
Plants were watered solely by irrigation water, as there was neither rainfall nor run-off in the high tunnel. As such, soil water storage was not considered. Fig. 1 reflects the cumulative irrigation water of the treatments and the fractions of the cumulative pan evaporation. The same amounts were applied for both the bio-stimulant and control applications. After planting, the crops received equal amounts of water (60 mm) and the Epan value from November 10, 2015 to January 19, 2016 (70 d) was 126 mm. From the initiation of the treatment to the end of the trial, a total of 357, 285, 214 and 143 mm water were applied to Ir125, Ir100, Ir75 and Ir50 respectively. Between January 19 and June 8, (141 d) 458 mm of Class A pan evaporation was measured and a total of 44 irrigation applications were made. The applications were made twice weekly between January 28 and April 23, and then three times per week as leaf water potential declined. In the irrigation period between January 28 and March 21, 2016, the average irrigation water amounts applied were 0.64, 0.96, 1.28 and 1.60 mm·d-1 for Ir50, Ir75, Ir100 and Ir125, respectively. In the period between March 22 and June 8, 2016; the irrigation water quantity increased and the average were 1.30, 1.95, 2.60 and 3.26 mm·d-1 for Ir50, Ir75, Ir100 and Ir125, respectively. These were similar to previously reported values for the second period; 2.06 (Epan75), 2.75 (Epan100) and 3.43 (Epan125) mm·d-1 (Yuan et al., 2004). Previous studies on drip irrigation in strawberry production report a wide range in irrigation water application, between 250 mm and 825 mm (Lozano et al., 2016; Kumar and Dey, 2011; Strand 2008; Trout and Gartung 2004; Yuan et al., 2004; Kanber et al., 1986). In the current study, the irrigation water amounts were in keeping with those of Yuan et al. (2004) (254 to 414 mm) and Kanber et al. (1986) (424 mm), whom both utilized the same growing conditions and methods for irrigation water calculations. The irrigation water quantities in Ir125 and Ir100 were much lower than the Epan values, as canopy coverage (0.43-0.7) and Kcp (0.7) were factored into the calculations. From the initiation of the irrigation regimes, the soil had a water content of 34 vol%, 31 vol%, 26 vol%, 20 vol% for Ir125, Ir100, Ir75 and Ir50, respectively.
Morphological Parameters
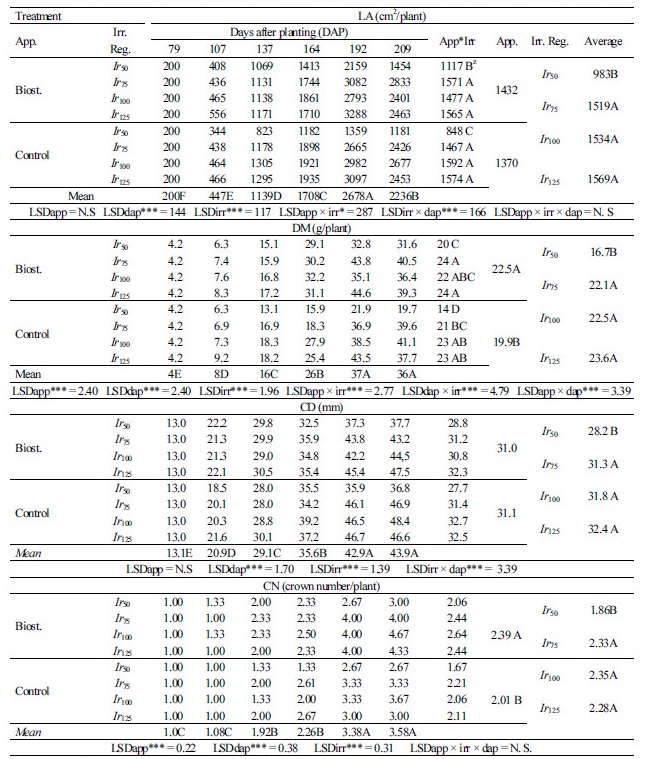
The LA, DM, CD and CN per plant under different treatments are presented in Table 1. Vegetative development in strawberry was completed at approximately 192 DAP, similar to other results under similar conditions, showing completion at 199 DAP (Serrano et al., 1992). The measured parameters, for LA, DM, CD and CN, ranked the same, regardless of irrigation regime. The Ir50 treatment caused a significant decline in morphological parameters, indicating that the irrigation amount did not meet the plant water requirement. Diminishing growth rate is one of the earliest responses of plants to water deficit (Hsiao, 1973). Similarly, reductions in LA and DM have been noted under water stress conditions (Ghaderi et al., 2015; Grant et al., 2010; Grant et al., 2012; Liu et al., 2007). Here, we observed that increased irrigation water enhanced the LA, DM and CD, but, not to a statistically significant amount, as the variables remained similar for Ir75, Ir100 and Ir125. Previous studies have revealed that higher rates of irrigation water application have caused significant increases in both LA and DM (Serrano et al., 1992; Yuan et al., 2004; Grant et al., 2010; Grant et al., 2012), so the limited vegetative growth observed here may be due to the cultivar. The effect of the bio-stimulant was significant in DM and CN, while LA was not significantly increased. The average of the parameters increased by 4.5%, 13% and 18.9% for LA, DM and CN, respectively but did not change for CD. These results indicate that an increase in crown number per plant from 2.01 to 2.39 could have a positive effect on yield. The irrigation level: bio-stimulant interaction significantly affected the LA and DM, while no differences were observed in CD or CN. Under water stress conditions (Ir50), bio-stimulant applications considerably aided the reduced growth rate, increasing LA and DM by 31% and 42%, respectively, when compared to control. Previous works have found that seaweed extract bio-stimulants both promote plant growth and enhance abiotic stress tolerance (Battacharyya et al., 2015). The growth and development of vegetation is controlled by phytohormones, like gibberellic acid, and commercial seaweed extracts effect plant growth by regulating phytohormone activity, thus explaining the improved growth of strawberry found in the present study (Khan et al., 2009). It is possible that bio-stimulant application increased leaf area, and improving light interception, thereby heightening the photosynthetic rate and increasing plant productivity (Koester et al., 2014).
Physiological Parameters and Nitrogen Content
Reduced water availability is the main factor leading to stomatal closure, which regulates the gas exchange between the leaf and the atmosphere (Klamkowski and Treder, 2008). This rationale coincides with our results for gs (355 to 573 µmol·m-2·s-1) and Ψl (-20.9 to -16.1 bar), as the values significantly increased with higher amounts of irrigation water (Table 2). The sample taken at 192 DAP had gs and Ψl values ranging from 220 to 514 µmol·m-2·s-1 and -14.8 to -21.8 bar, respectively, in the control application and previous studies obtained similar results (Liu et al., 2007; Klamkowski and Treder, 2008; Grant et al., 2010; Grant et al., 2012). The lowest Ψl was obtained at 164 DAP, the start of thrice weekly irrigations, hence the significant increase in leaf water potentials. In contrast to leaf water potential, stomatal conductance did not increase after 164 DAP. The contrasting response between Ψl and gs could be due to the osmotic adjustment of the plant, affecting leaf water potential (Zhang and Archibold, 1993). Osmotic adjustment does not occur in all species, but has been shown to occur in strawberry (Pomper and Breen, 1997). Previous studies have also shown where bio-stimulant applications resulted in a significant increase in gs and Ψl (Zhang and Archibold, 1993), and that it assists in sustaining membrane integrity (Battacharya et al., 2015) and helps to create balance when faced with a limited water supply (Hare et al., 1998). In greenhouse studies, bio-stimulant treatment to bedding plants significantly increased the leaf water content and improved the recovery from water stress, as compared to the controls (Little and Neily, 2010). Wilson (2001) documents that the average leaf water potential was raised from -15.7 bar to -15.1 bar after nine days of seaweed extract application. Our results show a 9% increase in gs and a 3% increase in Ψl , a trend in keeping with previous studies. Although the irrigation and bio-stimulant interactions are statistically insignificant, Ψl and gs differred in the range of -21.3 to -15.7 bar and 341 to 588 µmol·m-2·s-1, respectively. Thus, seaweed bio-stimulants are shown to alleviate water stress on strawberry. The process by which seaweed extracts improves stress tolerance in plants is not well known, but the presence of bioactive molecules in the extracts, such as the betaines and cytokinins, may play a significant role (Zhang and Ervin, 2008).
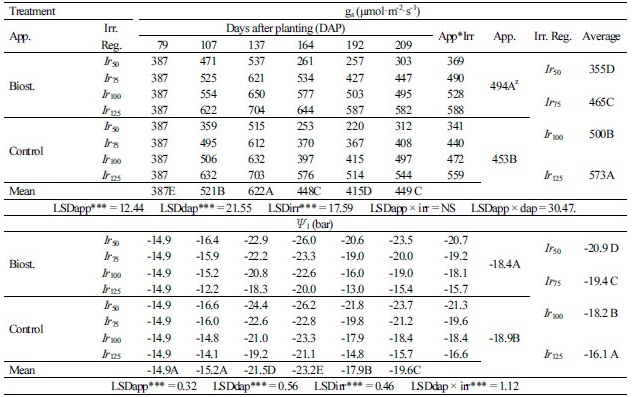
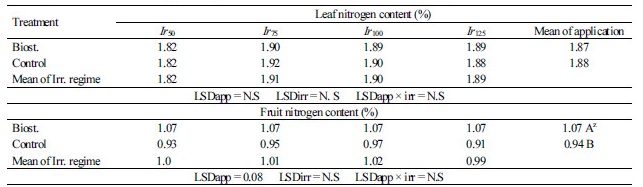
Nitrogen is an essential element required for plant growth (Liu et al., 2014; Haifa, 2014). As the leaf blade is more susceptible to N deficiency, it is a better indicator of the nitrogen supply status in the strawberry plant (Iatrau and Papadopoulos, 2016). Strawberry quality decreases if nitrogen levels are outside of the range 1.8 to 2.8% (Haifa, 2014). The leaf nitrogen content by irrigation regime and bio-stimulant application in this study and are within this range (Table 3). These results reveal that the leaf nitrogen content in all treatments was optimal for growth and quality of strawberries and was not affected by irrigation or bio-stimulant application. Fruit nitrogen content at peak harvest provides a sufficiently representative estimate for calculating the nitrogen of the total strawberry crop, as the fresh weight nitrogen content is a function of dry matter content, and therefore fruit quality (Black et al., 2005). The fruit nitrogen concentrations reported here, (0.91% to 1.07%) are similar to values previously reported in winter production systems (0.9 to 1.34%) (Albreghts and Howard, 1978; Black et al., 2005). There was no significant effect of irrigation or irrigation application interaction on fruit nitrogen content. However, bio-stimulant application increased fruit nitrogen content by approximately 14%, likely because seaweed bio-stimulants enhanced nitrogen assimilation and the basal metabolism in plants (Khan et al., 2011; Sarfaraz et al., 2011). Higher fruit nitrogen content could be due to increased nitrogen uptake efficiency, or allocation of a larger percent of gained nitrogen to the fruit, compared to vegetative tissues (Moll et al., 1982). Improving nitrogen uptake efficiency, via bio-stimulant use could reduce fertilizer inputs, thereby reducing soil water contamination, environmental pollution and soil acidification. The effects of bio-stimulants on fruit nitrogen content reveal the need for more detailed analysis to determine their influence on strawberry physiology.
Fruiting Response and Production Function
Crop yield is used to estimate the economic benefits of agricultural production. The purpose of planting any crop is to achieve optimum yield and optimum quality (Yuan et al., 2004). In the current trial, the strawberry harvest ran for 105 d (February 26 to June 10). There was a significant increase in total berry yield and number of berries between the Ir50 treatment and the other irrigation regimes (Table 4). A similar observation was made for LA, revealing its effect on the yield. The observed differences in berry yield and number, LA, and CN between the water stressed Ir50 treatment and other treatments also was in agreement with previous results (Serrano et al., 1992; Grijalba et al., 2015; Liu et al., 2007; Gerhmann, 1985).
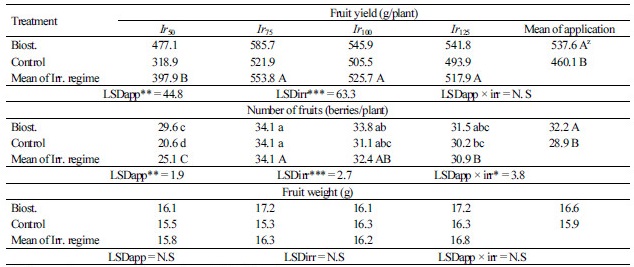
In spite of the trend towards increasing yield with increased irrigation water quantity (Rennquist et al., 1982; Save et al., 1993), the highest yield obtained here was in the Ir75 treatment, while yields of Ir75, Ir100 and Ir125 did not reveal any statistically significant increase. The fruit weight did not show significant change under the various irrigation regimes, although it was lower in the Ir50 treatment, showing a 28% reduction from the Ir75 treatment. In an irrigation study of ten strawberry to cultivars, while limited water substantially reduced yield in some cultivars (40%), most still maintained yield (60%), possibly due to a reduced response to irrigation water (Grant et al., 2010).
There are various reports on the beneficial effects of seaweed bio-stimulant extracts on crop yield (Stirk and van Staden, 2006; Khan et al., 2009; Craigie, 2011) and recent studies have shown increased yield in strawberry as well (Spinelli et al., 2010; Alam et al., 2013). In this study, the seaweed bio-stimulant application raised both yield (17%) and the fruit number (11%) significantly, and fruit weight by an insignificant margin (4%). Foliar application of seaweed bio-stimulant extract may have increased yield via root growth enhancement and increased microbial diversity and activity in the strawberry rhizosphere (Alam et al., 2013). The positive effect of the bio-stimulant on yield was lower despite the increase in the irrigation water. Bio-stimulant application caused a 50% yield increase in the Ir50 irrigation treatment, but a smaller boost was noted in Ir75 (12%), Ir100 (8%), and Ir125 (10%) treatments. Thus, the benefit of the bio-stimulant decreases with increased of irrigation water. This could be due to the limited yield potential of the strawberry cultivar used. Furthermore, the irrigation: bio-stimulant application interaction was only statistically significant for the number of fruits harvested, showing a 43% increase over control in the Ir50 treatment. Thus, bio-stimulant application in strawberry production can be an important water stress mitigation option.
In this trial, production functions concerned the total amount of applied irrigation water on strawberry fruit yield (Fig. 2). Through polynomial regression analysis, the mathematical function showed high significance for the control and slightly lower for the bio-stimulant application factor. Production functions related to irrigation water (Ir, mm) for strawberry fruit yield (y, g/plant) are:
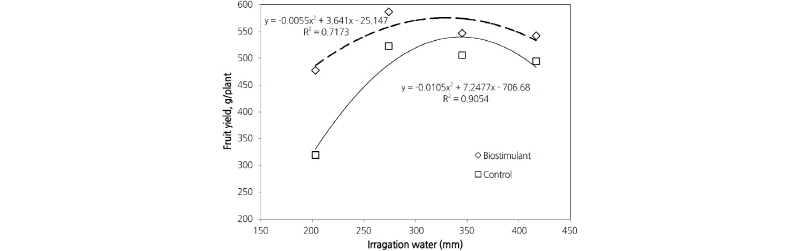
A polynomial relationship of irrigation water and yield for drip irrigated strawberry had been previously formulated (Yuan et al., 2004), thus polynomial relationships for these variables can provide approximations of irrigation-fruit yield in both control and bio-stimulant applications.
Correlation Coefficients of Yield and Morpho-Physiological Properties Under Different Irrigation and Bio-Stimulant Application Regimes
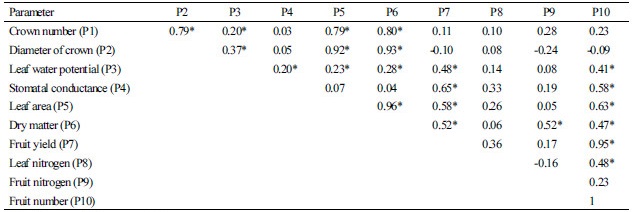
Table 5 reflects the correlations between the variables evaluated in the Rubygem cultivar 209 d after planting under different irrigation regimes and applications. The physiological variables (Ψl, gs), were positively correlated with yield (production and number of fruits). Decreased Ψl reduced stomatal conductance (Ghaderi et al., 2015), and decreased gs reduced the photosynthetic assimilation rate (Flexas and Medrano, 2002), thereby causing reduction in yield. There were positive correlations between CN and CD with Ψl, LA and DM, however, CN and CD did not affect the yield significantly; an observation made in a previous study (Cocco et al., 2011). As LA is highly correlated with yield and fruit number, the increased LA may most likely enhances photosynthesis and thus, the ability to produce more photo-assimilates and in turn, produce more fruits (Cocco et al., 2011; Grijalba et al., 2015). Leaf nitrogen content was positively correlated with fruit number, as higher leaf nitrogen content increases CO2 assimilation and photosynthetic capacity (Kirschbaum et al., 2010; Moon et al., 1990).
Optimum yield was obtained in the, Ir75 irrigation regime, coupled with bio-stimulant application. Considering the large area under strawberry production in Mediterranean countries, adoption of these practices could lead to appreciable water savings (-25%). Furthermore, application of bio-stimulant positively influenced fruit dry matter by increasing nitrogen content, and enhancing the photosynthetic process, increasing stomatal conductance and leaf water potential.