

Introduction
Materials and Methods
Plant Materials and Growth Conditions
Survey of Growth and Physiological Response
Observation of Morphological Responses
Statistical Analysis
Results and Discussion
Changes in Growth Responses to Different Irradiance Treatments
Changes in Physiological Responses to Different Irradiance Treatments
Changes in Morphological Responses to Different Irradiance Treatments
Introduction
Light is an essential environmental factor that affects crop growth (Avercheva et al., 2009; Fukuda et al., 2008; Goins et al., 1997), and different light levels can result in a remarkable variation in growth patterns, morphological differentiation, and physiological responses in crops (Ali et al., 2005; Fan et al., 2013; Hussey, 1963; Schneider et al., 2006). A variety of plant physiological disorders and diseases can
occur when the available irradiance is not optimal, and this can have a negative impact on crop yield (Roberts and Paul, 2006). Under the climate change scenario “the Representative Concentration Pathway (RCP) 8.5”, which assumes that there will be no effort to reduce greenhouse gas emissions, rainfall is predicted to increase considerably from the present levels (IPCC, 2007). The increased rainfall is expected to decrease the total hours of sunshine and reduce radiation available for crop growth. Recent studies also found that morphological abnormalities of leaves such as tipburn disorders and rough leaves were caused under the RCP 8.5 scenario (Lee et al., 2016). In addition, the RCP 8.5 scenario retarded the growth, assimilation rates, photosynthesis efficiency, and yield of Chinese cabbage.
Chinese cabbage (Brassica campestris L. ssp. pekinensis) is an important vegetable crop that is produced and consumed in many Asian countries. In Korea, it is one of the most consumed vegetables with an annual 47 kg per capita consumption estimated in 2016 (KREI, 2017). It is cultivated throughout the year by using cultivars adapted to spring, summer, fall, or winter plantings. Seasonal plantings are essential because Chinese cabbage is used to make traditional kimchi, which is served up at the table in Korean cuisine throughout the year. The summer Chinese cabbage cultivar can be planted from early June to mid or late August, which has a significant impact on the market price. Because heavy rainfall occurs from June to July in Korea, summer Chinese cabbage often suffers from insufficient irradiation during its early and middle growth stages. Low irradiation reduces the final fresh weight and also impedes head formation by promoting the leaves to wrap tightly around one another in the center of the plant. Insufficient head formation diminishes the product quality of Chinese cabbage and decreases the economic returns to producers.
Light is the energy source for photosynthetic organisms, and light intensity plays an important role in plant growth and development. The acclimation of the photosynthetic apparatus to light conditions may reduce its light energy conversion efficiency in some environmental conditions. Light stress of agricultural crops can result from the suboptimal light intensity and lead to the retardation of plant growth. Low light conditions inhibit plant growth and productivity by affecting gas exchange, whereas excess light intensity has detrimental effects on the photosynthetic apparatus (Lichtenthaler et al., 2007; Avercheva et al., 2009). As a result, plants have developed sophisticated mechanisms to adapt their structure and physiology to the prevailing light environment, and suitable light conditions are vitally important for optimizing phytochemical biosynthesis, metabolism, and accumulation. The effects of decreased irradiance on the growth of Chinese cabbage were reported in field studies that employed physical shading; however, this approach also interfered with various real-time meteorological factors (Boo and Lee, 1999; Sohn et al., 1995), which made it difficult to interpret the experimental data. In addition, studies on the growth, morphological and physiological responses of Chinese cabbage to suboptimal light intensity before early head formation are not well represented in the literature. The current study was performed with Chinese cabbage cultivar ‘Chungwang’ grown in growth chambers. This approach enabled us to measure the growth and physiological responses of Chinese cabbage to different irradiance in a facility where light and temperature conditions were carefully controlled throughout the growing season. The objective of the present study was to examine the growth, leaf morphology, physiological responses, and quality of Chinese cabbage under different light intensities and determine the optimum light intensity for the high-quality production of this crop species.
Materials and Methods
Plant Materials and Growth Conditions
Seeds of Chinese cabbage (Brassica campestris L. ssp. pekinensis ‘Chungwang’) were initially sown in 72-cell plug trays containing a mixture of nursery soil and perlite (3:1, v:v). The plug trays in which the young seedlings grew were transferred to the greenhouse at the Agricultural Research Center for Climate Change, the Institute of Horticultural and Herbal Science in Korea, and grown at 23/15°C day/night temperatures and were well-watered without nutrients under natural light for 30 d. Healthy seedlings with 3-4 leaves were individually transplanted to 15 L rectangular pots filled with the soil mixture of nursery soil and perlite (3:1, v:v) and cultured in environment growth chambers (GR96, Environmental Growth Chambers, Inc., Chagrin Falls, USA). The temperature setting was based on daily air temperature values for Taebaek, Korea, which is a major summer Chinese cabbage producing area. Air temperature intervals were based on the average from 25 years of temperature data (i.e., 1983-2007 at the Taebaek Regional Meteorological Administration) for this location taken between June 10 and July 30. Air temperatures in the growth chambers corresponded to the early and middle stages of cabbage growth in Taebaek and were adjusted stepwise in 10 d intervals over a total of 49 d (Fig. 1A). Light intensity varied diurnally and was applied for 49 d after transplanting (DAT). Photosynthetically active radiation was averaged hourly during the 16 h light/8 h dark photoperiod and maximum values for each treatment were 200 (I), 400 (II), 600 (III), 800 (IV), and 1,000 (V) µmol·m-2·s-1 (Fig. 1B). The CO2 concentration and relative humidity inside the growth chamber during the experimental period were 400 µmol·mol-1 and 60%, respectively. All plants were drip irrigated daily with sufficient water (4 L·d-1 per plant) until the end of the experimental period.
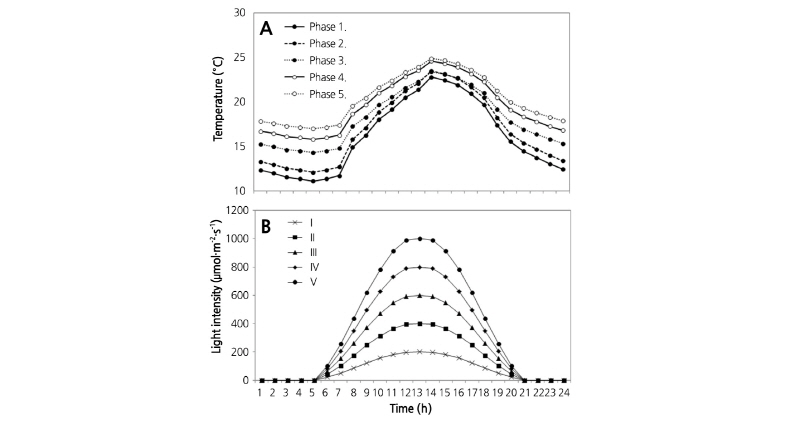
Fig. 1. The effects of changes in temperature (A) and light intensity (B) on growing Chinese cabbage ‘Chungwang’. Temperature values were determined using a 25-year average of local air temperatures during the normal growing season. Phase 1, 1-10 d after planting; Phase 2, 11-20 d after planting; Phase 3, 21-30 d after planting; Phase 4, 31-40 d after planting; Phase 5, 41-49 d after planting. Peak light levels were determined from hourly means and are defined as group Ⅰ, 200 μmol·m-2·s-1; group Ⅱ, 400 μmol·m-2·s-1; group Ⅲ, 600 μmol·m-2·s-1; group Ⅳ, 800 μmol·m-2·s-1; group Ⅴ, 1,000 μmol·m-2·s-1.
Survey of Growth and Physiological Response
Both fresh weight (FW) and dry weight (DW) were measured every 7 d after transplanting. Leaf number was determined for leaves 0.5 cm in length or larger and leaf area was measured with a leaf area meter (LI-3100, LI-COR Biosciences, Lincoln, Nebraska, USA). Chlorophyll fluorescence was measured using a chlorophyll fluorometer (Handy PEA, Hansatech Instr., Norfolk, UK) every 7 d between 7-42 DAT. The mature leaves were adapted to dark conditions for 25 min using leaf clips before measurement. After dark adaptation, leaves were exposed to a saturating flash of actinic light at 1,500 µmol·m-2· s-1 for 1 s. Photosynthetic rates were measured every 7 d between 7-42 DAT using a photosynthesis measuring system (LI-6400, LI-COR Biosciences, Lincoln, Nebraska, USA). Leaves that received light directly during most of growing period were selected between 10:00 to 14:00 for the experiments. The air cuvette temperature, the air CO2 concentration, and PPFD were maintained at 20°C, 400 µmol·mol-1, and 1,000 µmol·m-2·s-1, respectively. The leaves were allowed to equilibrate for 3 min to the test conditions before gas exchange measurements were recorded. Three replicates were used for each plant.
Observation of Morphological Responses
Leaf ultrastructure was examined using 49-d old leaf tissue from the same leaf that was used for gas exchange measurements. Samples were fixed with 2.5% glutaraldehyde prepared in a 0.1 M phosphate buffer (pH 7.0) for 72 h and then dehydrated with an ethanol series. The leaf tissue was embedded using Epon and 4 µm sections were produced with a microtome. The sectioned tissue was dyed with Ruthenium Red and examined with an optical microscope (Axioskop2, Carl Zeiss, Jena, Germany).
Statistical Analysis
The growth experiment was conducted using a completely randomized design. Statistical analysis was performed using the SPSS 13.0 statistical software (SPSS lnc., Chicago, IL, USA). The morphometric parameters (i.e. fresh and dry weight, leaf number, leaf area) were measured in five replicates for each of the five light intensities (200, 400, 600, 800, 1,000 µmol·m-2· s-1) during the eight cultivation time points (every 7 d for 49 d after transplanting). Chlorophyll fluorescence (Fv/Fm) was measured in fifteen replicates for each of the five light intensity conditions or at six-time points during cultivation (between 7-42 d after transplanting) for each individual plant. Photosynthetic rates were measured from three replicates for each of the five light intensities or the six times points during cultivation (between 7-42 d after transplanting) for each individual plant. All data are presented as the average values from all the experiments and comparisons of the data were analyzed using a simple analysis of variance (ANOVA) at a significance level of 0.05.
Results and Discussion
Changes in Growth Responses to Different Irradiance Treatments
The leaf development in Chinese cabbage differed under the various light intensity treatments or culture days after transplanting (Figs. 2 and 3). The biomass of Chinese cabbage ‘Chungwang’ was influenced by changes in light intensity levels (200, 400, 600, 800, and 1,000 µmol·m-2·s-1) as shown in Fig. 2; the plants showed distinct growth responses to different light intensity treatments. The fresh and dry weight of the plants were highest when they were grown in light intensity conditions above 800 µmol·m-2·s-1 (group IV and V), and were lowest in 200 µmol·m-2·s-1 (group I). The FW and DW of the plants gradually increased with an increase in light intensity and longer cultivation times after transplanting; however, the DW increase after 49 DAT was higher in group IV than in group V (Fig. 2A and 2B). Plants grown under the low PPDF of 200 µmol·m-2·s-1 showed no change in FW and DW, indicating that low PPFD were not suitable for their growth. Collectively, fresh and dry mass accumulation was proportional to irradiance and this observation is consistent with previous studies (Avercheva et al., 2010; Sohn et al., 1995). Leaf number and leaf area increased consistently in plants grown in PPDF above 400 µmol·m-2·s-1 when compared to plants grown at a low PPDF of 200 µmol·m-2·s-1. The number of leaves determined 49 DAT was significantly different between plants in groups II, III and plants in groups V, IV (Fig. 2C). Similar to the changes observed in fresh and dry weight, the number of leaves in group I was the lowest of all other treatment groups. Total leaf area and maximum leaf number were affected by the light intensity in a similar manner, but the total leaf area of plants in group IV exceeded that of group V at two-time points in this study (Fig. 2D). Furthermore, mean leaf area of plants in group IV was greater than plants from group V (Fig. 2E). These findings were consistent with an earlier report by Lichtenthaler et al. (1981), which showed that plants grown with shade had greater leaf area than when they were grown in sunny conditions. We speculate that the leaf area of Chinese cabbage ‘Chungwang’ increased at an irradiance of approximately 800 µmol·m-2·s-1 as a result of insufficient light during the early and middle stages of growth. The increase in leaf area under low light growth conditions increases total light interception, which enhances total photosynthate formation by the plant. As a result, the dry weight of plants after 49 DAT from group IV, which had a relatively low light treatment, was higher to group V, which had a relatively high light treatment.
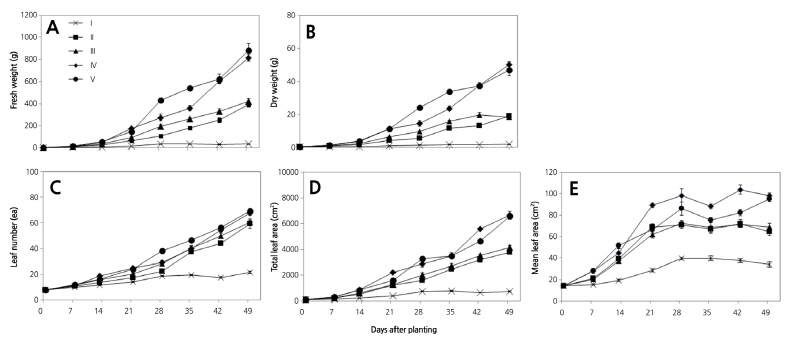
Fig. 2. The effects of changes in the fresh weight (A), dry weight (B), leaf number (C), total leaf area (D), and mean leaf area (E) in response to different light treatments during the early to middle growth stages of Chinese cabbage ‘Chungwang’. Each symbol with an error bar represents the mean ± SE of five replicates. Group Ⅰ, 200 μmol·m-2·s-1; group Ⅱ, 400 μmol·m-2·s-1; group Ⅲ, 600 μmol·m-2·s-1; group Ⅳ, 800 μmol·m-2·s-1; group Ⅴ, 1,000 μmol·m-2·s-1.
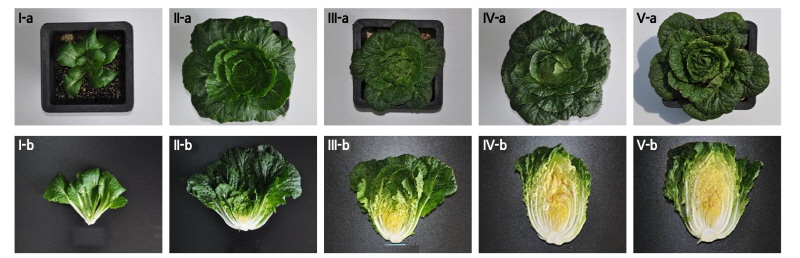
The effects of varying light levels on head development were examined 49 DAT. Head formation was normal for plants in groups IV and V but was incomplete in plants from group III. The head formation was not observed for plants in groups I and II (Fig. 3). These results indicate that head formation in Chinese cabbage can be obtained by acclimatizing plants to light above 600 µmol·m-2·s-1.
Changes in Physiological Responses to Different Irradiance Treatments
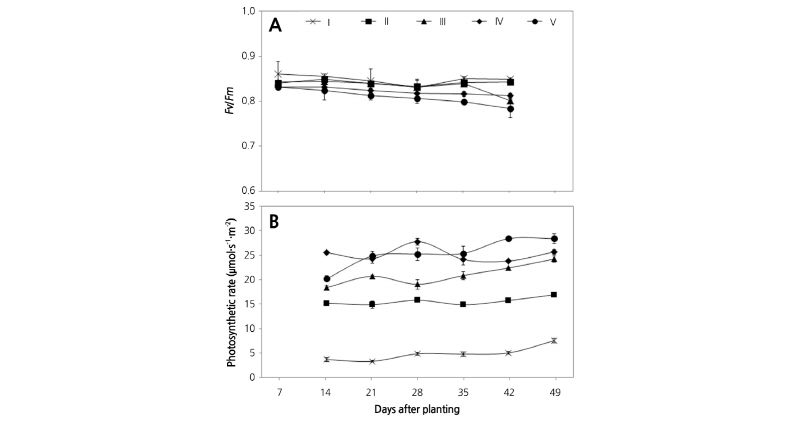
The Fv/Fm and photosynthetic rate were examined under different light intensity treatments or culture duration after transplanting (Fig. 4). Measurements of Fv/Fm using dark-adapted leaves to reflect the maximal photochemical efficiency of the active photosystem-II centers (Fu et al., 2012). Generally, Fv/Fm values in unstressed plants range from 0.8 to 0.85 (Fu et al., 2012; Lichtenthaler and Burkart, 1999), and higher Fv/Fm values suggest that a plant is better adapted to light and has an improved light utilization efficiency (Chen et al., 2006; Li et al., 2002). The Fv/Fm for Chinese cabbage grown under different light intensity conditions are expressed in Fig. 4A. The Fv/Fm values were greater in the low irradiance groups compared to the high irradiance groups, indicating that Chinese cabbage grown under low light was better adapted to light during the early and middle stages of growth. For the plants in group V, Fv/Fm decreased during the early stages of growth and was below 0.8 after 28 DAT. In our experiment, the irradiance used for plant growth in groups III, IV, and V caused light stress even though it is weak. These groups of plants were in light stress that was more severe than the groups I and II exposed to lower irradiance. It could be induced by the high temperatures for daytime (Fig. 1A). The excess light intensity and temperature have detrimental effects on the photosynthetic apparatus in plants (Lichtenthaler et al., 2007). According to the previous studies, high temperatures at midday in late spring can lead to decreased water use efficiency (WUE) and net photosynthetic rate (A), and can ultimately decrease the quality and yield of a crop (Oh et al., 2014). In addition, the photosynthetic rate of Chinese cabbage during the spring season was reduced at temperatures above 25°C, which could be attributed in part to high rates of respiration due to the high temperature itself and/or dry conditions (Oh et al., 2015). Therefore, if irradiance at midday was greater than 1,000 µmol·m-2·s-1 during the growing season, Chinese cabbage ‘Chungwang’ may experience abiotic stress from high light, heat, and drought in the field during the summer season. Studies in the highland areas such as Daegwallyeong, Anbandeog, Taebaek, and Maebong have also confirmed this hypothesis (Kim et al., 2015). Changes in photosynthetic rate per leaf unit area in each light condition were examined (Fig. 4B). Generally, measured photosynthetic rates were proportional to the irradiance treatment, except for plants in group V during early growth stages. This finding contradicts the above results that show that dry weight, number of leaves, and Fv/Fm in group IV were either higher or similar to that of group V. We suggest that the greater leaf area of plants in group IV increased the total photosynthetic capacity, even though the photosynthetic rate per unit leaf area was lower than in plants from group V. This may have increased the DW and leaf development of plants in group IV; however, it may be necessary to measure whole plant photosynthetic rates to definitively explain this finding. The unexpectedly low photosynthetic rates in young plants in group V may be due to temporary stomatal closure in response to excess irradiation (Schindler and Lichtenthaler, 1996).
Changes in Morphological Responses to Different Irradiance Treatments
Leaf cross sections were examined to investigate leaf structure under the five light intensity conditions (Fig. 5) and showed different arrangements of leaf tissues or cell types such as palisade parenchyma, spongy parenchyma, and intercellular space. Light intensity appeared to positively affect the leaf structure of the palisade parenchyma and spongy parenchyma. The leaves grown in high light intensity had better-developed palisade parenchyma, and thicker spongy parenchyma compared to those grown in low light intensity conditions. The leaves from plants grown under low light intensity had an imperfect development of the palisade parenchyma, were more compact, while a clear structure of the palisade cells was observed under increased light intensity. The palisade parenchyma cells of leaves grown under low light were abnormal or rounded in shape, whereas those in the high light treatments had rectangular cell shapes. Moreover, the light intensity elicited differences in the volume of intercellular spaces in the spongy parenchyma. The intercellular spaces in the spongy parenchyma increased in leaves grown under low light intensity compared to the high light intensity condition. Furthermore, leaf thickness and the length of the palisade parenchyma were positively correlated with irradiance. When PPFD increased from 200 to 1,000 µmol·m-2·s-1, the palisade parenchyma length and cell number increased. These findings suggest that thicker leaves are associated with an increase in palisade parenchyma cells. Similarly, this study found that the palisade parenchyma had two to three layers with an increased light intensity. Many studies have reported that leaves from low light treated plants expanded laterally but leaf thickness was decreased, whereas leaf thickness in high light treated plants increased (Lichtenthaler et al., 1981; Pandey and Kushwaha, 2005). In high light intensity conditions, increased leaf thickness seemed to be an adaptive morphological characteristic to minimize water loss during stronger light intensity exposure (Xiao et al., 2008).
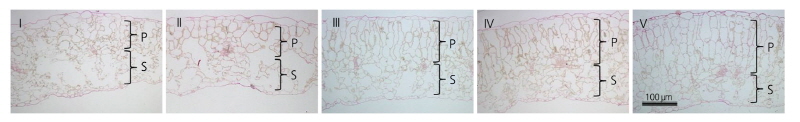
Fig. 5. Microscopic images of vertical sections of Chinese cabbage ‘Chungwang’ leaves exposed to different light treatments. Group Ⅰ, 200 μmol·m-2·s-1; group Ⅱ, 400 μmol·m-2·s-1; group Ⅲ, 600 μmol·m-2·s-1; group Ⅳ, 800 μmol·m-2·s-1; group Ⅴ, 1,000 μmol·m-2·s-1. Samples were harvested 49 d after transplanting. P, palisade parenchyma; S, spongy parenchyma.
In conclusion, the growth of Chinese cabbage ‘Chungwang’ was delayed in light conditions below 600 µmol·m-2·s-1 and the economic value of Chinese cabbage decreased when peak light levels were less than 400 µmol·m-2·s-1 due to the abnormal head formation. On the other hand, leaf development, dry weight accumulation, leafy head formation, and mesophyll tissue formation were similar between the light intensity treatments of 800 and 1,000 µmol·m-2·s-1. However, plants in group IV with a peak light intensity of 800 µmol·m-2·s-1 attained greater leaf area and experienced less light stress than plants in group V, which had a peak light of 1,000 µmol·m-2·s-1. Light regulation of photosynthesis and plant growth may take place via changes in leaf size. The leaf area of plants grown under 800 µmol·m-2·s-1 was better developed compared to other light intensity conditions. Total photosynthetic capacity in plants grown under 800 µmol·m-2·s-1 would increase due to the greater leaf area of these plants, even though the photosynthetic rate was lower than that of plants grown in 1,000 µmol·m-2·s-1. In addition, the Fv/Fm values indicated that Chinese cabbage plants were under mild stress in the 1,000 µmol·m-2·s-1 treatment, and based on these results, is an optimal light intensity strategy that can maximize economic benefits for Chinese cabbage growers in some regions. Therefore, 800 µmol·m-2·s-1 is a recommendable light intensity for the production of certain types of Chinese cabbage; which is also supported by previous reports that the Amax and light saturation points (Qsat) of Chinese cabbage reach their peak at a light intensity of about 800 µmol·m-2·s-1 (Oh et al., 2015). Important recent reviews have detailed the effects of light quality on crop plant growth and development; this study helps to reveal the underlying effects of light intensity on plant growth and how it can maximize the economic benefits for leafy vegetables. Furthermore, the response of morphological and physiological changes to the light intensity at different growth and developmental stages can provide a theoretical basis for further research to improve energy efficiency, develop high-quality products, and high yield cultivation techniques for Chinese cabbage.
