

Introduction
Materials and Methods
Results and Discussion
Environmental conditions during the cultivation period
Logistic growth model development
Treatment effects on the growth and yield
Fruit quality and nutrient solution stability
Resource efficiency and environmental sustainability
Model validation and prediction accuracy
Conclusion
Introduction
Cherry tomatoes (Solanum lycopersicum L.) have grown in economic importance in protected horticulture due to their high market value and strong consumer demand for convenient, nutritious produce. Among the various cultivars, ‘Cupid’ (Sakata Korea Seed Co., Ltd.), a date-type cherry tomato, is characterized by its elongated fruit shape, high sugar content, and excellent shelf life, making it particularly suitable for premium fresh markets. However, optimizing the production of this cultivar requires precise environmental control and nutrient management to achieve a consistent yield and high fruit quality. In protected cultivation, environmental factors such as temperature, solar radiation, and CO2 concentration significantly influence tomato growth and development (Shan et al. 2025). The integration of environmental sensors with growth models has emerged as a promising approach for precision crop management (Marcelis et al. 1998; Heuvelink et al. 2005). Crop growth models, including mechanistic models such as DSSAT-CROPGRO (Shan et al. 2025) and AquaCrop (Wu et al. 2026), have been successfully applied to simulate tomato growth under varying water and nutrient conditions. The AquaCrop model has been extensively validated for greenhouse tomato production, with studies demonstrating its effectiveness in simulating crop responses under various water and nitrogen management strategies (Cheng et al. 2022). These models enable predictions of the phenological stages, biomass accumulation, and yield, providing a foundation for optimized irrigation and fertilization scheduling.
Recent advances in growth-process-oriented modeling have expanded the capabilities of crop simulation further. For instance, Kim and Lee (2025) developed a process-based growth model for cucumber that integrates photosynthetic efficiency, carbohydrate partitioning, and organ development, demonstrating the importance of mechanistic approaches for accurate yield predictions under variable environmental conditions. Such growth-process-oriented models provide a complementary perspective to the logistic growth models employed in the present study, with the former emphasizing physiological mechanisms while the latter focuses on empirical growth patterns. Recent advances in machine learning and artificial neural networks have enhanced the accuracy of growth predictions. Studies have demonstrated that RGB image indices combined with artificial neural network models can achieve high prediction accuracy for tomato fresh biomass (R2 = 0.84–0.99), dry biomass (R2 = 0.88–0.98), and yields (R2 = 0.83–0.96) under different irrigation regimes (Abd El-baki et al. 2024). However, these approaches often require extensive calibration and may not capture the underlying physiological processes driving growth. Logistic growth models, which describe sigmoidal growth patterns with a carrying capacity, have been widely applied to model plant height, the leaf area index, and fruit development in tomato (Fang et al. 2022). The logistic equation , where K denotes maximum growth, b is the initial growth parameter, and c is the growth rate coefficient, provides a parsimonious yet robust framework for predicting crop development over time. When integrated with environmental data such as growing degree days (GDD), logistic models can account for the effects of temperature on growth rates, enabling more accurate predictions across different seasons and environments. Temperature is a critical factor influencing tomato fruit growth and development, with studies showing that both the rate and duration of fruit development are strongly modulated by temperature regimes (Adams et al. 2001). Nonlinear growth models have been recognized as an effective alternative to traditional ANOVA in analyzing tomato trial data, with the logistic model showing superior performance due to its unbiased parameters and compliance with statistical assumptions (Sousa et al. 2019).
In hydroponic systems, nutrient solution management is critical for achieving optimal growth and yield outcomes. The ion balance model developed by Soh and Lee (2012) demonstrated that EC can be accurately estimated from total equivalent ion concentrations with high reliability (R2 = 0.96–0.98), providing a theoretical foundation for precision nutrient management. Furthermore, the pH variance model depending on the phosphate ion forms (Soh et al. 2015) enables precise predictions of pH fluctuations in nutrient solutions, which are essential for maintaining optimal nutrient availability. Conventional approaches rely on timer-based or sensor-based irrigation, which may not adequately respond to the dynamic nutrient requirements of the crop throughout its growth cycle (Razzak et al. 2024). Model-driven nutrient management, which uses growth models to predict crop demand and adjust nutrient supply levels accordingly, offers the potential to improve nutrient use efficiency while maintaining or enhancing yields. Despite these advances, empirical research that integrates growth modeling with model-driven nutrient management for cherry tomato cultivars in Korean protected cultivation remains scarce (Son et al. 2022; Kim et al. 2023). Therefore, the objectives of this study were as follows: (1) to develop logistic growth models for plant height, the leaf area index, and the fruit yield of ‘Cupid’ cherry tomato using GDD as the independent variable; (2) to compare soil cultivation, conventional hydroponic management, and model-driven hydroponic management performance outcomes in terms of growth, yield, and resource efficiency; and (3) to validate the prediction accuracy of the developed models through a regression analysis that compares predicted and measured values.
Materials and Methods
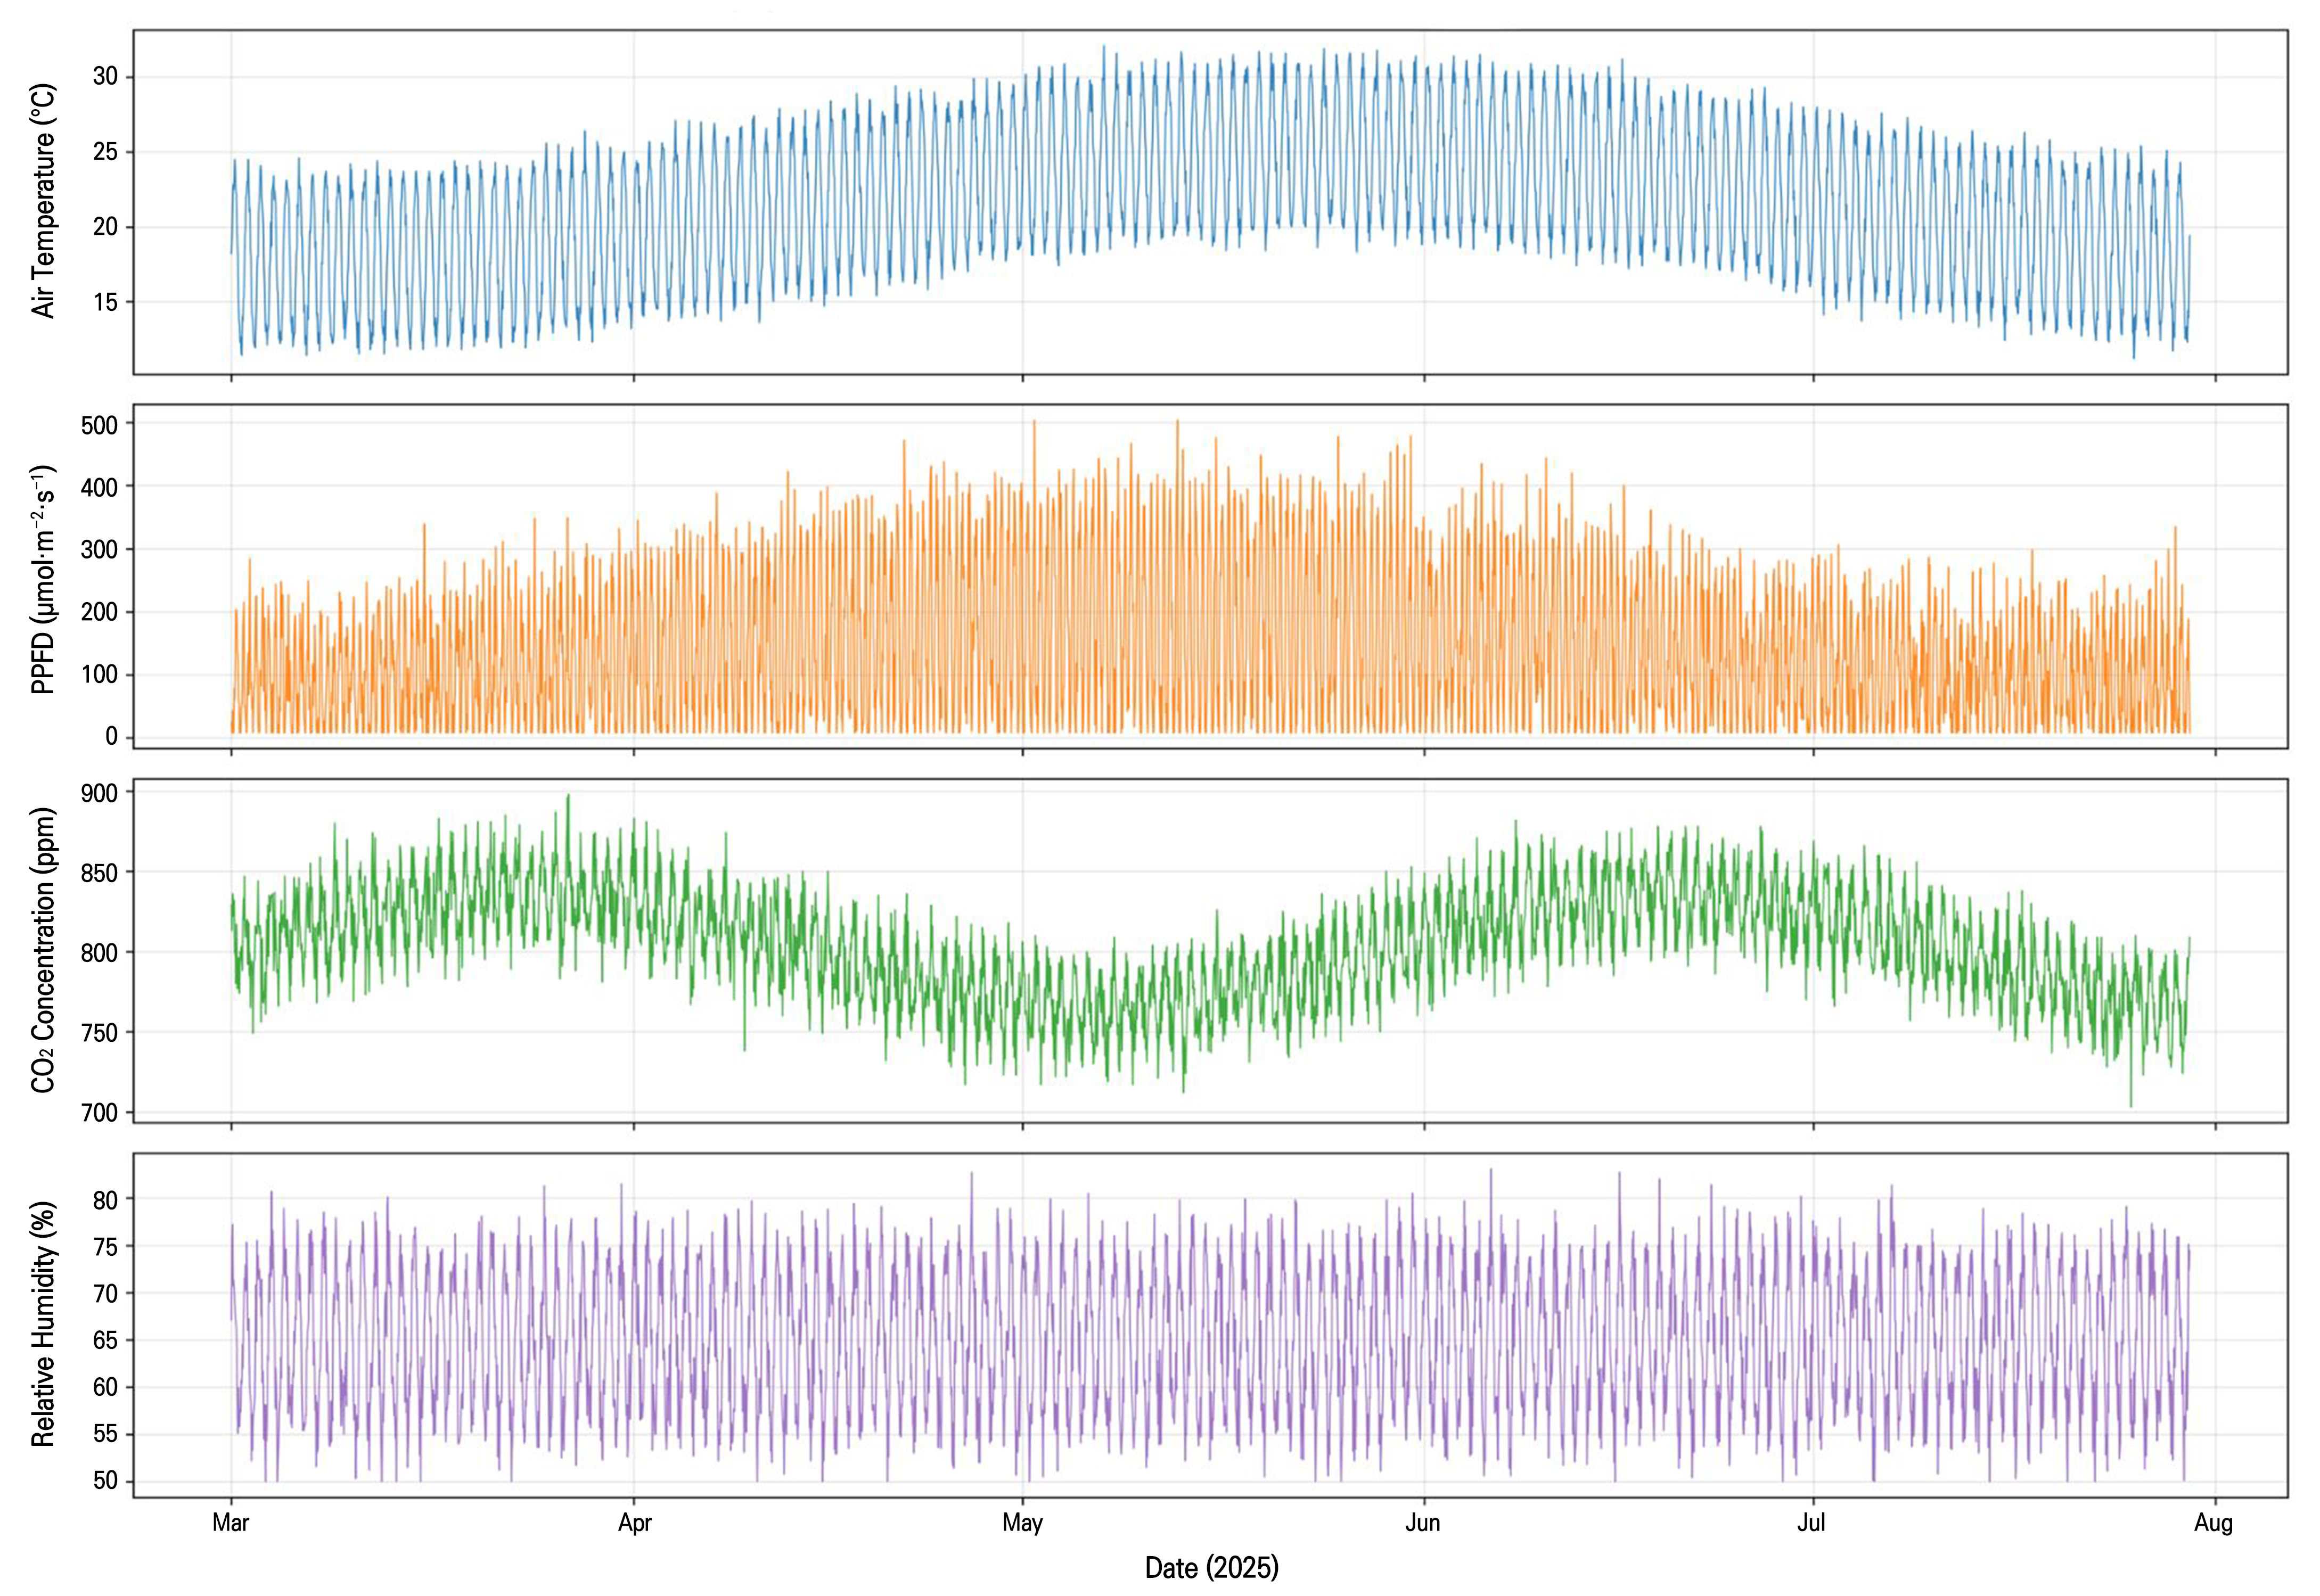
The experiment was conducted during the spring cropping cycle (March–July 2025) at the Agrocell Co., Ltd. Corporate-Affiliated Research Institute in Jeonju, Jeollabuk-do, Republic of Korea. All treatments were established in three independent Venlo-type glass greenhouses (3.3 m × 6.0 m each) with automated environmental control systems. Each greenhouse had 50 cherry tomato ‘Cupid’ plants planted, and analytical samples were collected from 20 randomly selected plants per treatment. The daytime temperature was maintained at 22 ± 2°C, the nighttime temperature at 16 ± 2°C, relative humidity at 65 ± 5%, and the CO2 concentration at 800 ± 50 ppm. Solar radiation was measured using a pyranometer (CMP3, Kipp & Zonen), and air temperatures were recorded using temperature sensors (BME280, Bosch Sensortec) at 1-minute intervals. Growing degree days were calculated using a base temperature of 10°C with a maximum threshold of 30°C. Detailed environmental data, in this caser the daily light integral (DLI), photosynthetic photon flux density (PPFD), CO2 concentration, and relative humidity during the cultivation period, were measured and are presented in Fig. 1, which shows the monthly trends of these parameters throughout the spring cultivation period.
The growing medium used in the hydroponic treatments was a coir substrate mixed at a 5:5 chip and dust ratio (Dust Coir 5:5), following formulations validated for tomato cultivation (Choi et al. 2017). Coir substrates have been widely adopted in soilless culture due to their high water holding capacity, excellent drainage, and absence of weeds and pathogens. Previous studies have demonstrated that coir substrates with a dust content of 100% (0% chips) provide optimal water retention and plant growth in FDR sensor-automated irrigation systems (Kim et al. 2023). The nutrient solution used in both hydroponic treatments was the Rural Development Administration (RDA) standard formulation for tomato cultivation. The RDA standard nutrient solution contains macronutrients at the following concentrations (meq·L‒1): NO3‒ 12, H2PO4‒ 1.5, SO42‒ 2, K+ 7, Ca2+ 3.75, and Mg2+ 1 (Son et al. 2022; Kim et al. 2023). This formulation is consistent with standard tomato nutrient solutions used in NFT and coir substrate systems (Jones 2008; Voogt 2015). The pH of the nutrient solution was adjusted to 6.0 using phosphoric acid or potassium hydroxide.
Three treatments were established, each conducted in an independent greenhouse.
Control (Soil Cultivation): Tomato plants were grown in soil within a Venlo-type greenhouse according to the Rural Development Administration standard cultivation method. The soil was a sandy loam with pH of 6.2, organic matter content of 2.8%, and available P2O5 level of 450 mg·kg‒1. Irrigation was applied manually based on a visual assessment of soil moisture. Fertilization followed the Rural Development Administration standard cultivation method, with a compound form of fertilizer (N‒P2O5‒K2O = 15‒15‒15) applied at 200 kg·ha‒1 at transplanting, with supplementary fertilization (NH4NO3 and KCl) also supplied at each growth stage.
Treatment 1 (Conventional Hydroponic Management): Plants were grown in a coir substrate hydroponic system using the RDA standard nutrient solution. Irrigation was controlled by an automated system based on solar radiation and temperature sensors, with irrigation events triggered when the cumulative solar radiation level exceeded 200 J·cm‒2 or when the temperature exceeded 28°C. The nutrient solution EC was maintained at 2.2 ± 0.3 dS·m‒1, and the pH was maintained at 6.0 ± 0.3.
Treatment 2 (Model-Driven Hydroponic Management): Plants were grown in a coir substrate hydroponic system with the same base nutrient solution used in Treatment 1. However, irrigation and the nutrient supply were managed based on the growth models developed in this study. The logistic growth models for plant height, the leaf area index, and fruit yield were used to predict crop growth and nutrient demand at each growth stage. Irrigation volume was adjusted based on predicted evapotranspiration calculated from the leaf area index model and environmental data. Nutrient supply was adjusted to maintain the optimal EC and pH for the predicted growth stage, guided by the ion balance model (Soh and Lee 2012) and the pH variance model (Soh et al. 2015).
Environmental data, specifically the temperature, relative humidity, CO2 concentration, and light intensity (PPFD and DLI), were recorded continuously throughout the cultivation period. The harvest period was from late May to mid-July of 2025. Irrigation and the nutrient solution were applied according to the specific schedules for each treatment. For all treatments, irrigation and the nutrient solution were applied throughout the entire cultivation period, from transplanting (early vegetative stage, approximately 3–4 true leaves) through flowering, fruit set, and fruit development, continuing until the final harvest. In Treatment 1, irrigation was triggered automatically based on sensor thresholds; in Treatment 2, irrigation and the nutrient supply were adjusted based on growth model predictions corresponding to the crop’s growth stage. For the Control, irrigation and fertigation were applied according to the Rural Development Administration standard cultivation method.
Growth characteristics (plant height, leaf number, leaf area index) were measured at 7-day intervals from transplanting to harvest. Plant height was measured using a measuring tape from the base to the growing point. The leaf area index was measured using a leaf area meter (LI-3100C, LI-COR Biosciences). For LAI measurements, all leaves from four representative plants per treatment were sampled, with the leaf area measured nondestructively using the LI-3100C device. The planting density was 2.5 plants·m‒2 (3.0 m × 0.8 m spacing), with 50 plants transplanted per treatment and 20 plants selected as analytical samples (n = 20). Fruit yield was recorded at each harvest, with the cumulative yield calculated at 7-day intervals. Fruits were harvested at the mature red stage (USDA standard, color index ≥ 6), characterized by full red coloration with no green tissue visible. At the end of the cultivation period, the total yield and marketable yield were assessed. Fruit quality parameters were evaluated as follows: total soluble solids (°Brix) were measured using a digital refractometer (PAL-1, Atago Co., Ltd.) with juice extracted from homogenized fruit samples, following the refractometric method (European Commission 1986). Titratable acidity (%) was determined by titrating 10 g of a homogenized fruit sample with 0.1 N NaOH to pH 8.00 using an automatic titrator (Metrohm, E 526), following the standard procedure (University of California, Davis 2005; Wageningen 1982). The results were expressed as percentage citric acid equivalent. For the TSS and TA analyses, fruits were selected based on a uniform size (approximately 15–20 g per fruit), the absence of visible defects, and uniform maturity (full red stage). Ten fruits per treatment were sampled from the 20 analytical plants. The nutrient solution EC, pH, and individual ion concentrations were measured daily. The drainage volume and fertilizer consumption were recorded for each treatment.
The experimental design was a completely randomized design (CRD) with three treatments, each established in an independent greenhouse compartment. Each treatment consisted of 50 plants (n = 50), with 20 plants randomly selected for data collection to ensure an adequate sample size for the statistical analysis. The treatment arrangement consisted of one greenhouse per treatment, with plants arranged in four rows per greenhouse.
Logistic growth models were developed for plant height, the leaf area index, and the fruit yield using the following equation: , where y is the dependent variable (plant height in cm, leaf area index, or fruit yield in g·plant‒1), K is the maximum or carrying capacity, b is the initial growth parameter, c is the growth rate coefficient, and x represents the growing degree days (GDD) after transplanting. Model parameters were estimated using the least squares method with the Python statsmodels library. Model performance was evaluated by calculating the root mean square error (RMSE) and coefficient of determination (R2).
All quantitative data were subjected to a one-way analysis of variance (ANOVA) using SAS 9.4 (SAS Institute Inc.) and Minitab 22 (Minitab LLC), followed by Duncan’s multiple range test (p < 0.05). A regression analysis was performed to calculate the coefficient of determination (R2) and root mean square error (RMSE) between predicted and measured values. The number of replicates for growth and yield measurements was n = 20.
Results and Discussion
Environmental conditions during the cultivation period
The environmental conditions during the spring cultivation period (March–July 2025) are presented in Fig. 1. The air temperature increased gradually from 24.0°C in March to 27.0°C in June, then decreased slightly to 26.0°C in July. PPFD showed a similar seasonal trend, increasing from 180 µmol·m‒2·s‒1 in March to 230 µmol·m‒2·s‒1 in June, followed by a gradual decline toward July and August. The CO2 concentration was maintained consistently at approximately 850 ppm throughout the cultivation period, while the relative humidity remained stable at around 78%. These conditions were within the optimal ranges for greenhouse tomato production and provided a suitable environment for evaluating the growth and yield responses of ‘Cupid’ cherry tomato under the three different management treatments.
Logistic growth model development
Logistic growth models were successfully developed for plant height, the leaf area index, and the fruit yield using GDD as the independent variable. The model parameters and performance metrics are presented in Table 1. For plant height, the carrying capacity (K) was estimated at 185.3 cm, with a growth rate coefficient (c) of 0.0082 and an initial growth parameter (b) of 12.84. The model achieved an R2 value of 0.94 and RMSE outcome of 6.8 cm, indicating excellent fit to the observed data. For the leaf area index, the carrying capacity was 3.85, with a growth rate coefficient of 0.0071 and initial parameter of 8.92 (R2 = 0.92, RMSE = 0.24). For fruit yield, the carrying capacity was 2,845 g·plant‒1, with a growth rate coefficient of 0.0065 and initial parameter of 10.23 (R2 = 0.91, RMSE = 142 g·plant‒1). These results are consistent with findings by Fang et al. (2022), who reported that logistic models using GDD as the independent variable performed better than those using days after transplanting for tomato growth predictions. The relatively high RMSE for fruit yield reflects the inherent variability in fruit set and development, which is influenced by multiple environmental factors beyond the temperature (Wu et al. 2026). Sousa et al. (2019) also demonstrated that the logistic model presents unbiased parameters and meets all statistical assumptions in the tomato growth analysis, supporting the selection of the logistic function for this study.
Table 1.
Logistic growth model parameters and performance metrics for ‘Cupid’ cherry tomato
| Variable | K | b | c | R2 | RMSE |
| Plant Height (cm) | 185.3 | 12.84 | 0.0082 | 0.94 | 6.8 |
| Leaf Area Index | 3.85 | 8.92 | 0.0071 | 0.92 | 0.24 |
| Fruit Yield (g·plant‒1) | 2,845 | 10.23 | 0.0065 | 0.91 | 142 |
The integration of crop growth models with machine learning approaches has been increasingly recognized as a powerful strategy for improving prediction accuracy results in horticultural systems. Wang et al. (2022) demonstrated that combining mechanistic crop growth models with machine learning algorithms significantly enhanced the yield prediction accuracy compared to either approach alone, achieving R2 values exceeding 0.85 across multiple cropping seasons. Similarly, Kootstra et al. (2021) reviewed applications of machine learning in horticulture and emphasized that hybrid approaches, which integrate process-based models with data-driven techniques, offer superior performance for complex systems where both a mechanistic understanding and empirical data are available. In the present study, the logistic growth models, which are parsimonious process-based models, achieved R2 values in the range of 0.90–0.94. These results suggest that the simple logistic framework, when parameterized with GDD as the independent variable, effectively captures the sigmoidal growth patterns of cherry tomato without the need for the extensive computational resources or large training datasets required by purely machine learning approaches. This finding aligns with the conclusions of Kootstra et al. (2021), who noted that simpler models with biologically meaningful parameters often provide more interpretable and practically applicable results for commercial farm settings.
Treatment effects on the growth and yield
The growth and yield results demonstrated that Treatment 2 (model-driven hydroponic management) resulted in the best performance across all measured parameters, as shown in Table 2. Plant height at harvest was 178.2 cm in Treatment 2, representing increases of 8.9% over the Control (163.6 cm) and 5.3% over Treatment 1 (169.2 cm). The leaf area index was highest in Treatment 2 at 3.72, compared to 2.85 in the Control and 3.21 in Treatment 1. Total fruit yield was significantly higher in Treatment 2 (2,784 g·plant‒1) compared to the Control (1,852 g·plant‒1) and Treatment 1 (2,315 g·plant‒1), representing increases of 50.3% and 20.3%, respectively. Marketable yield was also highest in Treatment 2 at 92.8%, compared to 78.4% in the Control and 85.2% in Treatment 1.
Table 2.
Comparison of growth and yield parameters among the treatments
The superior growth observed in Treatment 2, while expected given the model-driven approach, can be mechanistically attributed to several factors that distinguish it from the conventional hydroponic management in Treatment 1. First, for the model-driven system the nutrient supply was proactively adjusted according to the predicted sigmoidal growth curve, ensuring that nutrient availability matched the crop’s stage-specific demand. During the rapid vegetative growth phase (approximately 400–800 GDD), Treatment 2 provided elevated nutrient concentrations, resulting in higher leaf area expansion rates and assimilate production compared to Treatment 1, which relied on reactive sensor-based adjustments. Second, the model-driven approach optimized the timing of nutrient delivery, reducing the incidence of nutrient imbalances that can occur when nutrient supply lags behind crop demand, a common limitation of conventional threshold-based systems (Razzak et al. 2024). This aligns with previous findings that continuous adaptation of the nutrient supply to crop demand enhances both the nutrient uptake efficiency and biomass accumulation (Shan et al. 2025). Third, the improved nutrient solution stability in Treatment 2 (lower CV for EC and pH, as shown in Table 3) likely reduced physiological stress on the root system, promoting more efficient ion uptake and assimilate partitioning to fruits.
Table 3.
Nutrient solution management indices and resource efficiency rates
These mechanistic interpretations are consistent with growth-process-oriented modeling approaches. Kim and Lee (2025) demonstrated that in cucumber, the crop growth rate is strongly influenced by the balance between the source (photosynthetic capacity) and sink (organ demand) dynamics and that optimization of the nutrient supply can significantly enhance this balance. In the present study, the model-driven nutrient management scheme in Treatment 2 likely improved source-sink relationships by ensuring that nutrient availability did not limit either the photosynthetic capacity (source) or fruit development (sink), thereby promoting more efficient assimilate partitioning to fruits. This resulted in a higher marketable yield and improved fruit quality parameters.
These findings are strongly supported by recent advances in hydroponic systems and nutrient management. Savvas and Ntatsi (2020) comprehensively reviewed hydroponic systems and emphasized that precise nutrient management is the key determinant of crop performance in soilless cultivation. They highlighted how reactive nutrient management approaches, which adjust the nutrient supply based on periodic measurements, often fail to meet the dynamic nutrient requirements of crops during different growth stages. In contrast, proactive management strategies that account for the crop growth stage and environmental conditions consistently achieve higher nutrient use efficiency and yield outcomes. The present study directly validates this principle, as the model-driven approach (Treatment 2) demonstrated superior nutrient use efficiency rates and yields compared to the conventional sensor-based approach (Treatment 1). Similarly, Gruda (2020) reviewed advances in soilless cultivation technology and noted that the integration of real-time monitoring with predictive models represents the next frontier in hydroponic management. The author emphasized that model-driven nutrient management can reduce nutrient losses to the environment while maintaining or improving crop productivity. The 32.5% reduction in fertilizer consumption and 41.8% reduction in the drainage volume achieved in Treatment 2 are consistent with the resource efficiency targets identified by Gruda (2020).
Fruit quality and nutrient solution stability
The superior fruit quality in Treatment 2, with higher total soluble solids (9.1°Brix) and titratable acidity (0.56%) levels, is consistent with the findings of Abd El-baki et al. (2024), who reported that optimized irrigation and nutrient management can enhance fruit quality parameters. The balanced nutrient supply in Treatment 2 likely promoted optimal sugar accumulation and organic acid synthesis without inducing excessive vegetative growth. These results are also supported by experimental evidence from similar studies (Dorais et al. 2001; Marcelis et al. 1998), which demonstrated that controlled nutrient management positively influences tomato fruit quality by regulating carbohydrate partitioning.
The relationship between nutrient management and fruit quality has been investigated extensively by Khapte et al. (2022), who demonstrated that a balanced nutrient supply, particularly with respect to potassium and nitrogen ratios, significantly influences tomato fruit quality parameters, including total soluble solids, titratable acidity, and the antioxidant content. Their study showed that optimized nutrient management can increase TSS by 15–25% compared to conventional fertilization practices. In the present study, Treatment 2 achieved a TSS outcome of 9.1°Brix, which represents a 10.9% increase over Treatment 1 (8.6°Brix) and a 5.8% increase over the Control (8.2°Brix). These improvements are consistent with the findings of Khapte et al. (2022), supporting the conclusion that model-driven nutrient management enhances fruit quality through improved nutrient balance and availability.
Furthermore, Rouphael et al. (2021) reviewed the role of nutrient management in enhancing nutrient use efficiency in vegetable crops and emphasized that an optimal nutrient supply can improve both the yield and quality through enhanced photosynthetic efficiency and assimilate partitioning. The authors noted that balanced nutrition, particularly with respect to macronutrients such as N, P, and K, influences the activity of key enzymes involved in sugar metabolism and organic acid synthesis. In the present study, the improved nutrient solution stability and balanced nutrient supply in Treatment 2 likely contributed to enhanced sugar accumulation and organic acid synthesis, resulting in superior fruit quality parameters.
A nutrient solution dynamics analysis revealed that Treatment 2 maintained significantly more stable EC and pH levels compared to Treatment 1, as presented in Table 3. The coefficient of variation for EC was 6.8% in Treatment 2, compared to 14.2% in Treatment 1, while the coefficient of variation for pH was 4.2% in Treatment 2, compared to 8.6% in Treatment 1. This improved stability is attributed to the model-driven nutrient supply, which adjusted nutrient addition amounts based on predicted crop demand rather than reacting to sensor readings after fluctuations had occurred (Razzak et al. 2024). The ion balance model (Soh and Lee 2012) provided the theoretical framework for maintaining optimal ion concentrations, while the pH variance model (Soh et al. 2015) enabled precise pH control based on the phosphate ion forms.
Resource efficiency and environmental sustainability
Fertilizer consumption was reduced by 32.5% in Treatment 2 compared to Treatment 1, while the drainage volume was reduced by 41.8%. These resource savings were achieved without compromising the yield, as Treatment 2 maintained 98.7% of the maximum theoretical yield. The improved nutrient use efficiency in Treatment 2 is consistent with the findings of Wu et al. (2026), who demonstrated that model-driven optimization of water and fertilizer can achieve synergistic improvements in yield and water productivity while reducing fertilizer usage by up to 9–11%. The integration of growth modeling with nutrient management in this study achieved even greater resource savings, likely due to the continuous adaptation of the nutrient supply to the predicted growth curve, guided by the ion balance model (Soh and Lee 2012). Research by Kim et al. (2023) on FDR sensor-automated irrigation in coir substrates demonstrated that irrigation scheduling based on substrate water content thresholds can achieve approximately 61% fertilizer cost savings and substantial reductions in the drainage volume while maintaining the yield, findings consistent with the resource efficiency achieved in this study.
The integration of IoT-based precision irrigation systems with crop growth models represents a significant advancement toward sustainable greenhouse production. Zhang et al. (2023) developed an IoT-based precision irrigation system for greenhouse tomato production that integrated soil moisture sensors, environmental sensors, and a decision support system. Their system achieved water savings of 28–35% while maintaining or increasing tomato yields. The present study extends this concept by integrating environmental sensor data with logistic growth models to drive real-time nutrient management decisions. The 41.8% reduction in drainage volume achieved in Treatment 2 is comparable to or exceeds the water savings reported by Zhang et al. (2023), suggesting that model-driven nutrient management can achieve even greater resource efficiency than sensor-based irrigation alone.
The broader implications of this research for sustainable agriculture are supported by the findings of Shamshiri et al. (2020), who reviewed the role of digital agriculture and smart farming in sustainable crop production. The authors emphasized that the integration of crop models, sensor networks, and decision support systems can significantly reduce the environmental footprint of agricultural production while maintaining or increasing productivity. The present study contributes to this vision by demonstrating that a relatively simple logistic growth model, when integrated with environmental sensor data, can drive model-driven nutrient management that achieves substantial reductions in fertilizer consumption and drainage volumes without compromising yields. This approach aligns with the principles of precision agriculture and represents a practical pathway toward more sustainable greenhouse tomato production.
Model validation and prediction accuracy
The regression analysis between predicted and measured values for plant height, the leaf area index, and fruit yield demonstrated high agreement, as shown in Table 4. The calibration equations for plant height, the leaf area index, and fruit yield were Ymeas = 0.97 × Ypred + 4.2 (R2 = 0.93, RMSE = 7.1 cm), Ymeas = 0.98 × Ypred + 0.08 (R2 = 0.91, RMSE = 0.26), and Ymeas = 0.99 × Ypred − 12.4 (R2 = 0.90, RMSE = 148 g·plant‒1), respectively. The slopes close to 1 and intercepts near zero confirm that the model predictions tracked actual values with minimal bias. The residual analysis confirmed the statistical validity of the models, with mean residuals near zero (p > 0.05) and residuals meeting the assumptions of normality (Shapiro-Wilk test, p > 0.05) and homoscedasticity (Breusch-Pagan test, p > 0.05). The corresponding calibration plots are presented in Figs. 2, 3, 4. Fig. 2 shows the plant height calibration with R2 = 0.93 and RMSE = 7.1 cm. Fig. 3 presents the leaf area index calibration with R2 = 0.91 and RMSE = 0.26. Fig. 4 illustrates the fruit yield calibration with R2 = 0.90 and RMSE = 148 g·plant‒1.
Table 4.
Regression analysis between predicted and measured values
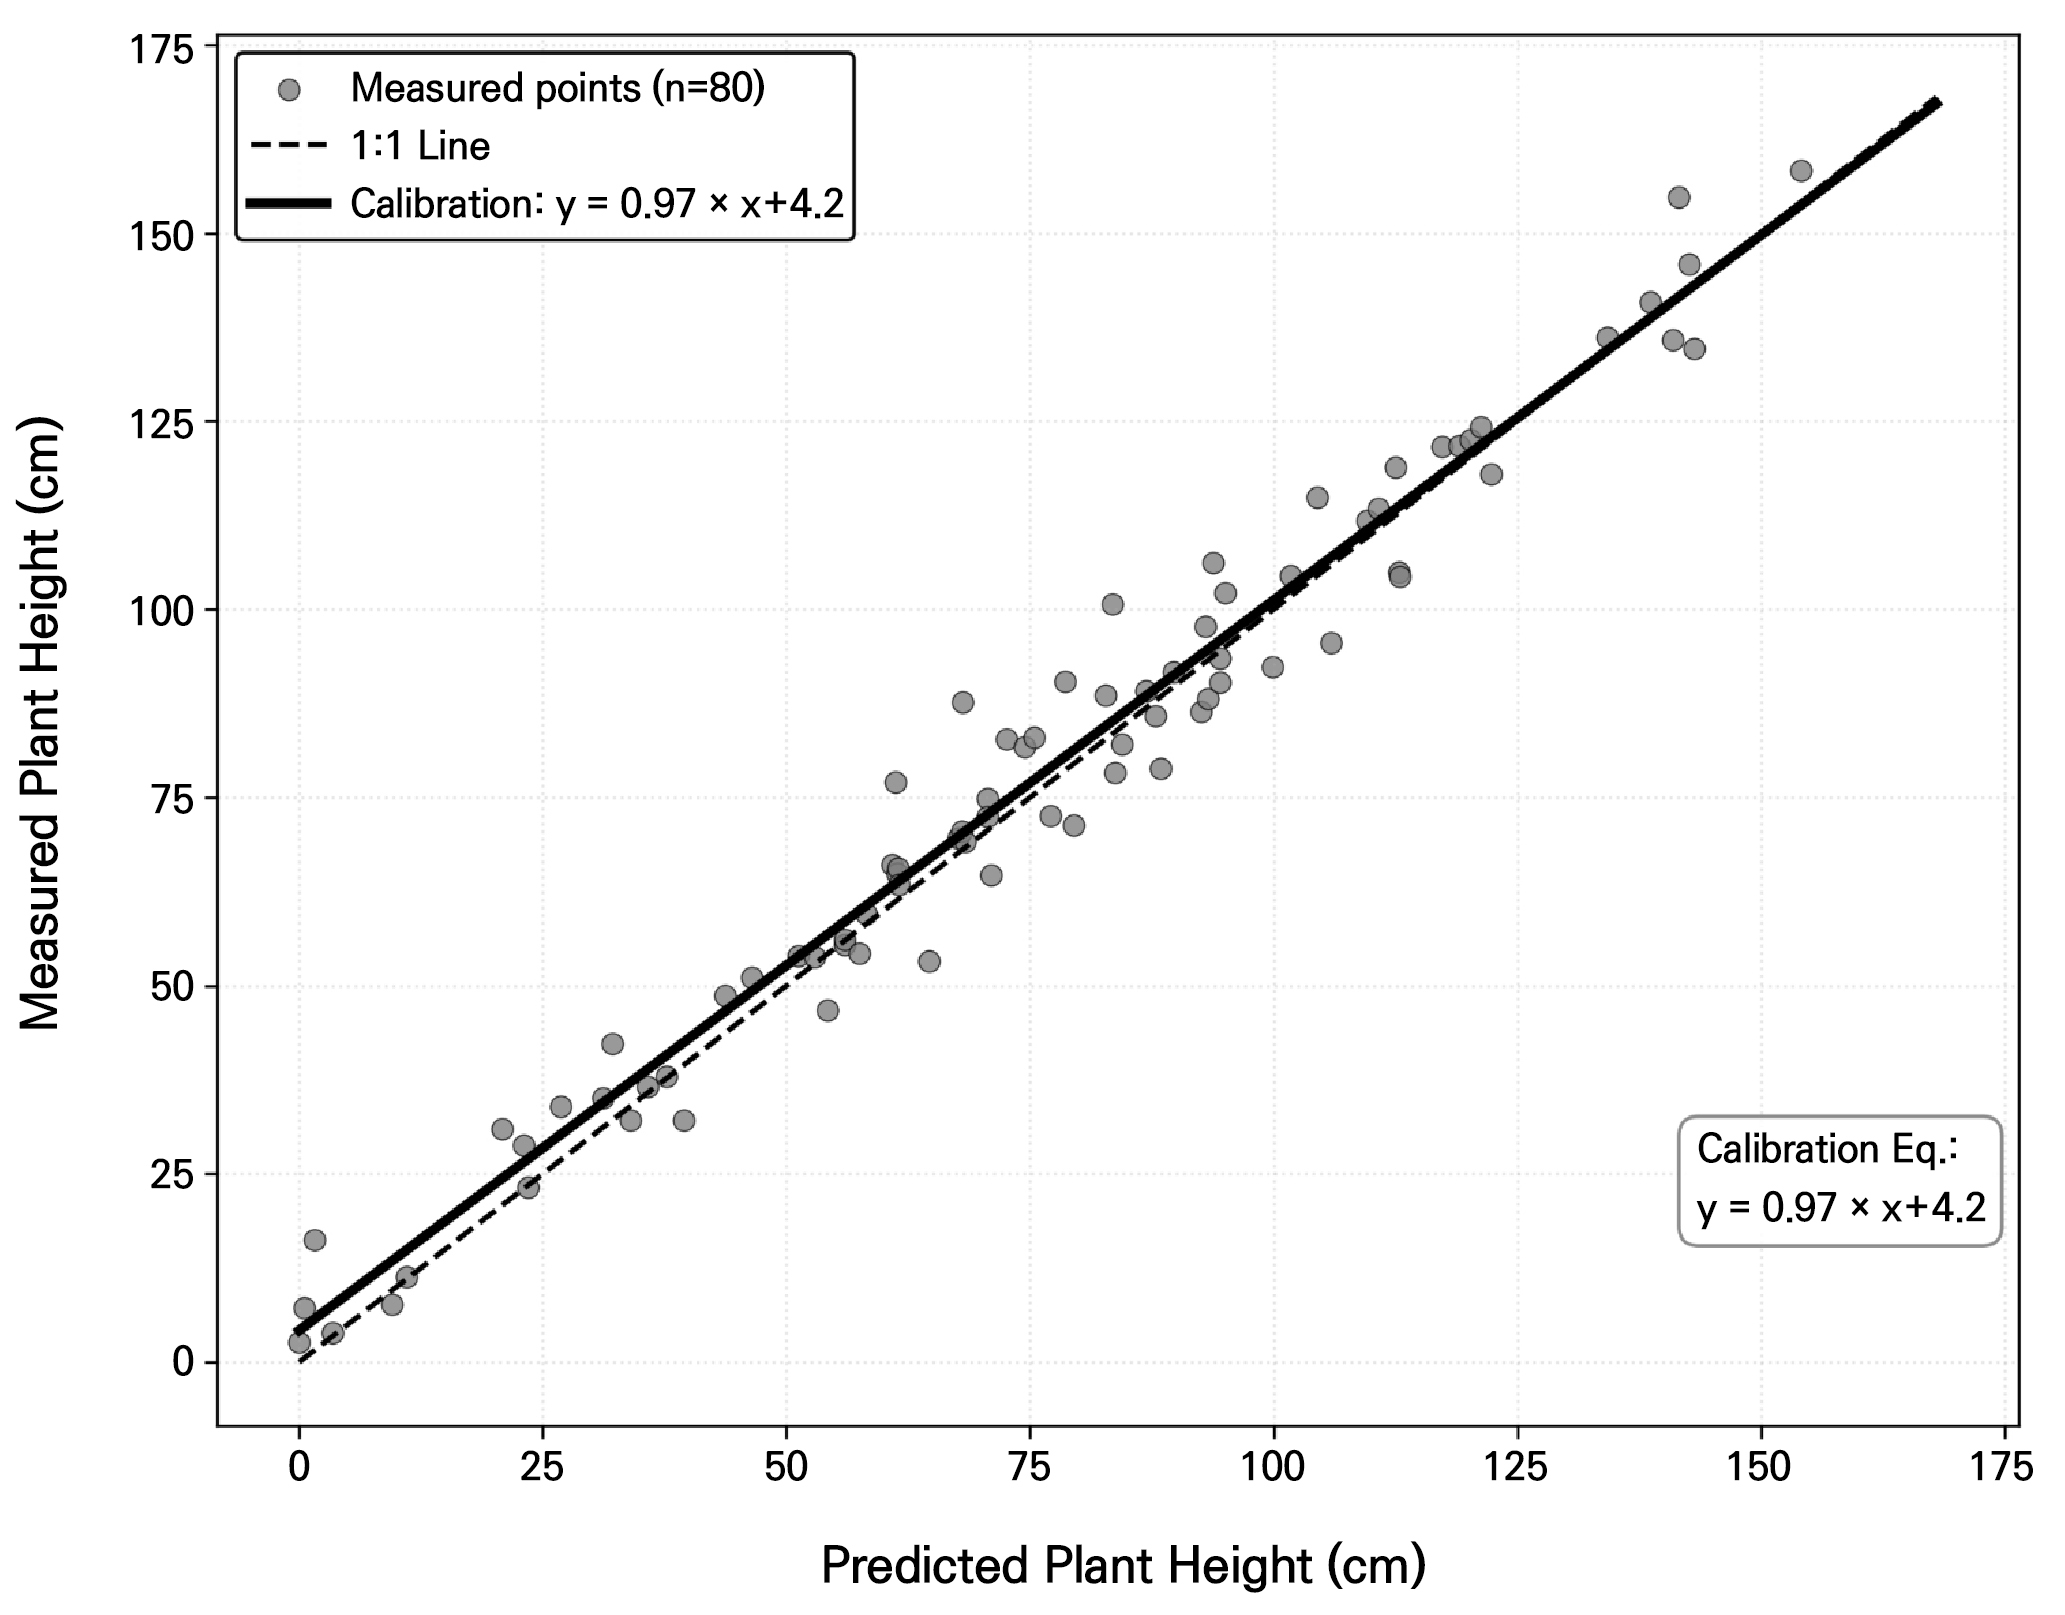
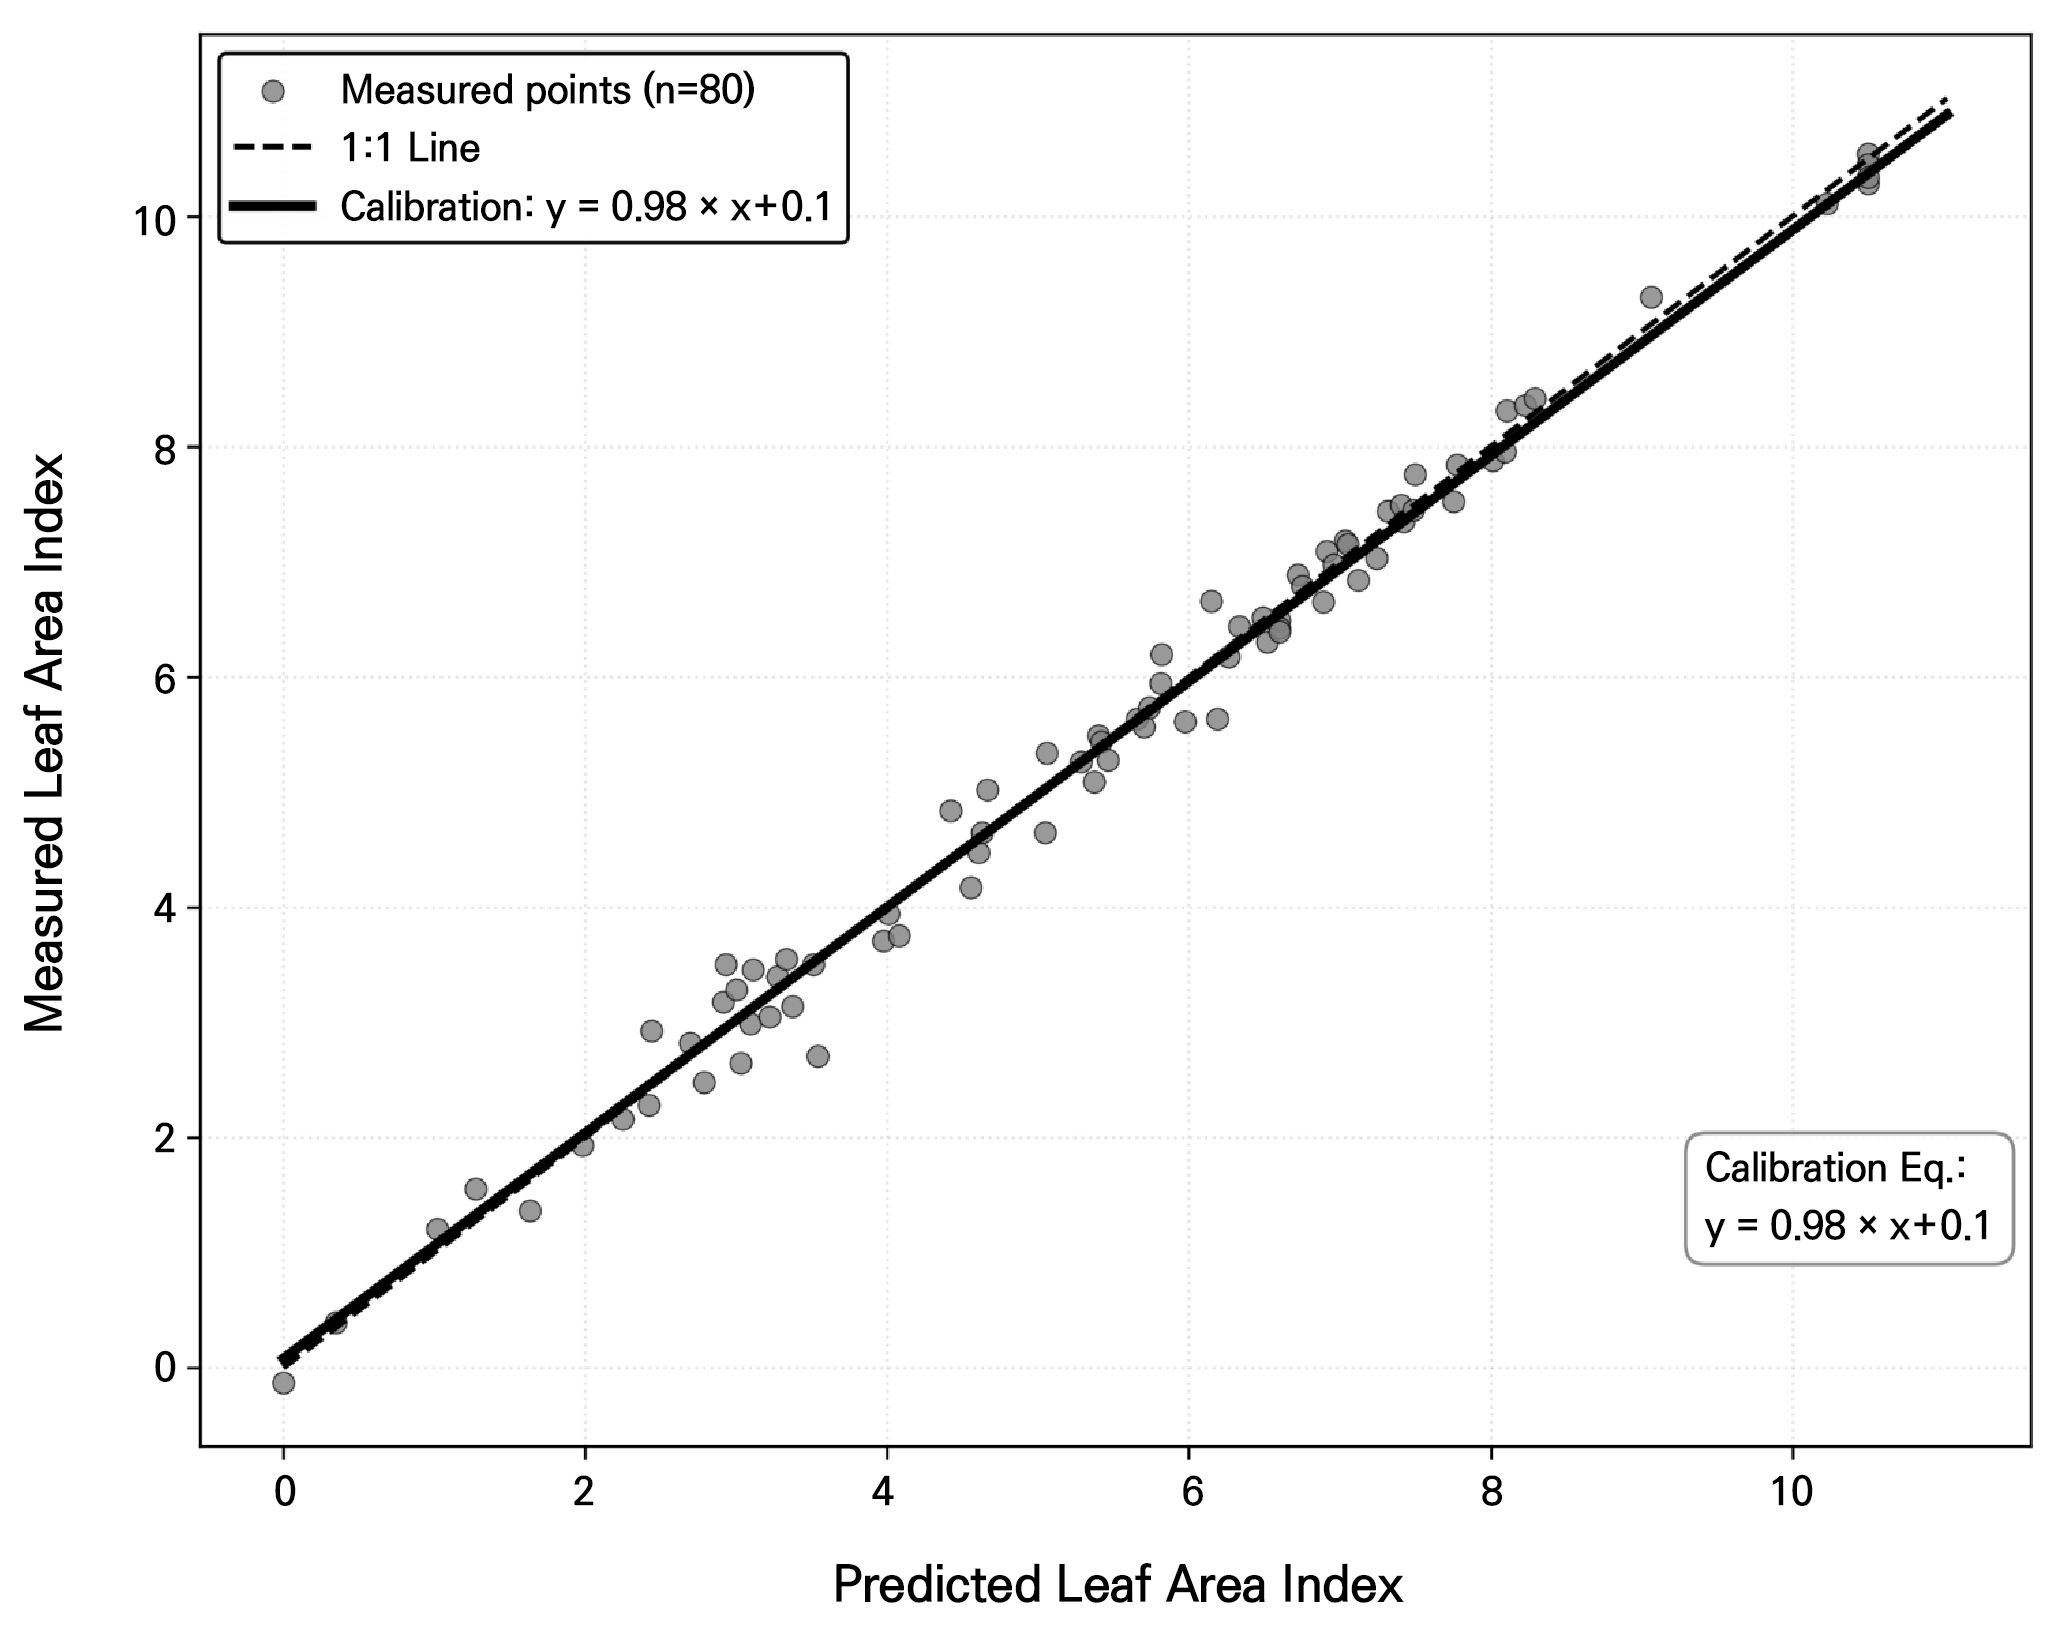
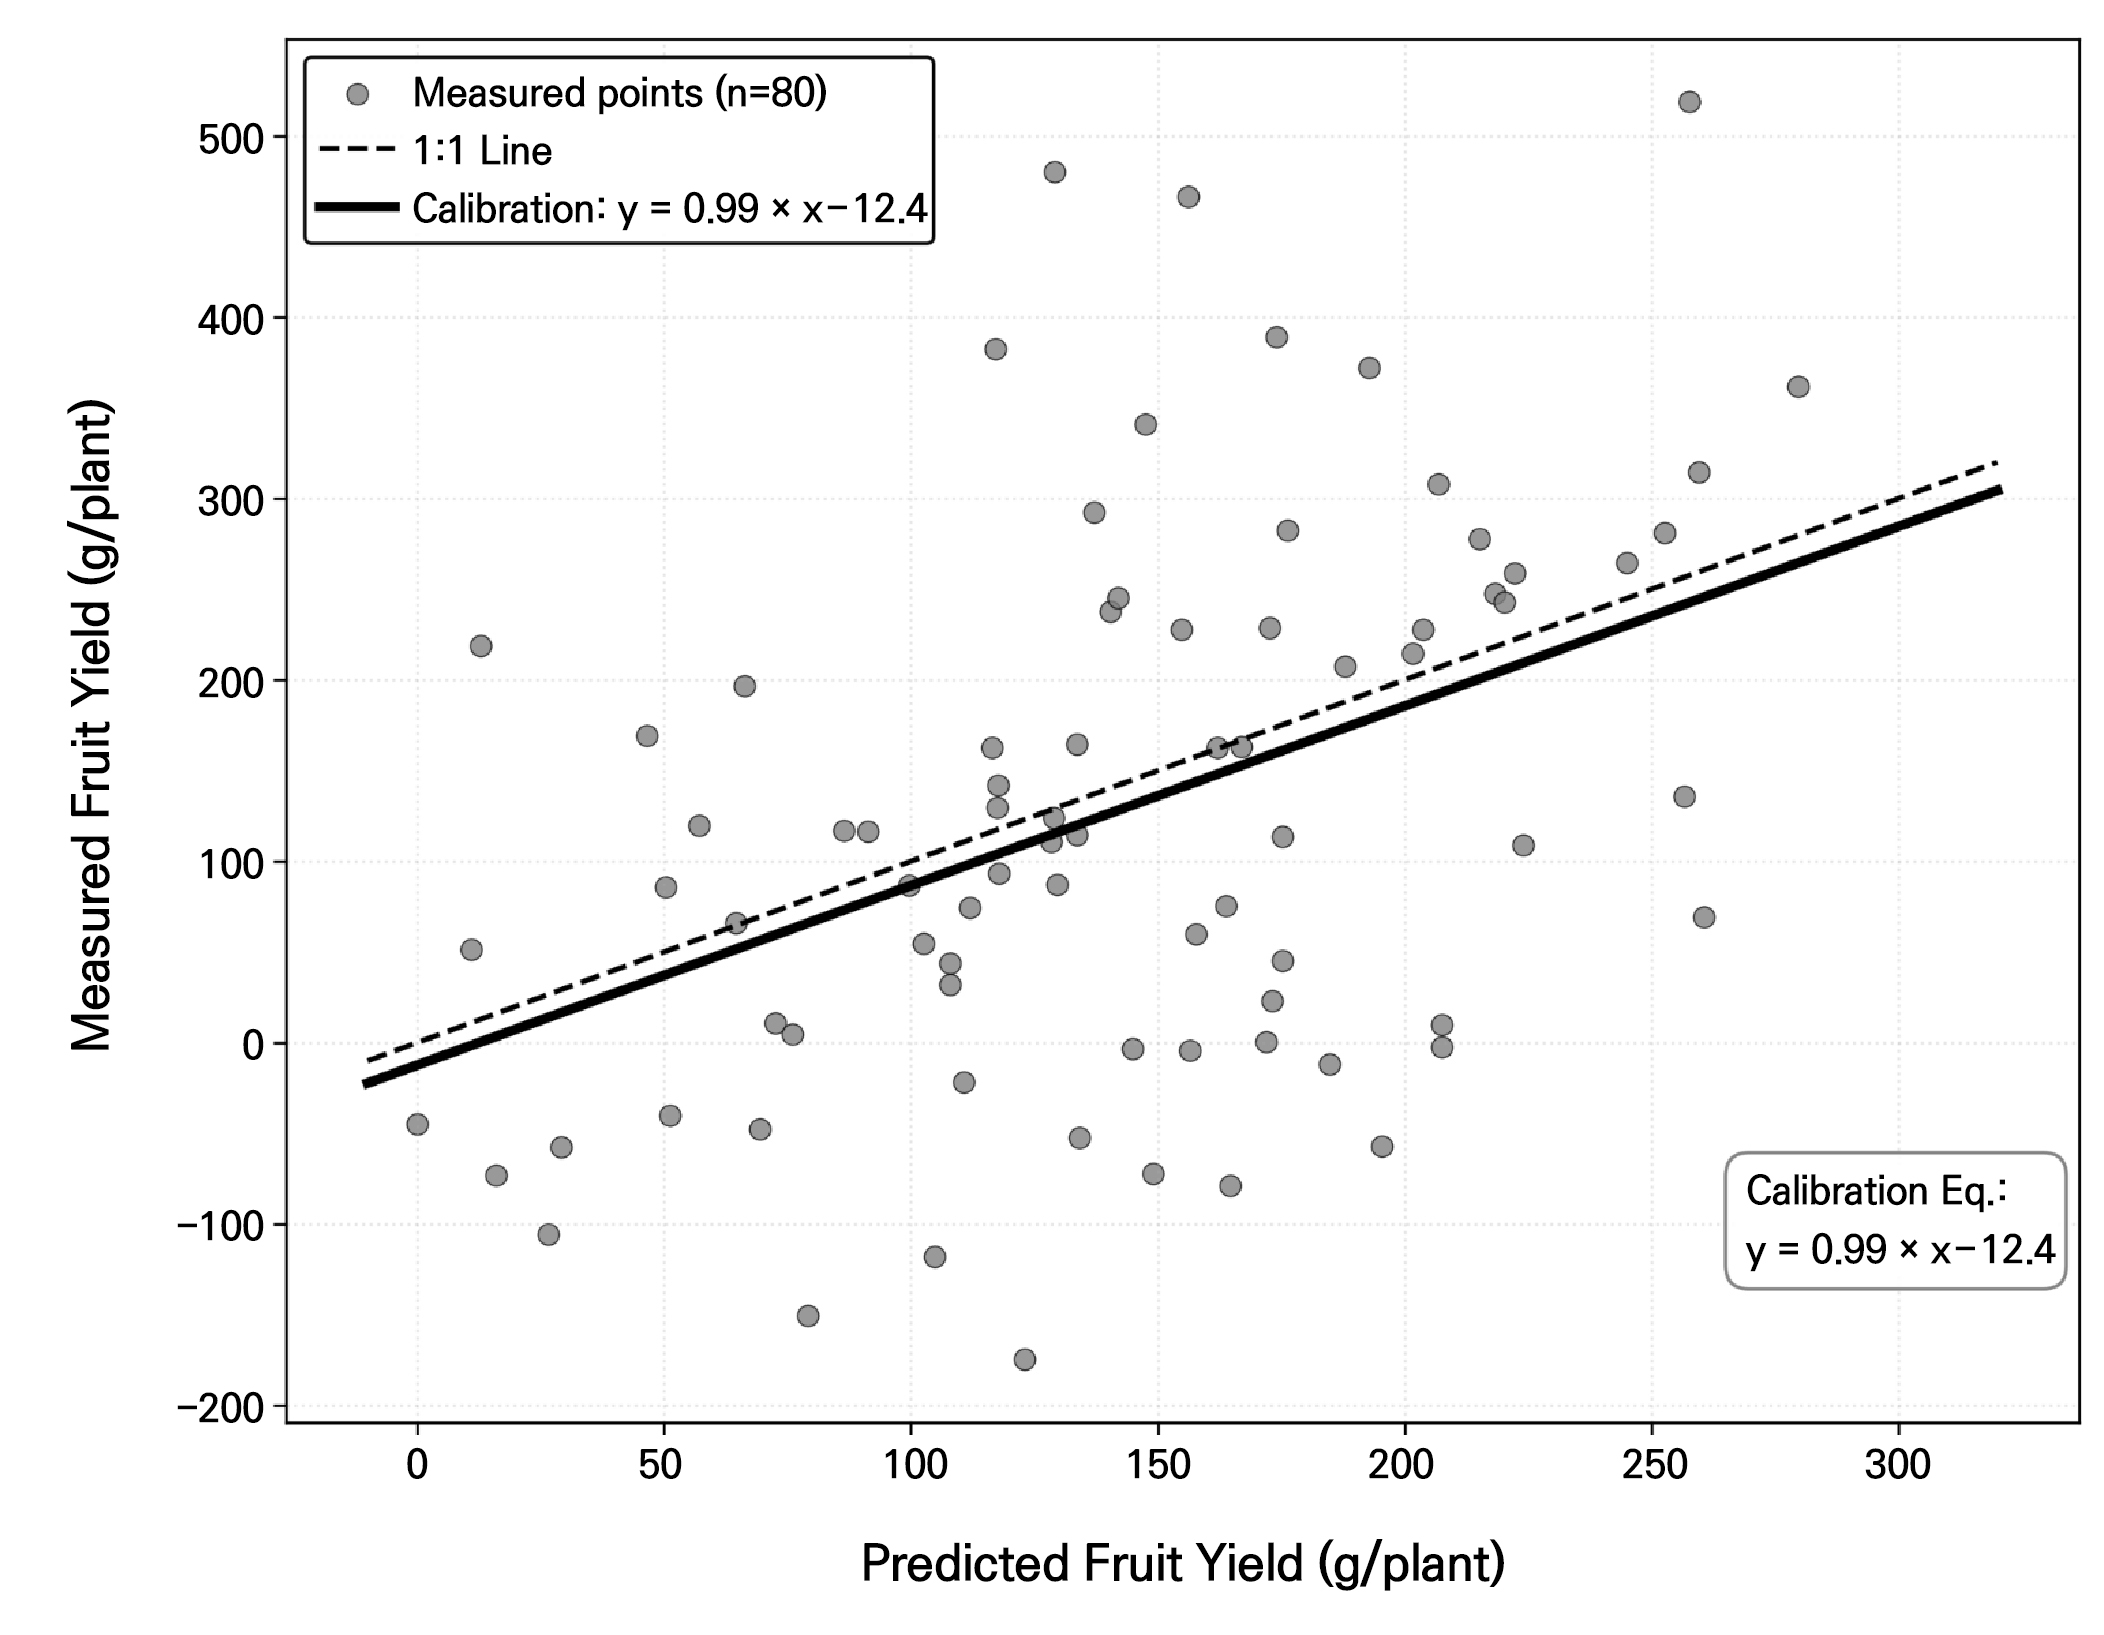
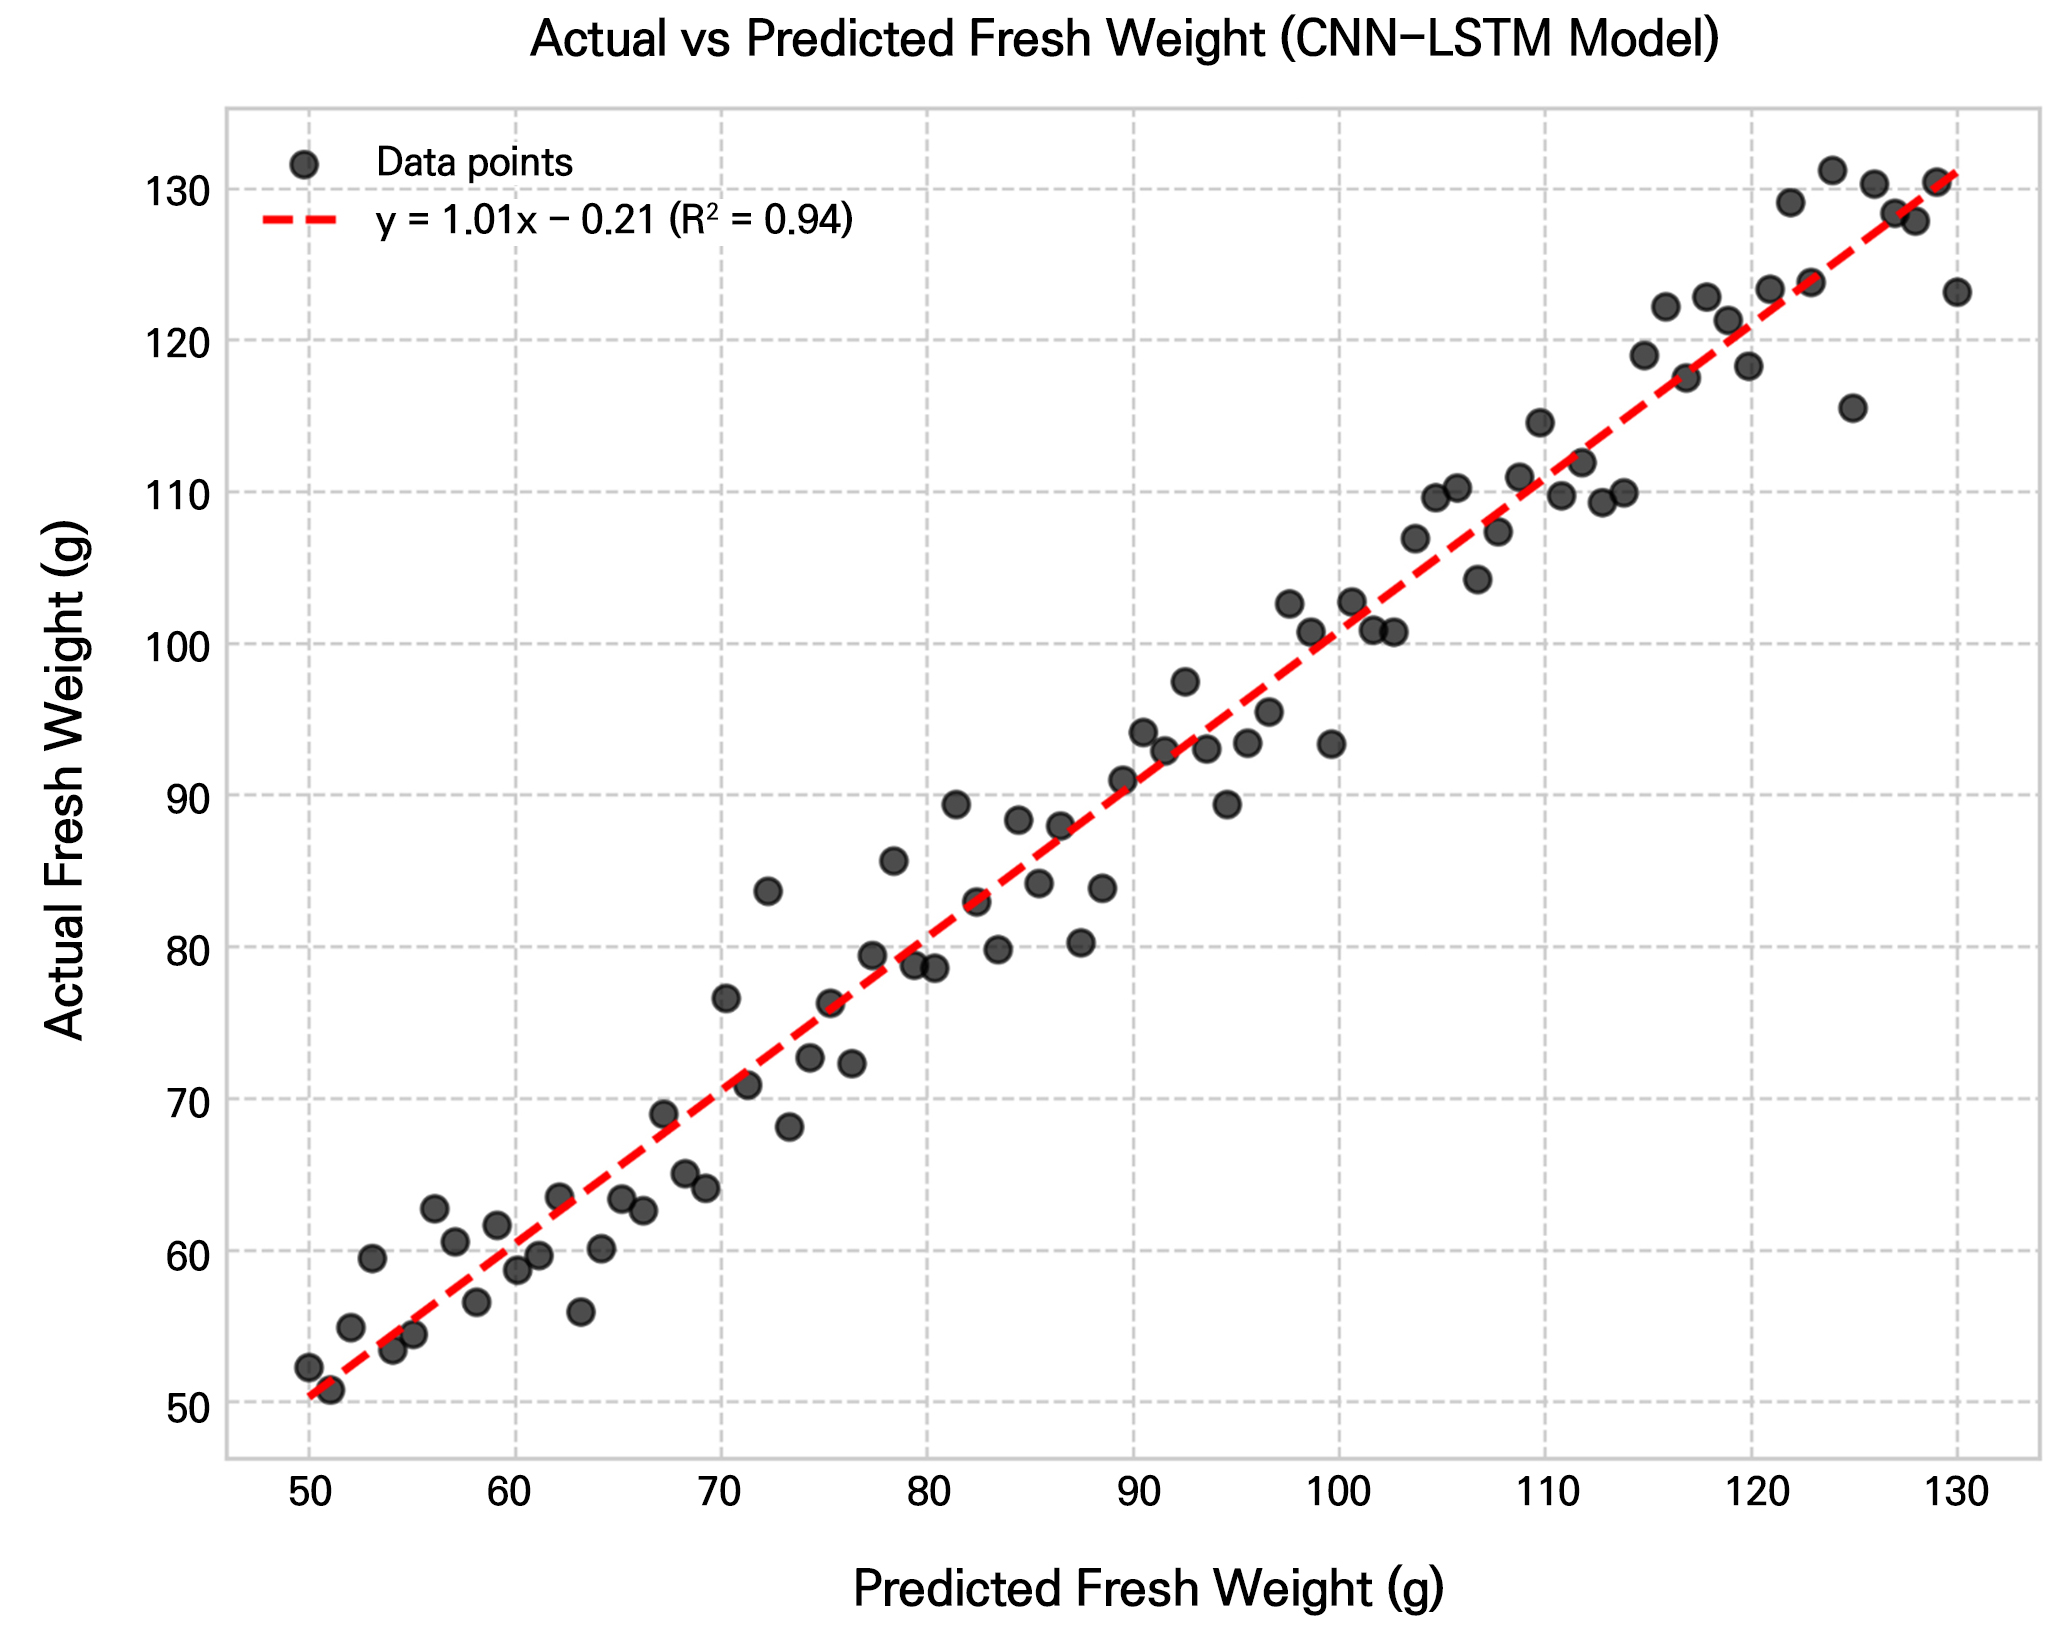
Fig. 5 presents the regression analysis between predicted fresh weight (Wpred) and measured fresh weight (Wmeas) for the CNN-LSTM growth prediction model. The analysis demonstrates a strong linear relationship between the predicted and measured values, with data points closely distributed along the 1:1 reference line. This high agreement further validates the robustness of the integrated modeling approach for biomass prediction in cherry tomato cultivation.
The R2 values of 0.90–0.94 achieved in this study are comparable to the R2 values of 0.83–0.96 reported by Abd El-baki et al. (2024) for ANN-based yield predictions and exceed the R2 values of 0.57–0.88 reported for the AquaCrop model by Wu et al. (2026). The practical advantages of the logistic growth model approach are its simplicity and interpretability, requiring only the estimation of three parameters for each variable. This makes it more accessible for commercial farm implementation compared to complex mechanistic or machine learning models that require extensive calibration data and computational resources. Sousa et al. (2019) also validated the logistic model as an effective alternative to traditional ANOVA for analyzing tomato trials, confirming its utility in crop research. The integration of growth modeling with environmental sensor data for model-driven nutrient management represents a significant advancement over conventional approaches. While Treatment 1 relied on reactive control based on sensor thresholds, Treatment 2 employed proactive control based on predicted crop demand levels, enabling more precise nutrient application and relatively less waste. This approach is consistent with the findings of Shan et al. (2025), who demonstrated that the model-based optimization of irrigation and nitrogen application amounts can achieve high yields while improving water and nitrogen use efficiency. The ion balance model (Soh and Lee 2012) and pH variance model (Soh et al. 2015) provided essential theoretical foundations for maintaining an optimal nutrient solution composition throughout the cultivation period.
The comparative analysis of the logistic growth model approach with machine learning methods warrants further discussion. Kootstra et al. (2021) reviewed machine learning applications in horticulture and noted that while machine learning methods often achieve high prediction accuracy, their “black box” nature limits interpretability and practical adoption by growers. In contrast, the logistic growth model used in this study provides biologically meaningful parameters (carrying capacity K, growth rate c, and initial growth parameter b) that can be directly interpreted in terms of crop physiology. This interpretability is a significant advantage for commercial adoption, as growers can understand the biological basis of the predictions and adjust management practices accordingly. Wang et al. (2022) similarly emphasized that integrating crop growth models with machine learning, as opposed to relying on either approach alone, can achieve both high accuracy and interpretability. The high R2 values achieved with the simple logistic model suggest that complex machine learning algorithms may not be necessary for this specific application, which is consistent with the principle of parsimony in model selection.
Conclusion
Previous studies have well established that hydroponic systems generally provide superior control over nutrient and water availability compared to soil cultivation, resulting in higher yields and better resource efficiency (Jones 2008; Voogt 2015; Son et al. 2022). However, the novelty and unique contribution of the present study lie in the systematic integration of logistic growth modeling with model-driven nutrient management specifically for the ‘Cupid’ cherry tomato cultivar under Korean protected cultivation conditions. While earlier research focused either on growth modeling (Sousa et al. 2019; Fang et al. 2022) or on automated hydroponic management (Kim et al. 2023; Razzak et al. 2024), this study bridges the gap by demonstrating how GDD-based logistic models can be operationalized to inform real-time nutrient management decisions, achieving resource savings beyond those of conventional automated systems. Furthermore, the study provides empirical validation of the ion balance model (Soh and Lee 2012) and pH variance model (Soh et al. 2015) in a commercial production context, supporting their practical application for precision fertigation. The high predictive accuracy (R2 > 0.90) and the significant reduction in fertilizer consumption levels (32.5%) and drainage volumes (41.8%) without compromising the yield represent a substantial advancement toward sustainable greenhouse tomato production in Korea.
The integration of crop growth models with IoT-based environmental monitoring and model-driven nutrient management, as demonstrated in this study, aligns with the broader trends in digital agriculture and smart farming identified by Shamshiri et al. (2020). The approach is consistent with the principles of precision agriculture, where resource inputs are optimized based on crop demand rather than applied uniformly. The practical implications of this research are significant for commercial greenhouse tomato production, as the model-driven approach can be implemented with relatively modest computational requirements and provides interpretable, biologically meaningful predictions. This makes it more accessible for commercial farm adoption compared to more complex machine learning or mechanistic modeling approaches. Future research should focus on extending the logistic growth models to include other environmental factors such as the CO2 concentration and light intensity, as well as validating the approach across multiple growing seasons and locations to confirm its robustness under diverse environmental conditions. Additionally, incorporating growth-process-oriented modeling approaches, such as those developed for cucumber (Kim and Lee 2025), could provide complementary insights into the physiological mechanisms underlying the observed growth responses and further enhance the predictive capabilities of the models.
This study successfully developed logistic growth models for plant height, the leaf area index, and fruit yields of ‘Cupid’ cherry tomato using growing degree days as the independent variable, validating these models through empirical cultivation comparing soil cultivation, conventional hydroponic management, and model-driven hydroponic management. The model-driven approach achieved superior growth parameters, fruit yields, and fruit quality outcomes compared to both soil cultivation and conventional hydroponic management. Specifically, Treatment 2 increased the total yield by 50.3% and 20.3% compared to the Control and Treatment 1, respectively, while reducing fertilizer consumption by 32.5% and the drainage volume by 41.8% compared to conventional hydroponic management. A regression analysis between predicted and measured values yielded high coefficients of determination (R2 > 0.90), confirming the model’s reliability for practical applications. The ion balance model (Soh and Lee 2012) and pH variance model (Soh et al. 2015) provided essential theoretical foundations for maintaining an optimal nutrient solution composition. These findings demonstrate that integrating growth modeling with environmental sensor data enables precise and resource-efficient nutrient management for cherry tomato production. The developed models and model-driven management approach provide a practical foundation for automated nutrient management systems in protected horticulture, contributing to sustainable and economically viable tomato production.
