

Introduction
Materials and Methods
Plant Materials and Cultivation
Determination of Quality Attributes
Analysis of Carotenoids
Analysis of Vitamin C
Measurement of Total Phenolic Content
Analysis of Flavonoids
Measurement of Antioxidant Activities
Free Radical Scavenging Activity using DPPH Assay
Determination of 2,2’-azino-bis(3-ethylbenzothiazoline-6-sulfonic acid) (ABTS) Assay
Determination of the Ferric Reducing Antioxidant Power (FRAP) Assay
Chemicals and Reagents
Statistical Analyses
Results and Discussion
Quality Characteristics and Color Attributes
Carotenoid Contents
Vitamin C Content
Total Phenol Content
Flavonoid Content
Antioxidant Activity and Reducing Power of Tomato Extracts
Correlation between Antioxidant Activities and Antioxidants
Introduction
Tomato, a member of the Solanaceae family, is an important vegetable crop. Produced in 171 Korean Journal of Horticultural Science & Technology countries, with annual production levels of 173 million tons of fresh fruit, tomatoes are grown on 4,725,417 ha of farmland (FAO, 2013). In South Korea, tomatoes are one of the most important horticultural crops in terms of both cultivation area (6,054 ha) and annual production (388,524 tons) and annual per capita consumption averages 8.6 kg. Worldwide, the fruit is consumed fresh or processed into canned tomato, sauce, juice, ketchup, stews, and soups (Aguilo-Aguayo et al., 2010). Many epidemiological studies have associated tomato and its related products with a reduced risk of several chronic degenerative diseases, cardiovascular diseases, and age-related macular degeneration (Rao and Rao, 2007). In addition, tomato is known to possess antioxidant activity. These tomato health benefits are due to the presence of several bioactive compounds, such as carotenoids, vitamins (C and E), polyphenols, flavonoids, sugars, etc. (Vallverdu-Queralt et al., 2012; Choi et al., 2014). Carotenoids, in particular lycopene and β-carotene, are one of the most important bioactive compounds in tomato; their antioxidant and anti-proliferative activities associate them with protection from heart diseases and prostate cancer (Rissanen et al., 2003; Campbell et al., 2004). In addition, these carotenoids give tomato fruit their characteristic color. The antioxidative compounds in tomato also inhibit reactive oxygen species, which are contributing factors in many deadly diseases, via free-radical scavenging, metal chelation, inhibition of cellular proliferation, and modulation of enzymatic activity and signal transduction pathways. Furthermore, the sweet and sour flavors of tomato fruits are related to the reducing sugars (glucose and fructose) and organic acids such as citric and malic acids. These flavors are essential quality factors for consumers of the fresh fruit and for the processing industry. The color value also plays an important role in the exterior quality of the tomato fruit and impacts consumer preference (Stevens and Rick, 1986). Overall tomato quality for fresh consumption is determined by several factors including size, color, firmness, flavor, and nutritional properties.
The quantity and composition of beneficial compounds present in tomato vary significantly depending on various plant specific factors and environmental conditions. Antioxidant properties of the fruit are influenced by genotype, degree of ripening, soil and climate conditions, part of the fruit, light, temperature, growing season, agricultural practices, and postharvest conditions (Kotikova et al., 2011; Oms-Oliu et al., 2011; Kubota et al., 2012; Vallverdu-Queralt et al., 2012; Tinyane et al., 2013; Kuscu et al., 2014; Vinha et al., 2014; Riga, 2015). Of these factors, genotype is one of the most important for determining the quantity of phytochemicals, and consequently for the overall quality of the tomato fruit. Several studies have investigated the effect of genotype on phytochemical constituent values, quality attributes, and antioxidant activities in tomatoes with different origins, including those from India (Kaur et al., 2013; Kavitha et al., 2014), Italy (Erba et al., 2013), China (Li et al.; 2013), and the USA (Breksa III et al., 2015). Information about the nutritional quality of Korean tomatoes is limited (Choi et al., 2014). Furthermore, comparison of several phytochemicals and color attributes are yet to be assessed in detail in cherry and regular tomato varieties. The main aim of this study was to describe the nutritional value, quality parameters, and antioxidant activities of several commercial varieties of tomato commonly grown in South Korea. We selected 20 commercial cultivars, analyzed their carotenoid, vitamin C, flavonoid, and total polyphenols content, and calculated the total antioxidant activity. The results of this study provide useful information for breeders and farmers to select tomato cultivars with high quality and improved nutritional value.
Materials and Methods
Plant Materials and Cultivation
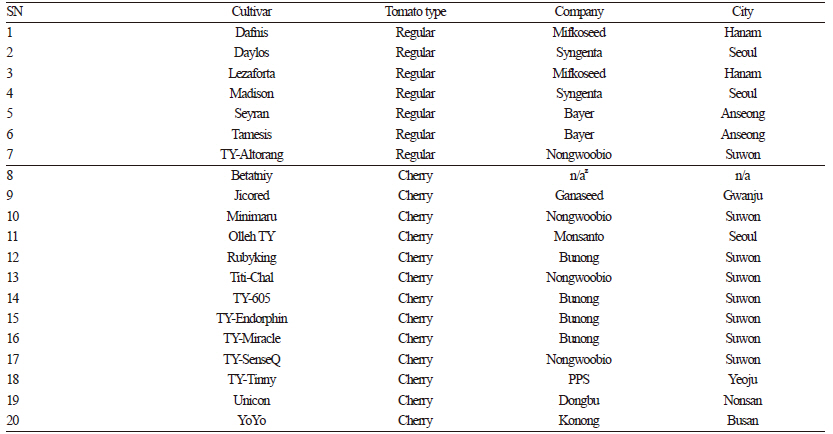
A total of 20 tomato cultivars were used in this study: seven cultivars with regular tomato fruit (Dafnis, Daylos, Lezaforta, Madison, Seyran, Tamesis, and TY-Altorang) and thirteen cultivars of cherry tomato with small fruit (Betatniy, Jicored, Minimaru, Olleh TY, Titi-Chal, TY-605, TY-Endorphin, TY-Miracle, Rubyking, TY-SenseQ, TY-Tinny, Unicon, and YoYo). Tomato seeds were obtained from Korean seed companies as described in Table 1. The seeds were sown on plug trays on April 5, 2015, and 35-day-old seedlings were transplanted to a greenhouse at the Chonbuk National University, Korea, with a planting distance of 50 x 90 cm. A drip irrigation system was used to supply water to the plants during the experiment. Fertilizer and pesticides were applied according to standard culture practices. During the experiment, no incidence of diseases was observed. Simple pruning management was carried out each morning with nylon strips used to train the plants for straight growth. Plants were grown until fruits had developed on the sixth cluster, whereupon topping was done above this cluster to prevent further growth. Mature fruits were harvested in August, 2015, and 1.5 kg samples were collected from each cultivar for qualitative measurements and phytochemical analysis. Color attributes were evaluated within 6 h of harvest. Vitamin C, total soluble solids, carotenoids, titratable acidity, and pH were measured on a fresh weight basis. The samples were ground into fine powder in liquid nitrogen, freeze dried, and stored at -80°C for subsequent analyses of total phenols, flavonoid profile, and antioxidant activity.
Determination of Quality Attributes
Tomato fruits were analyzed for color attributes, total soluble solids (TSS), titratable acidity (TA), and pH. Color was measured according to the International Commission on Illumination using a Konica Minolta CM 2002 spectrophotometer (Konica Minolta, Inc., Osaka, Japan). Three measurements were taken for each fruit (one on the blossom end and two in the equatorial region on each half of the tomato) and values were recorded for lightness (L), redness (a), yellowness (b), hue (h), and chroma (c). The mean value for each parameter was derived from the three measured locations for ten tomato fruits of each genotype. Furthermore, fresh fruits were homogenized, filtered through Whatman No. 2 filter paper, and the filtrate was used to measure TSS, TA, and pH. TSS was measured with a hand-held refractometer (Atago, Tokyo, Japan) calibrated with distilled water. TA was determined from a 10 mL aliquot using a direct titration method. The aliquot was diluted 10-fold with distilled water, stirred for 5 min, and titrated with 0.1 M NaOH using an EasyPlus Titrator (Mettler Toledo Inc., Greifensee, Switzerland). The results were expressed as a percentage of citric acid (mg of citric acid per 100 g of sample). The pH value of the aliquot was measured using a pH meter (HM-30P; DKK-TOA Corporation, Tokyo, Japan).
Analysis of Carotenoids
Lycopene and β-carotene contents were measured according to the method described by Nagata and Yamashita (1992). Briefly, 10 g of fresh tomato paste was extracted with 25 mL of acetone:hexane solution (2:3, v/v), the mixture was centrifuged, and the absorbance of the supernatant was measured at 453, 505, 645, and 663 nm using a microplate spectrophotometer (Multiskan GO; Thermo Scientific Inc., Waltham, MA, USA). The β-carotene and lycopene content in a sample were expressed in milligrams per 100 grams of fresh sample and calculated according to the following equations:
β-carotene (mg∙100 mL-1) = 0.216 × A663 − 1.220 × A645 − 0.304 × A505 + 0.452 × A453,
lycopene (mg∙100 mL-1) = -0.0458 × A663 + 0.204 × A645 − 0.304 × A505 + 0.452 × A453.
Analysis of Vitamin C
Vitamin C content was analyzed according to the methods described by Spinola et al. (2012) with modifications. Tomato fruits were ground into a fine paste and 5 g of the paste was extracted with 5% metaphosphoric acid solution. After the centrifugation and filtration of the extract (through a 0.20-μm syringe filter), the aliquot was analyzed using an 1260 Infinity HPLC system (Agilent Technologies, Santa Clara, CA, USA) equipped with an Acquity UPLC HSS T3 column (2.1 × 100 mm, 1.8 μm; Waters, Milford, MA, USA) and a diode array detector at 254 nm wavelength. An isocratic mobile phase composed of aqueous 0.1% (v/v) formic acid was used for the separation of the ascorbic acid peak at a flow rate of 0.3 mL∙min-1. An authentic ascorbic acid standard at various concentrations (5–100 ppm) was used for the identification and quantification of the peak. The vitamin C content was calculated using the calibration curve (y = 95.195x + 78.151; R2 =0.9993), and the results were expressed as mg·100 g-1 of fresh weight.
Measurement of Total Phenolic Content
Total phenolic content was estimated using the Folin-Ciocalteu colorimetric method, using gallic acid as the standard phenolic compound, according to the protocol described by Singleton and Rossi (1965). Freeze-dried powdered samples (0.05 g) were extracted with 80% methanol for 1 h at 50°C in a water bath. The extracts were centrifuged and filtered through 0.45-μm syringe filters and 200 μL of each supernatant was mixed with 0.6 mL distilled water in 1.5-mL centrifuge tubes. After adding 200 μL Folin’s reagent, the solutions were incubated in a water bath at 27°C for 5 min followed by the addition of 200 μL of saturated sodium carbonate. After 1 h, absorbance of the extracts was measured at 760 nm using a microplate spectrophotometer (Multiskan GO; Thermo Scientific Inc., Waltham, MA, USA) and 80% methanol as a blank. Gallic acid standards of various concentrations (5.0–100.0 ppm) were used to calculate the standard curve (y = 0.0084x + 0.1073; R2 = 0.9992), and total phenol content was expressed as milligrams of gallic acid equivalents (GAE) per 100 grams (mg GAE∙100 g-1) of dry weight.
Analysis of Flavonoids
Flavonoid analysis (of the four flavonols: kaempferol, quercetin, rutin, and myricetin; two flavones: luteolin and apigenin; and one flavanone: naringenin) was conducted following the method described by Hertog et al. (1992) with some modifications. Lyophilized tomato samples (0.05 g) were extracted for 2 h at 80°C with 50% methanol containing 1.2 MHCl and 0.4 g L-1 t-butyl hydroquinone. After cooling to room temperature, samples were centrifuged at 4,000 rpm for 10 min, diluted 10-fold with methanol, and filtered through a 0.2-μm syringe filter; 20 μL of the filtrate was analyzed using a 1260 Infinity HPLC system (Agilent Technologies, USA) equipped with a quaternary HPLC pump, autosampler, and diode array detector. Separation was performed in a Nova-Pak C18 4 μm column (3.9 × 150 mm) (Waters, USA) at 210 nm wavelength. The mobile phase consisted of isocratic 25% acetonitrile in 0.025 M KH2PO4 at a flow rate of 0.9 L∙min-1. Identification and quantification of individual flavonoids was carried out using commercial standards with the linear range of 0.5-10.0 ppm. All the analyses were performed in triplicate and the results were expressed as milligrams per gram (mg∙g-1) of dry weight.
Measurement of Antioxidant Activities
Free Radical Scavenging Activity using DPPH Assay
The 2,2,-diphenyl-1-picrylhydrazyl (DPPH) assay is typically used to measure the scavenging ability of antioxidants toward the stable radical DPPH. This assay was performed according to the methods described by Koleva et al. (2002) with modifications. Briefly, 400 μM DPPH solution was prepared in 80% methanol and 100 μL was mixed with 100 μL of extract (50 mg sample extracted in 1.5 mL 80% MeOH) in 96-well plates. After 30 min, in the dark, at room temperature, absorbance was measured at 517 nm in a microplate spectrophotometer (Multiskan GO; Thermo Scientific Inc., Waltham, MA, USA) using 80% methanol without DPPH as a blank. Similarly, absorbance was measured by mixing 100 μL of sample with 100 μL of 80% methanol. Free-radical-scavenging activity (%) was calculated using the following equation:
% DPPH radical-scavenging activity = (B – A) 100/B
Where, A is the absorbance of [(Sample + DPPH) – (Sample + Methanol)] and B is the absorbance of [(Methanol + DPPH) – (Methanol)].
Different concentrations of (±)-6-hydroxy-2,5,7,8-tetramethylchromane-2-carboxylic acid (trolox) (100-1,000 μmol) were used as a standard compound to calculate the standard curve (y = -0.001x + 1.0862; R2 = 0.9966). Results were expressed as trolox equivalent antioxidant capacity per gram dry weight (μmol TE∙g-1).
Determination of 2,2’-azino-bis(3-ethylbenzothiazoline-6-sulfonic acid) (ABTS) Assay
A 50-mg lyophilized sample was used to determine antioxidant activity after extraction with 1.5 mL of 80% MeOH for 1 h, followed by filtration. The ABTS assay was performed following the method described by Re et al. (1999) with slight modifications. First, ABTS radical cation (ABTS*+) was produced by reacting 7 mM ABTS solution with 2.45 mM potassium persulfate in the dark, at room temperature, for 16 h. The ABTS*+ solution was then diluted with methanol to an absorbance of 0.9 ± 0.02 at 734 nm. The sample extract (50 μL) was then added to 950 μL of ABTS*+ solution and the absorbance was measured at 734 nm after 2 h of incubation in the dark using a micro plate spectrophotometer (Multiskan GO; Thermo Scientific Inc., Waltham, MA, USA). Different concentrations of trolox (100-1,000 μmol) were used as a standard to calculate the standard curve (y = -0.001x + 1.0862; R2 = 0.9966). Results were expressed as trolox equivalent antioxidant capacity per dry weight (μmol TE∙g-1).
Determination of the Ferric Reducing Antioxidant Power (FRAP) Assay
The FRAP assay was performed according to the method described by Benzie and Strain (1996) with slight modifications.Stock solutions consisted of: 300 mM acetate buffer (3.1 g C2H3NaO2·3H2O and 16 mL C2H4O2 pH 3.6), 10 mM 2,4,6-Tris (2-pyridyl)-s-triazine (TPTZ) solution in 40 mM HCl, and 20 mM FeCl3·6H2O solution. A fresh working solution was prepared by mixing acetate buffer, TPTZ solution, and FeCl3·6H2O solution in 10:1:1 ratio (v/v/v) just prior to use. Tomato extracts (50 μL) from 50 mg sample in 1.5 mL-1 80% MeOH were allowed to react with 950 μL of the FRAP solution for 10 min at 37°C. Readings of the colored product were then taken at 593 nm using a microplate spectrophotometer (Multiskan GO; Thermo Scientific Inc., Waltham, MA, USA). Different concentrations of trolox (100–1,000 μmol) were used to calculate the standard curve (y = 0.013x + 0.0681; R2 = 0.9999). Results were expressed in trolox equivalent antioxidant capacity per dry weight (μmol TE∙g-1).
Chemicals and Reagents
Authentic standards, for L-ascorbic acid, DPPH, gallic acid, trolox, kaempferol, quercetin, rutin, myricetin, luteolin, apigenin and (±)-naringenin, and also chemicals, including sodium hydroxide, sodium carbonate, potassium dihydrogen phosphate (KH2PO4), tert-butylhydroquinone (TBHQ), sodium acetate, Folin-Ciocalteu reagent, TPTZ, ferric chloride hexahydrate, potassium persulfate, and ABTS, were purchased from Sigma Aldrich (St. Louis, MO, USA). Metaphosphoric acid was purchased from Daejung Chemicals & Materials Co. (Siheung, Gyeonggido, Korea). Other chemicals including glacial acetic acid, acetonitrile (HPLC grade), methanol (HPLC grade), n-hexane (HPLC grade), acetone (HPLC grade), HCl (ACS reagent), and formic acid (ACS reagent) were purchased from J.T. Baker (Phillipsburg, NJ, USA).
Statistical Analyses
Color attributes were presented as a mean ± SD of 10 replications. Other parameters were presented as a mean ± SD of three replications. Statistical analysis was performed using SPSS version 20 (IBM Corp., Armonk, NY, USA). Analysis of variance followed by Duncan’s multiple range test (DMRT) was used to assess statistical differences among the means at p <0.05.
Results and Discussion
Quality Characteristics and Color Attributes
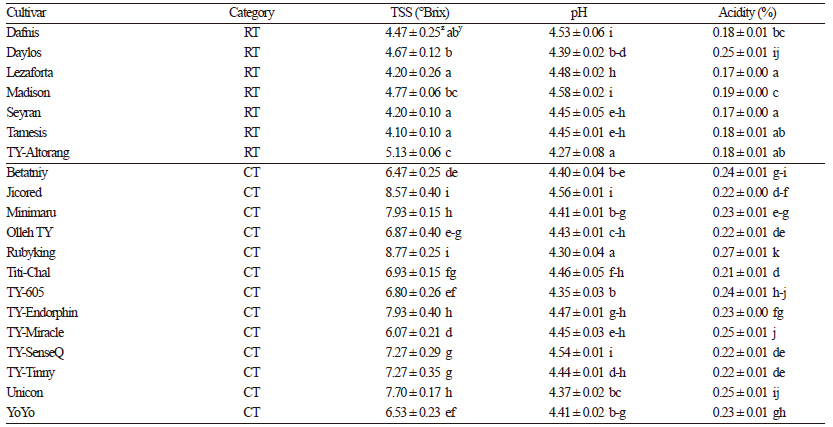
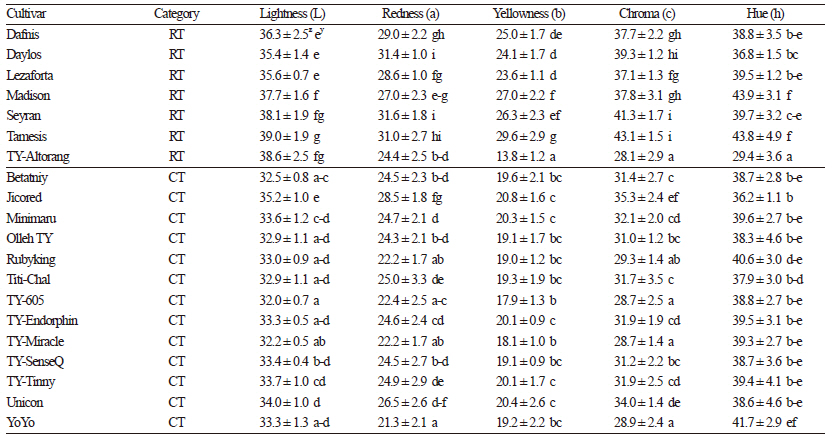
TSS are the key determinants of shelf life and crop quality in both fresh produce and processing tomatoes. TSS significantly contribute to tomato flavor and consistency and are related to the amount of sugars, mainly glucose and fructose, present in the fruit. TSS also impact sensory attributes, such as taste, sweetness, and acidity. TSS ranged from 4.10 °Brix in Tamesis to 8.77 °Brix in Rubyking (Table 2). The values observed in this study were similar to those reported by Kavitha et al. (2014) in their analysis of 54 tomato genotypes from India. All cherry tomato cultivars, in our study, exhibited higher levels of TSS (6.47 to 8.77 °Brix) than regular tomato cultivars, similar to observations by Causse et al. (2001). These TSS levels are higher than those observed in 10 cherry tomato varieties from India where TSS contents ranged from 4.66 to 5.86 °Brix (Kaur et al., 2013), suggesting that Korean cherry tomatoes are of high quality. TSS content among tomato fruits from regular varieties was relatively uniform and ranged from 4.10 to 5.13 °Brix in our study. The average pH value across all varieties was 4.44, ranging from 4.27 to 4.53. Acids are important factors that govern microbial stability and influence the processing time and temperature during preparation of tomato products. In this study, the acidity among the cultivars ranged from 0.17% to 0.27%, which was lower than that reported by Kaur et al. (2013) and Breksa III et al. (2015) and within the range of acidity reported by Vinha et al. (2014). The observed differences in TSS, pH, and acidity were likely due to different genotypes and growing conditions. TSS and TA are important for the processing industry because sugars and acids are important constituents of flavor in tomatoes, thus cherry tomato cultivars with higher TSS and acidity are most desirable for processing. Fruit color is a quality characteristic that has received considerable attention from fresh-market consumers as well as tomato processing industries. Tomato fruit color is the total amount and proportion of different carotenoids and is an important indicator of ripeness. In this study, L (lightness) values ranged from 32.0 to 38.6, a (redness) values ranged from 21.3 to 31.6, and b (yellowness) values ranged from 13.8 to 27.0 (Table 3). Chroma (c), representing the vividness of color, is a good indicator of consumer acceptance. This trait showed significant variation (p <0.05 using DMRT) among the cultivars, with regular cultivars generally exhibiting higher color intensity values compared to the cherry tomato cultivars.
Carotenoid Contents
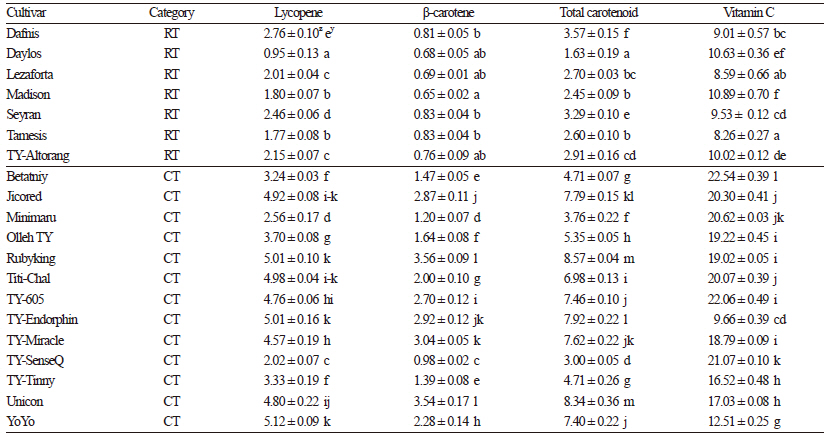
Analysis of carotenoid contents revealed that lycopene content was higher than β-carotene levels (Table 4). The lycopene and β-carotene contents varied significantly (p <0.05 using DMRT) among the cultivars with lycopene content varied from 0.95 mg∙100 g-1 in Daylos to 5.12 mg∙100 g-1 in YoYo, and β-carotene content ranged from 0.65 mg∙100 g-1 in Madison to 3.56 mg∙100 g-1 in Rubyking. The carotenoid levels observed in the present study were similar to those reported by Kavitha et al. (2014), and higher than those reported by Pinela et al. (2012) and Tinyane et al. (2013). In contrast, the values obtained by Kotikova et al. (2011) were much higher compared to those reported herein, which might be due to differencest in varieties and growing conditions (Kuscu et al., 2014). Of the two carotenoids, lycopene exhibited higher overall cultivardependent variation, in line with observations by Taber et al. (2008) who also observed lycopene content influenced by genotype. Furthermore, almost all cherry tomato cultivars exhibited statistically higher lycopene and β-carotene content as compared to regular tomato varieties, suggesting higher nutritional value of cherry tomatoes.
Vitamin C Content
Vitamin C is a powerful water-soluble antioxidant that plays an important role in the suppression of free radicals. In this study, vitamin C content showed significant differences among the cultivars (p <0.05 using DMRT), ranging from 8.26 mg∙100 g-1 in Tamesis to 22.54 mg∙100 g-1 in Betatniy (Table 4). All cherry tomato cultivars, except the cultivar TYEndorphin, exhibited statistically higher vitamin C content compared to regular tomatoes. The vitamin C content in most of the cherry tomato cultivars was similar to that reported by Pinela et al. (2012) but lower than levels reported by Kaur et al. (2013) and Vinha et al. (2014). These differences in vitamin C content might be explained by light and temperature variations or by genotype. The higher vitamin C levels found in cherry tomato varieties further validate the higher nutrition in cherry over the regular tomato varieties evaluated in this study.
Total Phenol Content
Phenolic compounds are important secondary metabolites that possess various biological activities, most importantly antioxidant activity associated with reduced cancer risk (Manach et al., 2005). Total phenolic compounds, expressed as GAE, correspond to the mean response of all major phenolic compounds present in fruits and vegetables (George et al., 2005). The total phenol content measured in this study averaged 218.7 mg GAE∙100 g-1, but varied significantly from 168.2 mg GAE∙100 g-1 in Seyran to 290.7 mg GAE∙100 g-1 in TY 605 (Fig. 1). All cherry tomato cultivars had statistically higher (p <0.05 using DMRT) total phenol content than regular varieties with the exception of Betatniy and YoYo. The overall genotypic variation for phenols was lower than that observed for carotenoids but higher than that of vitamin C content.
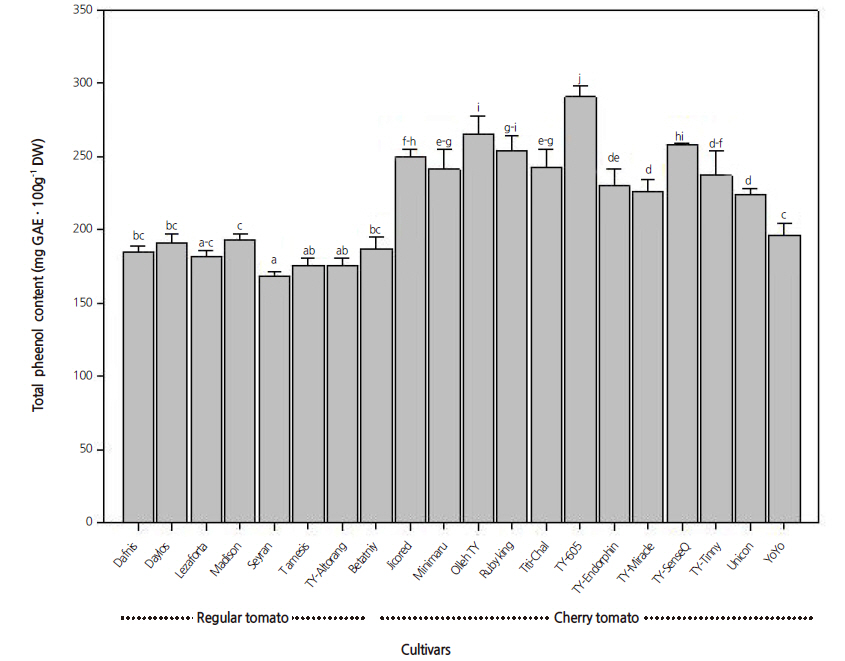
Overall, the total phenol content was comparable to that reported by Kavitha et al. (2014). However, lower phenol values were also reported by Tinyane et al. (2013) which might be due to genotype differences, agricultural practices, or environmental conditions. Similar to vitamin C and carotenoids, we found a statistically higher (p <0.05 using DMRT) total phenol content in cherry tomato cultivars, suggesting their higher nutritional value and superior quality. Further quantitative studies of individual phenolic compounds are needed to confirm the contribution of each phenolic compound to total phenol content.
Flavonoid Content
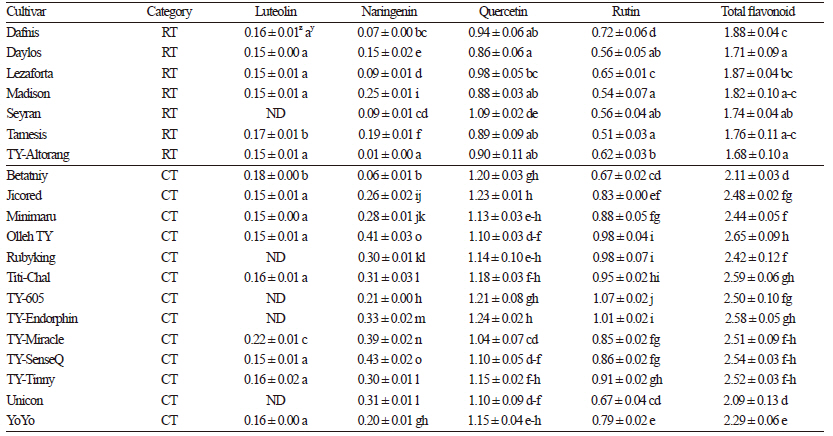
Flavonoids are important plant secondary metabolites that possess strong antioxidant activity due to their ability to scavenge reactive oxygen species and thus decrease oxidative stress (Pourcel et al., 2006; Koh et al., 2009). The varietal differences in individual, as well as total, flavonoid content are presented in Table 5. Quercetin, the predominant flavonoid component identified in this study, varied from 0.86 mg∙g-1 in Daylos to 1.24 mg∙g-1 in TY-Endorphin. Rutin and naringenin were the second and third most abundant flavonoids, respectively, while luteolin was least abundant, and absent in some cultivars. The observed flavonoid amounts were higher than those reported by Kalogeropoulos et al. (2012). The total flavonoid content significantly varied (p <0.05 using DMRT) among the cultivars, ranging from 1.71 mg∙g-1 in Daylos to 2.65 mg∙g-1 in Olleh TY. All cherry tomato cultivars exhibited statistically (p <0.05 using DMRT) higher individual, as well as total, flavonoid content than regular fruit cultivars, suggesting higher nutritional value of the cherry tomatoes. Furthermore, this is the first report to address the genotypic variation in both individual and total flavonoid content among tomato cultivars grown in South Korea.
Antioxidant Activity and Reducing Power of Tomato Extracts
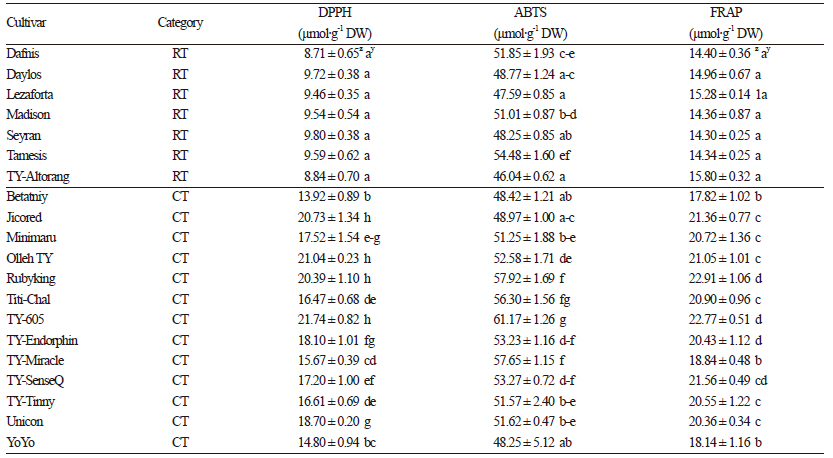
Antioxidant capacity, the ability to inhibit the process of oxidation, is an important parameter in the health benefits of food products. Antioxidant activity of tomato extracts were evaluated using both DPPH and ABTS tests, to ensure antioxidant activity was sufficiently described. Methanol extract was used for the antioxidant evaluation because it shows higher antioxidant capacity as compared to other extracts (Kotikova et al., 2011). The free radical scavenging activity determined by the DPPH test varied significantly (p <0.05 using DMRT) from 8.71 μmol TE∙g-1 to 21.74 μmol TE∙g-1 on a dry weight basis (Table 6). The differences observed among the regular tomato varieties were not statistically significant (p <0.05 using DMRT). The antioxidant values determined by the ABTS method varied from 46.04 μmol TE∙g-1 to 61.17 μmol TE∙g-1. Both testing methods identified generally higher antioxidant levels in cherry tomato cultivars than their regular variety counterparts. The significantly higher (p <0.05 using DMRT) DPPH values seen in Rubyking, TY-605, Olleh TY, Jicored Titi-chal, Minimaru, and Unicon were likely due to higher phenol and flavonoid content in these cultivars (Nencini et al., 2011). However, the same trend was not observed for the ABTS value in most of the cultivars. Overall, the results suggestthat cherry tomato cultivars possess alleles that can produce higher antioxidant activity.
FRAP, one of the most common methods used for the evaluation of the reducing power of extracts to reduce Fe3+ to Fe2+, ranged from 14.30 μmol TE∙g-1 to 22.91 μmol TE∙g-1 on a dry weight basis (Table 6). Similar to the DPPH and ABTS assays, all cherry tomato cultivars exhibited statistically higher values of FRAP and higher genotypic variation than regular tomato cultivars. In contrast, no statistical differences (p <0.05 using DMRT) were observed in the regular cultivars and genotypic variation was lower than levels observed in cherry tomato varieties.
Correlation between Antioxidant Activities and Antioxidants
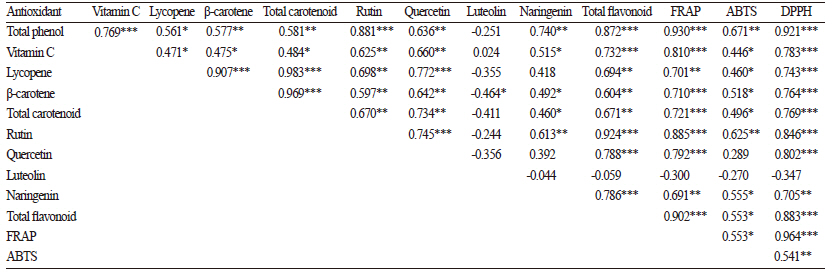
To understand the accumulation pattern of different phytochemicals and their overall contribution to the antioxidant activity, we analyzed the correlations among antioxidants. All phytochemicals, except luteolin, significantly contributed (p <0.05 using DMRT) to the antioxidant properties. Total phenols showed the highest correlation with antioxidant activity according to the FRAP assay (r = 0.930***), followed by rutin (r = 0.885***), vitamin C (r = 0.810***), and quercetin (r =0.792***) (p <0.05 using DMRT) (Table 7). Strong correlations were also observed between total phenols and antioxidant activity in other plants, including red pepper, broccoli, cauliflower, and garlic (Aires et al., 2011; Bhandari et al., 2013 & 2014). Total phenol content exhibited the highest correlation with the ABTS and DPPH assays. Taken together, all the antioxidants showed a significant (p <0.05 using DMRT) positive correlation with each of the antioxidant assays. All phytochemicals also showed significant correlations to each other, with the exception of luteolin; also, total phenolic compounds and flavonoids showed the strongest correlation among the antioxidants.
In conclusion, significant genotypic variation was observed in nutritional status and qualitative parameters in the tomato varieties commercially cultivated in South Korea. Most of the phytochemicals were present in higher quantities in cherry tomato cultivars while color attributes were higher in regular tomato varieties. Cultivars Jicored, Titi-Chal, TY-Endorphin, and Rubyking had high levels of lycopene and other anti-oxidative compounds and showed higher antioxidant activity compared to other cultivars. These results show that varieties can be identified with better nutritional value and these findings provide valuable nutritional information to consumers for selecting cultivars for fresh market consumption. Cultivation of those varieties with higher nutritional values for commercial purposes would also have health benefit to consumers.
