

Introduction
Materials and Methods
Pear Samples and Pretreatment
OCT Imaging
Image Processing
Quantitative Analysis
Results
Changes in the Average OCTSS and D1/e Values
Change in the average / between bruised and unbruised pears
Discussion
Introduction
Internal bruising is a common physical injury in pear fruit (Komanichi et al., 2016; Zhao et al., 2010). Mechanical impacts can easily damage pear fruit during harvest, transportation, storage, and distribution (Li and Thomas 2014; Zhou et al., 2007), causing rupture or even separation of the pear tissue and consequently causing a loss of commercial value due to customer dissatisfaction (Pasini et al., 2014). The nature of fruit bruising is related to bruise type, bruise severity, fruit variety, and fruit postharvest conditions, although mechanical impact may damage the inner fruit tissue without any visible change in the peel. As a result, early-stage bruising is difficult to detect by traditional
vision-based methods or manual inspection by even well-trained professionals because no color change may appear on the fruit surface (Ying et al., 2000). In addition, visual inspection is time-consuming and inefficient (Cao et al., 2011), so it has been abandoned as an industry practice. Instead, inner vision technologies, including optical spectroscopy and imaging, have drawn an increasing amount of attention in the fruit industry and have been introduced for pear bruise detection because of their accuracy, efficiency, affordability, and consistency.
Near-infrared spectroscopy (NIRS) and computer vision are two methods that have been applied successfully in evaluating fruit quality. In particular, visible and near-infrared spectroscopy based on light reflection or absorption in the 350- to 2,500-nm wavelength range is believed to be an accurate approach for detecting bruised tissues (Lee et al., 2014). However, slight changes in the chemical composition of a small area of the fruit body might not result in detectable light reflection and changes in absorption; in other words, visible and near-infrared spectroscopy are not sensitive enough for evaluating fruit quality in an industry application (Sun et al., 2016). In recent years, hyperspectral imaging (HSI), which provides both spectral and spatial information, has been applied in the mapping, agricultural, pharmaceutical, and medical fields (Pu et al., 2015; Wang et al., 2016). A number of studies have suggested HSI technology for the early prediction of bruises to apple, pear, and other fruits (Keresztes et al., 2016; Rivera et al., 2014). However, HSI processing requires a long running time, which limits its usefulness as an online application. To overcome this disadvantage, a band-selecting algorithm has been developed to determine the optimal wavelengths and accelerate the processing speed (Liu et al., 2014). Nevertheless, this technology is still not an ideal tool that can be used to detect bruising within 24 h after impact when spectral variations between bruised tissue and the surrounding intact tissue are subtle and unstable.
Other inter-visualization methods have also been proposed. Magnetic resonance imaging (MRI) is a noninvasive technology used for visualizing water distribution and microstructural information of fruit tissues. Despite the fact that the density of MRI images varies with the water concentration in an object, MRI is not sensitive to minor changes in constituents (e.g., proteins and starch). When applying MRI to detect internal bruises of potatoes, Thybo et al. (2004) found that water content significantly affected the performance of MRI. Thermal imaging, an infrared-radiation-based analytical technique, was reportedly able to capture the temperature difference between bruised and unbruised fruit tissues (Baranowski et al., 2012; Varith et al., 2003). Jackson and Harker (1999) used electrical impedance to determine the tissue damage status of apple fruit. In addition, Harker et al. (2000) used an infrared CO2 analyzer to detect mechanical injury of apple fruit based on CO2 emission concentration. However, all of the above approaches can only be used for later-stage injury rather than early-stage bruises because of their limited detection sensitivity and high susceptibility to disturbance factors.
Over the past decade, optical coherence tomography (OCT), a nondestructive interferometric imaging technique that can reflect the microstructural changes of in vivo tissue within a micrometer scale, has been developed rapidly because of its undeniable advantage (Carlo et al., 2015; Podoleanu 2015). First, an OCT device can capture 2D or 3D images for a large spatial area within only a few seconds and thus allows rapid scanning of the whole or local area of fruit, making it a promising tool for industrial application. Second, an OCT device collects the photons from interference light under the peel and thus avoids disturbance factors from peel color and thickness characteristics. As a result, compared to spectroscopy-based and computer vision technologies, the OCT signal is much less affected by fruit variety and origin, making it relatively stable. OCT was first used in the medical field, including for ophthalmology and cardiovascular medicine, with a special fiber probe (Castillo et al., 2015; Patel et al., 2005). In recent years, OCT has been introduced into agriculture and used to detect the peel structure of apple and kiwifruit nondestructively for evaluating the effects of preharvest fertilization and storage. In peel surface evaluation, including the evaluation of cracks in the wax, surface roughness, and lenticels, OCT images can demonstrate the cellular structure in a layer a few hundreds of micrometers underneath the peel surface; it is clearly superior to confocal imaging with regards to depth (Li et al., 2015; Verboven et al., 2013). This suggests a great potential of OCT in detecting early-stage fruit bruising.
OCT provides a depth-resolved profile of the distribution of the light intensity that reflects changes in tissue components and structures. Hence, the OCT signal slope (OCTSS), which represents the scattering of light by pear tissue, serves as an ideal indictor for mechanical injury (Feng et al., 2010). The 1/e light penetration depth (D1/e) can be used to determine minor changes of multiple scattering caused by shifting of the refractive index in bruised tissue (Liu et al., 2015). In other words, the values of OCTSS and 1/e light penetration depth extracted from an OCT image are closely correlated to tissue bruising. Another metric used to differentiate unbruised and bruised tissues is the spatial variation found by fitting the OCT data to a gamma distribution function. This approach has been used in previous studies concerning the characterization of tissue using high-frequency ultrasound, where the gray-scale pixel distribution is defined as a gamma distribution (Shimazaki and Shinomoto, 2007). Therefore, the variations in the tissue status can be quantified using the parameters of the defined distribution function, thereby improving the accuracy and stability of the detection results.
The objective of this study was to investigate the feasibility of using OCT for early bruise detection (within 12 h) of pear fruit. A quantitative analysis model was also proposed for automated classification between unbruised and bruised tissues for use with online applications.
Materials and Methods
Pear Samples and Pretreatment
The ‘Korla Fragrant’ pear variety was used in this experiment. A total of 40 fruit samples, which were cultivated in Xinjiang Province, China, and harvested on October 5, 2016, were purchased from a local market in Hangzhou, Zhejiang, China. To simulate commercial storage conditions, these samples were stored at a constant temperature of 20°C for 7 days before the experiment without any air regulation to keep the fruit fresh. Twenty samples were mechanically injured with a self-made device designed to drop a steel ball (18 mm in diameter) through a cylinder (20 mm in diameter) onto the fruit surface from a height of 0.25 m. A 22-gram steel ball was used to generate the hidden bruise in the fruit. The remaining 20 sample fruits were used as control groups without an intentional mechanical injury. After impact, the injured area of each sample was marked with ink as the surface of the region of interest (ROI) for later OCT scanning. The above mechanical injury simulation method was described previously (Testoni and Grassi, 1995).
Scanning with OCT does not require any specific sample pretreatment. The ROIs of the samples were directly scanned by a spectral OCT device at 6 and 12 h after initial injury. Twenty images were obtained for each of the three groups, i.e., the pear samples at 6 h (6H group) and 12 h after impact (12H group), and without impact (non-injury control group). After 12 h, the samples could easily be classified by modern computer vision techniques because the color changed over time, and color change after that time was not the focus of this study.
OCT Imaging
The high-resolution OCT images were captured by an OCT imaging system (Model TEL220C1) manufactured by Thorlabs, Inc. (Newton, NJ, USA). To display and process 2D and 3D OCT data in real time, 64-bit software was pre-installed on the computer. The detection platform consisted of the following components: (1) TELESTO base unit, which includes the line charge-coupled device (CCD) camera, interferometer, and optical fiber of the OCT imaging system; (2) LSM03 integrated probe; and (3) sample stage (Trottmann et al., 2016). Because the light at shorter wavelengths (e.g., 600 nm) attenuates much faster once it enters tissue, and therefore has a lower penetration depth, the system was adjusted to achieve high sensitivity at a central wavelength of 1,300 nm. The OCT device vertically acquired images by capturing the backscattered photons with a proper reference path length and path aperture according to the manufacturer’s instructions (Wykoff et al., 2010).
Image Processing
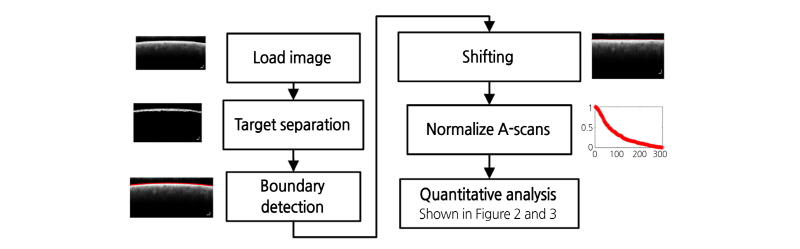
To accurately classify bruised pear tissue, we previously proposed a preprocessing algorithm for quantitative analysis of OCT images (Zhou et al., 2016; Fig. 1). Following detection of the boundary between the background and pear target, the objective of separation was to obtain a pear target from each raw image. Because the OCT images were contaminated by speckle noise, the pixel gray-scale at the background position as not zero (zero in an OCT image indicates pure black). Before separation, threshold denoising was performed to suppress noise disturbance with a threshold of  + 7
+ 7 , where
  and
and  are the grayscale mean and variance from the top 20 rows in the background, respectively (Dong et al., 2013). After denoising, the boundary between the target and background was easily identified by determining the top non-zero pixels at each column in an OCT image. Next, the detected boundary was fitted by a polynomial curve to flatten and smooth the boundary. Finally, the pixels in every column were vertically shifted up with the top point in the polynomial curve as a reference horizontal mark; as a result, the boundary was converted into a horizontal line. This bright, thick line represented the thin peel surface layer of the pear fruit, which does not contain any bruise information. Using the graph- segment approach (Gao et al., 2017), another boundary between the peel and flesh tissue was found. Taking the pixels on the tissue boundary as a starting point, the intensity/gray-scale profile of each A-scan was normalized, and the average normalized A-scans taken from the ROI in each OCT B-scan were used for the subsequent quantitative analysis.
Quantitative Analysis
Optical coherence tomography technology can detect the microstructure of pear fruit tissues in high-resolution mode and display the micro-variations caused by injury as pixel gray-scale changes in the image. Two quantitative indicators, OCTSS and 1/e light penetration depth (D1/e), which respectively represent the degree of light scattering by tissue and multiple scattering effect (Xu et al., 2011), were chosen for early bruise detection of pear fruit. Moreover, because the OCTSS and D1/e values that were derived from the average normalized A-scan profiles might be related to the refractive index of pear cells, we investigated whether OCT data can also be used to determine the severity of a bruise in injured fruit tissue.
The profile/curve for quantitative analysis was obtained by averaging normalized A-scans (pixel gray-scale) of ROIs described in the image-processing section, which reflected the relationship between the intensity and depth of optical interference. In our experiment, each ROI consisted of 600-A (depth) scans with a lateral depth of 1.4 mm. Based on the assumption of linear and minimal fluctuations, the OCTSS value was the absolute slope of the line region from the bottom of the peel to a depth of 0.27 mm; a linear fitting was performed. For the 1/e light penetration depth, we applied an extra exponential curve-fitting process and fit the averaged profile to derive the depth at 1/e light attenuation. A representative pear OCT image is shown in Fig. 2A, and the definitions of OCTSS and D1/e are illustrated in Fig. 2B.
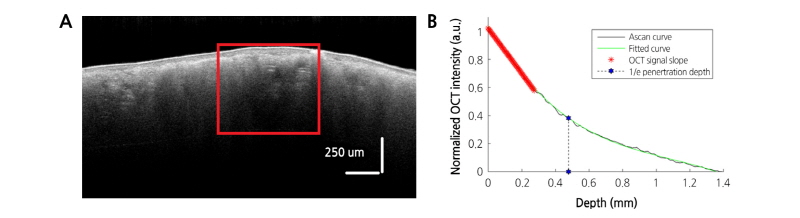
Fig. 2. (A) OCT image of representative pear fruit. (B) The relationship between interference intensity and penetration depth. The values were obtained by averaging the 600-A scans of regions of interest, and the values of OCT signal scope and light penetration depth (D1/e) were derived from the linear fitting curve.
Alternatively, the distribution function can be used to measure the variations caused by scattering in an OCT image
(Lindenmaier et al., 2013). The gamma distribution function,  , which is often used in
high-frequency ultrasound tissue classification, was applied to quantify the spatial variation of fruit tissue by fitting the function using a least squares optimization algorithm. Using a histogram of the intensity distribution of OCT pixels in the ROIs, we further investigated whether the gamma distribution function differed between normal and injured tissue (Fig. 3). Due to the range/scale difference between the defined distribution function and the real histogram, the distribution function was multiplied by 550 in order to fit the profile of the histogram in our experiments (Eq. 1):
 (1)
(1)
where  and
and  were free parameters for shaping and scaling of the histogram, respectively. The mean of the distribution defined as
  /
/ was used as a composite indicator for detecting early bruising in pear fruit because the
  /
/ ratio was related to the effective light scattering of tissue caused by cellular changes. Quantitative analysis was carried out using MATLAB software (2016b, Mathworks, Natick, MA, USA) and a program prepared by our research group; the fitting procedure is shown in Fig. 3. To evaluate the detection performance of the proposed method, analysis of variance was also used for intergroup comparison.

Results
Changes in the Average OCTSS and D1/e Values
The average OCTSS and D1/e values were derived from 20 OCT images for each group, i.e., the 6H and 12H groups as well as the control group. The two bruised groups had lower OCTSS values (Fig. 4A) but higher D1/e values (Fig. 4B) when compared with the control injury group (both p < 0.05), indicating significant differences between the bruised and unbruised fruits. In addition, the OCTSS value decreased and the D1/e value increased in the 12H group when compared with the 6H group, despite the fact that the difference was statistically insignificant between the two groups (P > 0.05). This indicated that the OCTSS value of the bruised tissues and the D1/e value showed certain degrees of change with increasing storage time.
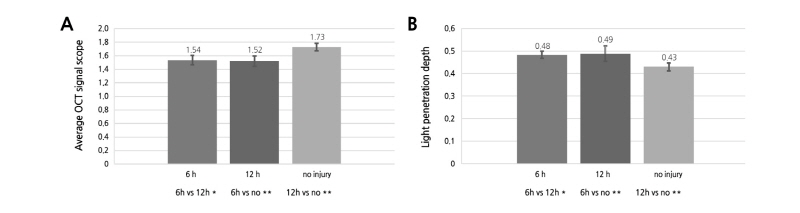
Fig. 4. Changes of average OCT signal scope (A) and light penetration depth (D1/e) (B) of unbruised and bruised samples at 6 and 12 h after impact. The values were obtained from 20 images of each group or time point. 6h, 6 h after impact; 12h, 12 h after impact; no, without any mechanical injury. Error bars indicate standard deviation. *, insignificant difference; **, significant difference at p < 0.05.
Change in the average  /
/ between bruised and unbruised pears
Similar to OCTSS and D1/e, the average  /
/ value varied among the three groups of pears (Fig. 5). When compared with the control group,
  /
/ was remarkably higher in the bruised pears at both 6 h and 12 h after impact (both p < 0.05). Moreover, it increased over time despite the fact that the difference was statistically insignificant between the 6H and 12H groups (P > 0.05). The difference in
  /
/ among the bruised and unbruised groups suggested that this parameter was closely correlated to the bruise severity and might be promising for pear bruise classification. Therefore, scatterplots of
  versus
  were used to further observe distribution differences among the three groups (Fig. 6). As Fig. 6 shows, a distinct separation was observed between unbruised and bruised fruit samples (both p < 0.05); nevertheless, it is worth noting there was a transition region of unknown/mixed tissues that requires attention in the detecting process. In addition, the difference among the bruised fruit tissues with different storage times was insignificant. Thus, both the
  versus
  distribution and the
  /
/ value might be sensitive to the microstructural change that occurs in mechanically impacted pear tissues, with the
  versus
  distribution demonstrating superior discrimination performance. Table 1 shows the result of analysis of variance by pairwise comparison of OCTSS, D1/e, and
  /
/ , where p < 0.05 was considered statistically significant.
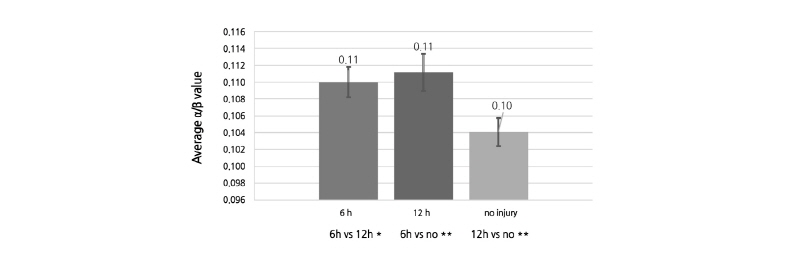
Fig. 5. Change of the average  /
/ of unbruised and bruised samples at 6 and 12 h after impact. The values were obtained from 20 images of each group or time point. 6h, 6 h after impact; 12h, 12 h after impact; no, without any mechanical injury. Error bars indicate standard deviation. *, insignificant difference; **, significant difference at p < 0.05.
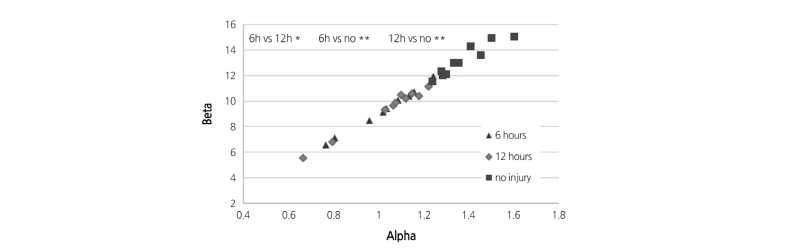
 versus
  plot of the unbruised and bruised samples at 6 and 12 h after impact. “no” indicates no injury; Alpha and Beta are the shaping and scaling index of profiles, respectively. *, insignificant difference; **, significant difference at p < 0.05.
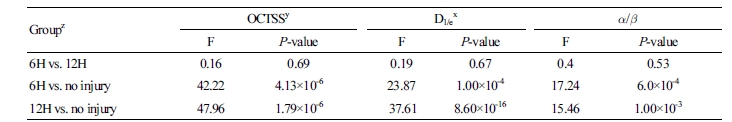
Discussion
In the present study, we attempted to identify a feasible and reliable method that could be used to detect the micro-changes related to early-stage bruises in pear fruit after mechanical injury. Garcı́a et al. (1995) reported that fruit damage could be detected using spectroscopy and hyperspectral imaging. However, spectroscopy only determines the overall spectral absorption of pear fruit tissue without any spatial information, and the related hyperspectral imaging obtains the spatially resolved information but lacks depth information. The depth information helps to identify the precise location of a bruise, which lays a foundation for further detailed classification. OCT scanning, which has been successfully applied in the medical field, can monitor morphological changes in tissue in vivo and might also be a potential tool for use with agricultural products, e.g., fruit damage detection. OCT technology offers the possibility to detect a bruise at a very early stage by quantifying visually invisible differences in fruit images.
Using a bruised pear model generated by intentional impact of a steel ball, four possible quantitative indicators for bruises in pear fruit, OCTSS, D1/e,  , and
, and  , were investigated in this study. Compared with the control tissue, OCTSS, D1/e ,
  /
/ , and the
  versus
  distribution all showed remarkable differences in the bruised pear tissues that could not be identified by visual observation.
When a steel ball impacts the fruit surface, the first direct consequence is an enlargement of the intercellular space. In the early stage after injury, the greater the intercellular space in the tissue, the more severe the tissue damage is from bruising (Yurtlu and Erdogan, 2005). External forces applied directly to the fruit surface may also deconstruct the cell membrane and disrupt the cell structure, resulting in cell death. Meanwhile, internal browning emerges over time as a result of a series of changes associated with cell death. First, chemical constituents (e.g., neutral sugars, uronic acid, pectin, and proteins) leak out from cells with damaged cell walls and flow into the intercellular space (Lin et al., 2002). The next stage is enzymatic oxidation following the direct contact of enzymes with the phenolic substances leaking out of vacuoles, resulting in oxidative damage and transforming phenolic substances into quinine. Quinine gradually accumulates and is polymerized into brown pigments (Franck et al., 2007). The main type of phenolic substance causing browning is chlorogenic acid. The speed of the transformation and browning process is affected by various factors, including oxygen content, concentration of phenolic substances, percentage of the cells damaged, and environmental conditions. Unfortunately, the bruise-associated chemical changes discussed above are not visible on the fruit surface at the early stage, making them difficult to detect by traditional methods. However, the leaked chemical constituents in the intercellular space can strongly absorb any light that penetrates the tissue. As a result, very little light is backscattered and captured by the light sensor of an OCT system, which offers the possibility of using OCT for early bruise detection. Consistently, our finding that D1/e showed the opposite trend to OCTSS in fruit tissue after injury suggested that bruised tissue reflected less light to the sensor from cell walls when compared with unbruised tissue.
Browning after injury is a chronic process that is difficult to detect and predict at an early stage of bruising. Currently, no sufficient evidence exists that elucidates the relationship between enzymatic oxidation and changes in optical property at different storage times after impact. Nevertheless, OCT imaging showed relatively satisfactory performance in discriminating between hidden bruised and unbruised tissues in this study.
Verboven et al. (2013) proved that OCT is an effective tool for nondestructively assessing the peel structure of apple fruit and that it performs more satisfactorily than microscopy and micro-CT in distinguishing different cultivars in terms of the structural properties of the peel. Using a mechanically impacted kiwifruit model, Li et al. (2015) found that visual inspection of OCT images reveals changes in subsurface cellular structure of kiwi that are closely related to fruit quality. Xu and Zhu (2008) found OCTSS and D1/e derived from OCT images were associated with early-stage cellular changes and might be promising indicators for the detection of early-stage injury in fruit. Water is the main light absorber in fruit tissue; light is diffused by water in intercellular space and reflected by cell walls in fruit tissue. In bruised tissue, breakage of the cells, which causes deconstruction of the cell wall and alters the intercellular water content, leads to a change in optical intensity and corresponding variation in OCTSS and D1/e in the impacted area in OCT images. In this study, the pixel intensity in the ROIs of the impacted pear samples was higher than in the control, indicating low water content in the bruised tissue. As shown in Fig. 4, the threshold values of OCTSS and D1/e could be used to differentiate the bruised from unbruised tissues even at an early stage. The qualitative analysis of pear OCT images for microstructural and chemical changes yielded consistent results, suggesting that the assessment performance of OCT was relatively stable.
The present study confirmed that OCT images could provide abundant information regarding the optical properties associated with water content and interactions related to enzymatic oxidation in fruit bruising. However, the mechanism underlying the bruise-related changes and the relationship between the changes and storage time after mechanical injury should be investigated further in the future. OCT imaging technology does not require any sample preprocessing and/or chemical treatment; thereby, it does not affect the commercial value of the scanned fruits. However, use of this technology might be limited by the high price of an OCT device, which costs approximately $50,000 and is only affordable for large companies. Our research team is seeking to develop a low-cost instrument that costs a few thousand dollars that can provide comparable performance with the industrial OCT system. The new instrument uses inexpensive components such as an uncooled super luminescent diode for the light source and micro-electromechanical system components for the scanner. We believe that, using this low-cost high-performance device, OCT may soon be a very useful technique in quantitative imaging of early-stage bruises in pear and other fruits. In addition, to significantly improve the reliability and stability of OCT in early bruise detection, we plan to develop a moving stage or scanning galvanometer to help focus on the surface of pear fruit and establish a classification model by further calibration with more bruised and unbruised samples.
