

Introduction
Materials and Methods
Test equipment and materials
Experimental design
Biomass determination
C content determination
N content determination
Total saponin determination
Data analysis and statistics
Results
Effects of elevated CO2 levels on P. japonicus biomass
Effects of different treatments on the C content of P. japonicus
Effects of different treatments on the N content of P. japonicus
Effects of different treatments on the C/N ratio of P. japonicus
Effects of different treatments on the total saponin content of P. japonicus
Correlation analysis of C and N balances affecting saponin accumulation in P. japonicus
C and N content and saponin accumulation in P. japonicus as affected by eCO2
Discussion
Conclusion
Introduction
Secondary metabolites are major medicinal constituents in medicinal herbs, and the quality and amounts of these metabolites are closely related to the quality of the medicinal herbs (Huang and Guo 2007). Nitrogen (N) is significantly related to secondary plant metabolite synthesis. The accumulation of saponins (C-based secondary metabolites) in Panax ginseng and Gynostemma pentaphyllum is reduced by excessive amounts of N (Meng et al. 1999; Long et al. 2008). The total phenolic (N-based secondary metabolite) amounts in the stems and leaves of Tetrastigma hemsleyanum increase consistently with a reduction of N (Fu et al. 2019). The C/N balance hypothesis postulates C-based secondary metabolite accumulation when N is limited and ginsenoside analogue (C-based secondary metabolite) accumulation is inhibited by excessive amounts of N (Huang and Guo 2007).
Elevated CO2 concentrations (eCO2) have become a significant concern in relation to climate change (Corwin 2021). CO2 concentrations are projected to exceed 550 µmol mol-1 by mid-century and 700 µmol mol-1 by the end of the century (Hatfield 2018). The effects of eCO2 on plant growth are manifested in various ways (Nie et al. 2015; Kellner et al. 2017; Jayawardena et al. 2019a). Plants grown under elevated atmospheric CO2 concentrations can experience significant changes in their histochemistry (Poorter et al. 1997; Loladze et al. 2002), with a common effect being reduced N concentrations (Taub and Wang 2008). The link between plant N levels and eCO2 has been studied extensively. Most studies have shown that eCO2 decreases the N concentration in plants, either due to N dilution caused by enhanced plant growth or through its impact on N uptake and metabolism (Stitt and Krapp 1999; Jayawardena et al. 2019b). In a loblolly pine (Pinus taeda) forest exposed to eCO2 (565 µmol mol-1) for five years, the carbon content in the soil organic matter of the forest floor increased by 32% (from 837 to 1106 g C m-2), which enhanced N sequestration and reduced soil N availability, leading to a decrease in the inorganic N concentration in the top 15 cm of the mineral soil (e.g., by approximately 20–30% based on trend data), which in turn reduced the N content in the plant tissues (Finzi and Schlesinger, 2003). The N concentrations of above-ground annual biomass production were decreased by eCO2 by 6%, 8%, and 12% in grassland, cropland and forest ecosystems, respectively (Feng et al. 2015). ECO2 increases the raw materials available for plant photosynthesis, promoting photosynthesis and consequently increasing the carbon (C) content of plants (Kirschbaum 2011). However, some studies also suggest that eCO2 reduces photosynthesis, thereby affecting carbohydrate accumulation (Bhargava and Mitra 2021). C and N are the two fundamental elements in plants, and their balance and content significantly influence plant growth and quality formation. ECO2 has differential effects on both the composition and balance of C and N (Luo et al. 2006). For example, Lotfiomran et al. (2016) demonstrated that in European beech (Fagus sylvatica) saplings under eCO2 and nutrient-limited conditions, the C/N ratio was increased by as much as 114%, the net photosynthesis rate was enhanced significantly, whereas the stomatal conductance was decreased by 20–30% and the leaf N concentration was reduced by 10%. Process-based modeling revealed changes in C/N leaf ratios in large portions of China due to increased nitrogen deposition (iNDEP), with eCO2 resulting in greater C/N leaf ratios in low iNDEP areas (Sheng et al. 2021). In a study focusing on temperate grassland areas, eCO2 (480 ppm) increased the above-ground biomass by 6.5% through enhanced C assimilation, which subsequently raised the C/N ratio and reduced the tissue N concentration, as observed in other FACE systems (Kellner et al. 2017).
Panax japonicus C. A. Meyer is a member of the ginseng family of plants (Araliaceae Juss.) and ranks among China’s most highly valued rare and endangered traditional Chinese medicinal herbs. Its medical constituents, saponins, i.e., secondary metabolites, are known to disperse blood stasis, arrest bleeding, suppress swelling, and allay pain (Chen et al. 2023). Secondary metabolites are also major active ingredients in medical herbs, and their concentration correlates with the quality of these herbs (Pant et al. 2021). Presently, P. japonicus research centers mainly on quality assessments as well as its chemical composition, pharmacological activity, and gene engineering-mediated regulation of its metabolism. Despite this, research on its cultivation physiology, especially under eCO2 conditions, remains limited. Given the impact of eCO2 on the C/N balance in plants and considering secondary metabolite accumulation in medical plants based on the C/N balance hypothesis, we investigated the impact of eCO2 on C and N concentrations, the C/N ratio, and saponin accumulation in P. japonicus. Additionally, we sought to elucidate the link between the C/N balance and saponin accumulation under eCO2 conditions.
Materials and Methods
Test equipment and materials
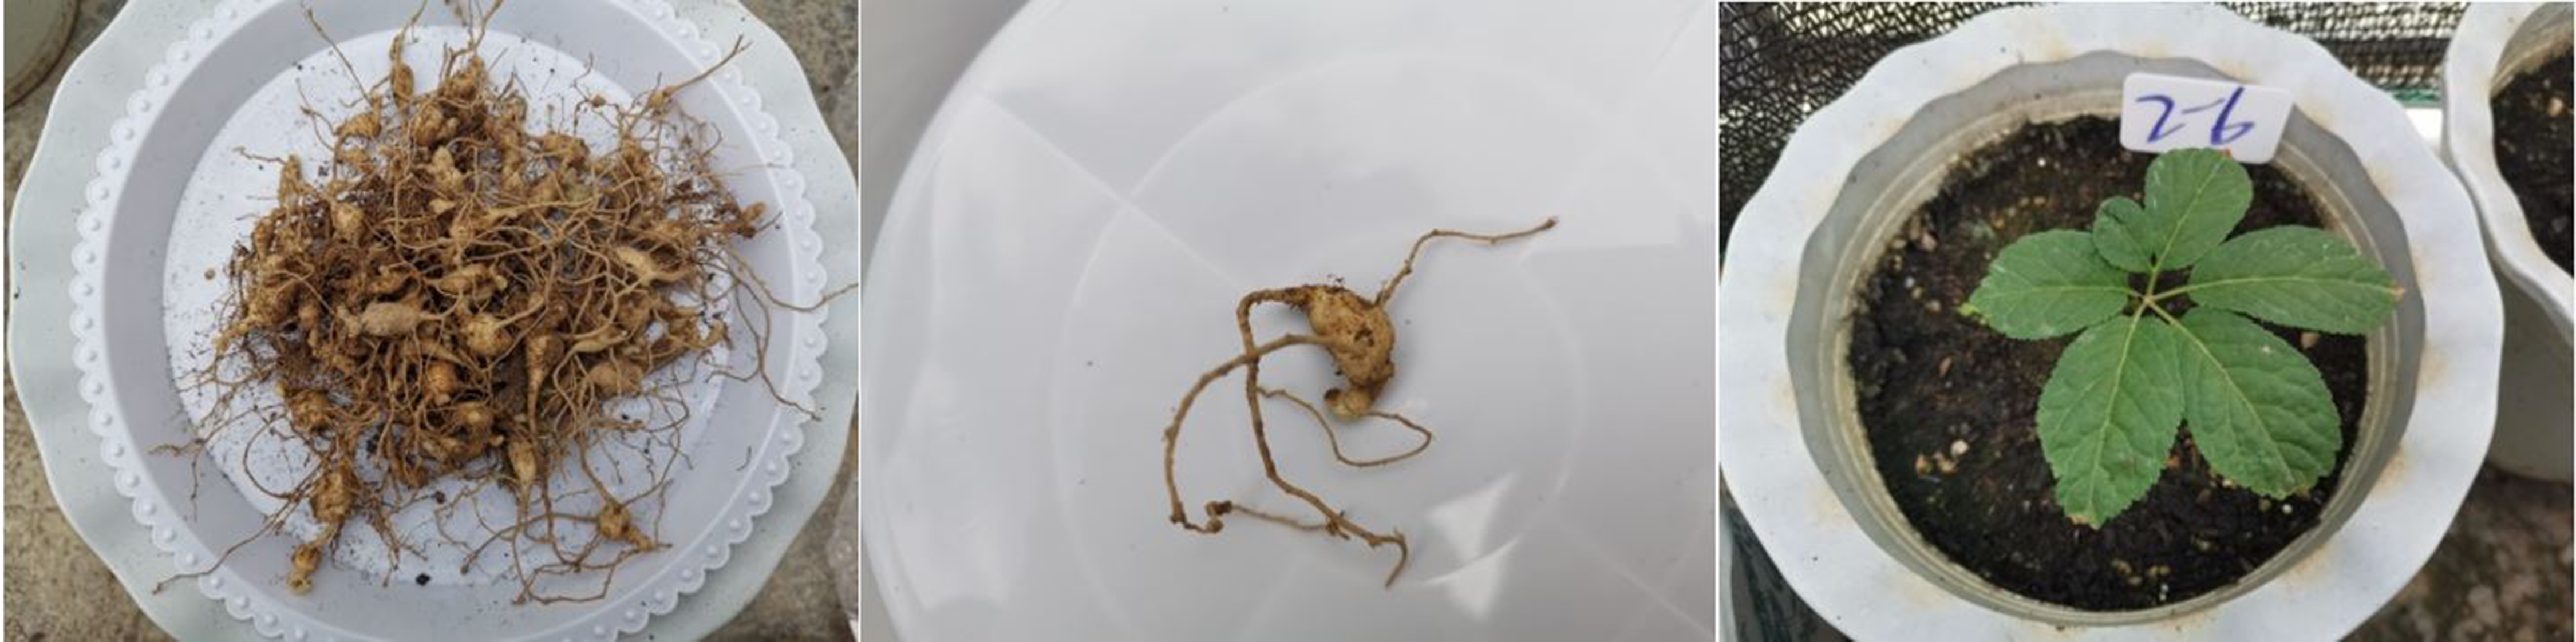
The simulator for eCO2 used in this experiment was an octagonal prismatic open-top gas chamber (Wang et al. 2020). The test material was the rhizome of two-year-old P. japonicus from Hubei Province. In November of 2022, rhizomes exhibiting consistent growth (average weight 1.37 ± 0.14 g) were selected and transplanted into plastic pots (diameter, 21 cm; height, 12 cm) containing 2.0 kg of air-dried potting soil (brown soil: nutrient soil = 1:1). The nutrient content of the soil was as follows: alkali N, 37.6 mg kg-1; available phosphorus, 8.4 mg kg-1; available potassium, 239.1 mg kg-1. After seedling emergence, uniform and vigorous seedlings were selected for experimental treatments (Fig. 1).
Experimental design
Three CO2 concentration treatments were established: ambient CO2 (aCO2, –410 µmol mol-1, control), moderate elevated CO2 (e1CO2, 550 ± 10 µmol mol-1), and high elevated CO2 (e2CO2, 750 ± 10 µmol mol-1) (Usuda 2006). The aCO2 treatment represented ambient conditions, while the e1CO2 and e2CO2 treatments were maintained in chambers supplied with CO2 at the respective target concentrations. Each treatment had three replicates, with 15 seedlings per replicate, resulting in 45 seedlings per treatment. During the experiment, the soil was manually watered using watering cans or hoses as needed to maintain consistent moisture levels across the treatments. Weeds were removed by hand (i.e., manually pulled) to minimize competition with the experimental plants. The experimental treatments began on 11 May 2023. At 27 and 84 days after treatment (DAT), five uniform seedlings were randomly selected from each treatment group to determine biomass levels. Fully expanded leaves, main stems, and medicinal rhizomes were collected from five randomly selected seedlings per treatment replicate (based on net photosynthetic rate outcomes) to determine the C, N, and saponin contents. During the test period, the average temperature in the OTC was 25.1°C, and the average humidity was 64.6%.
Biomass determination
Samples (leaves, stems, rhizomes) were placed in labeled paper envelopes and dried in a forced-air oven (DGT-G1000S, Darth Carter, China) at 105°C for 30 min and then dried at 70°C until a constant weight was achieved. The dry weights of the samples were measured using the same analytical balance after confirming no further weight loss.
C content determination
The total C content in the plant samples was determined using a commercial photometric assay kit (Suzhou Keming Biologicals, China). Briefly, fresh or dried plant tissue was ground, and an appropriate amount of sample was digested or processed according to the manufacturer’s protocol to release C components. The released C was then reacted with a specific chromogenic reagent to form a colored complex. Ferrous sulfate was used to prepare a series of standard solutions with known C concentrations, which were used to generate a standard curve. The absorbance of the reaction mixture was measured colorimetrically at 585 nm using a microplate reader (SpectraMax M2, Molecular Devices, USA; Cai et al. 2011).
N content determination
The total N content was determined by the Kjeldahl method using an automatic Kjeldahl nitrogen analyzer (Kjeltec TM 8400, Foss, Sweden) following the procedure of Bao (2005). Leaf samples were digested with concentrated sulfuric acid (H2SO4) in the presence of a catalyst, and the resulting ammonium was distilled and titrated with standard acid to quantify total N. The nitrogen content was calculated based on the titration volume and expressed on a dry weight basis.
Total saponin determination
The total saponin content was determined by a vanillin-perchloric acid colorimetric method. Dried plant samples were extracted with 70% ethanol by means of an ultrasonic treatment. The extract was centrifuged, and the supernatant was reacted with vanillin and perchloric acid under heating. The absorbance was measured at 589 nm using a microplate reader (SpectraMax M2, Molecular Devices, USA), and the total saponin content was calculated from a standard curve. The assay was performed using a commercial color development kit (Suzhou Keming Biologicals, China), following the procedure described by Chen et al. (2022).
Data analysis and statistics
Data were analyzed using SPSS 22.0 (IBM Corp., Armonk, NY, USA) for analysis of variance (ANOVA), Tukey’s significant difference test, and Spearman’s correlation analysis.
Results
Effects of elevated CO2 levels on P. japonicus biomass
A short-term (27 DAT) increase in the CO2 concentration had no significant effect on the biomass of P. japonicus (Fig. 2). However, the total biomass values of P. japonicus subjected to a long-term (84 DAT) moderate increase (e1CO2 treatment) in the CO2 concentration were significantly higher (15.21%) than those of the control seedlings (aCO2 treatment). In contrast, the total biomass values of P. japonicus subjected to a substantial increase in the CO2 concentration (e2CO2 treatment) showed no significant change compared to the control seedlings (Fig. 2).
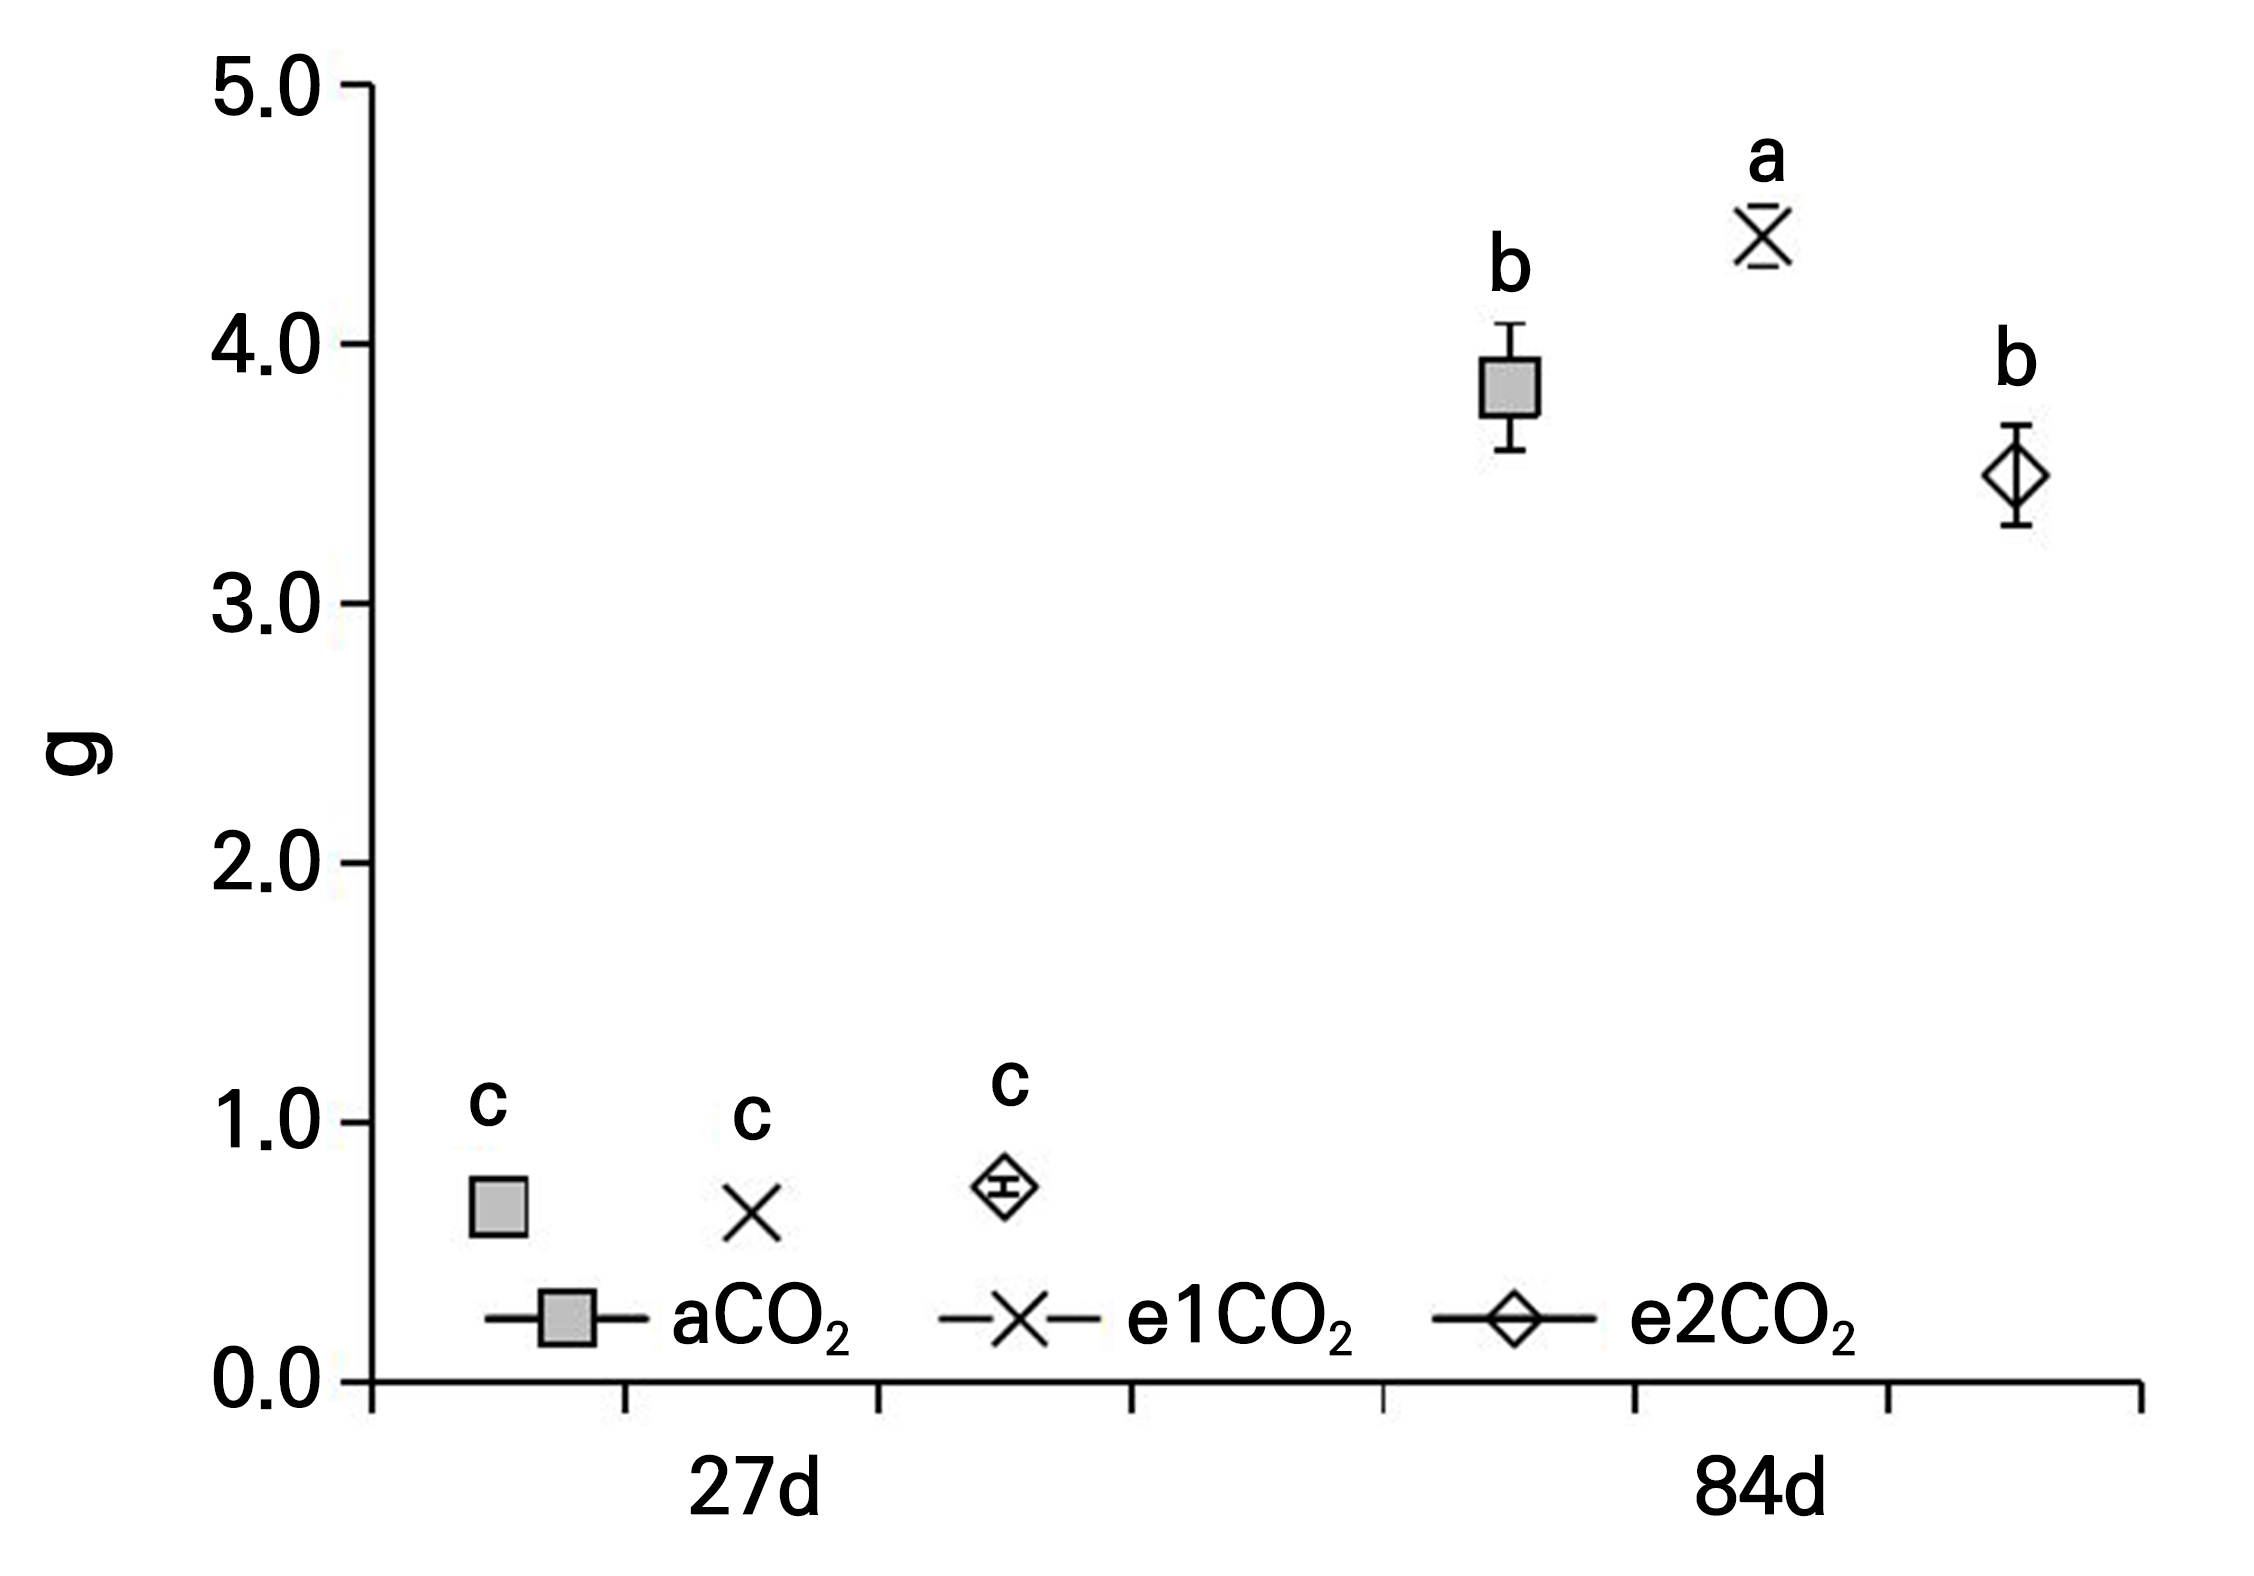
Fig. 2.
Biomass of P. japonicus grown under ambient CO2 (aCO2) or elevated CO2 (e1CO2, 550 ± 10 µmol mol-1; e2CO2, 750 ± 10 µmol mol-1) concentrations. Data points represent the means ± the SD; n = 5. Data points with different lowercase letters are significantly different (p < 0.05) according to Tukey’s test.
Effects of different treatments on the C content of P. japonicus
At 27 DAT, no significant effects of eCO2 were observed on the overall C content in the leaves, stems, or rhizomes of P. japonicus (Fig. 3). At 84 DAT, the eCO2 treatments had no significant effect on the C content of leaves and stems (Fig. 3A and 3B). However, the e1CO2 treatment increased the C content of the rhizomes by 7.70% compared to the controls, while the e2CO2 treatment did not affect the C content of the rhizomes (Fig. 3C).
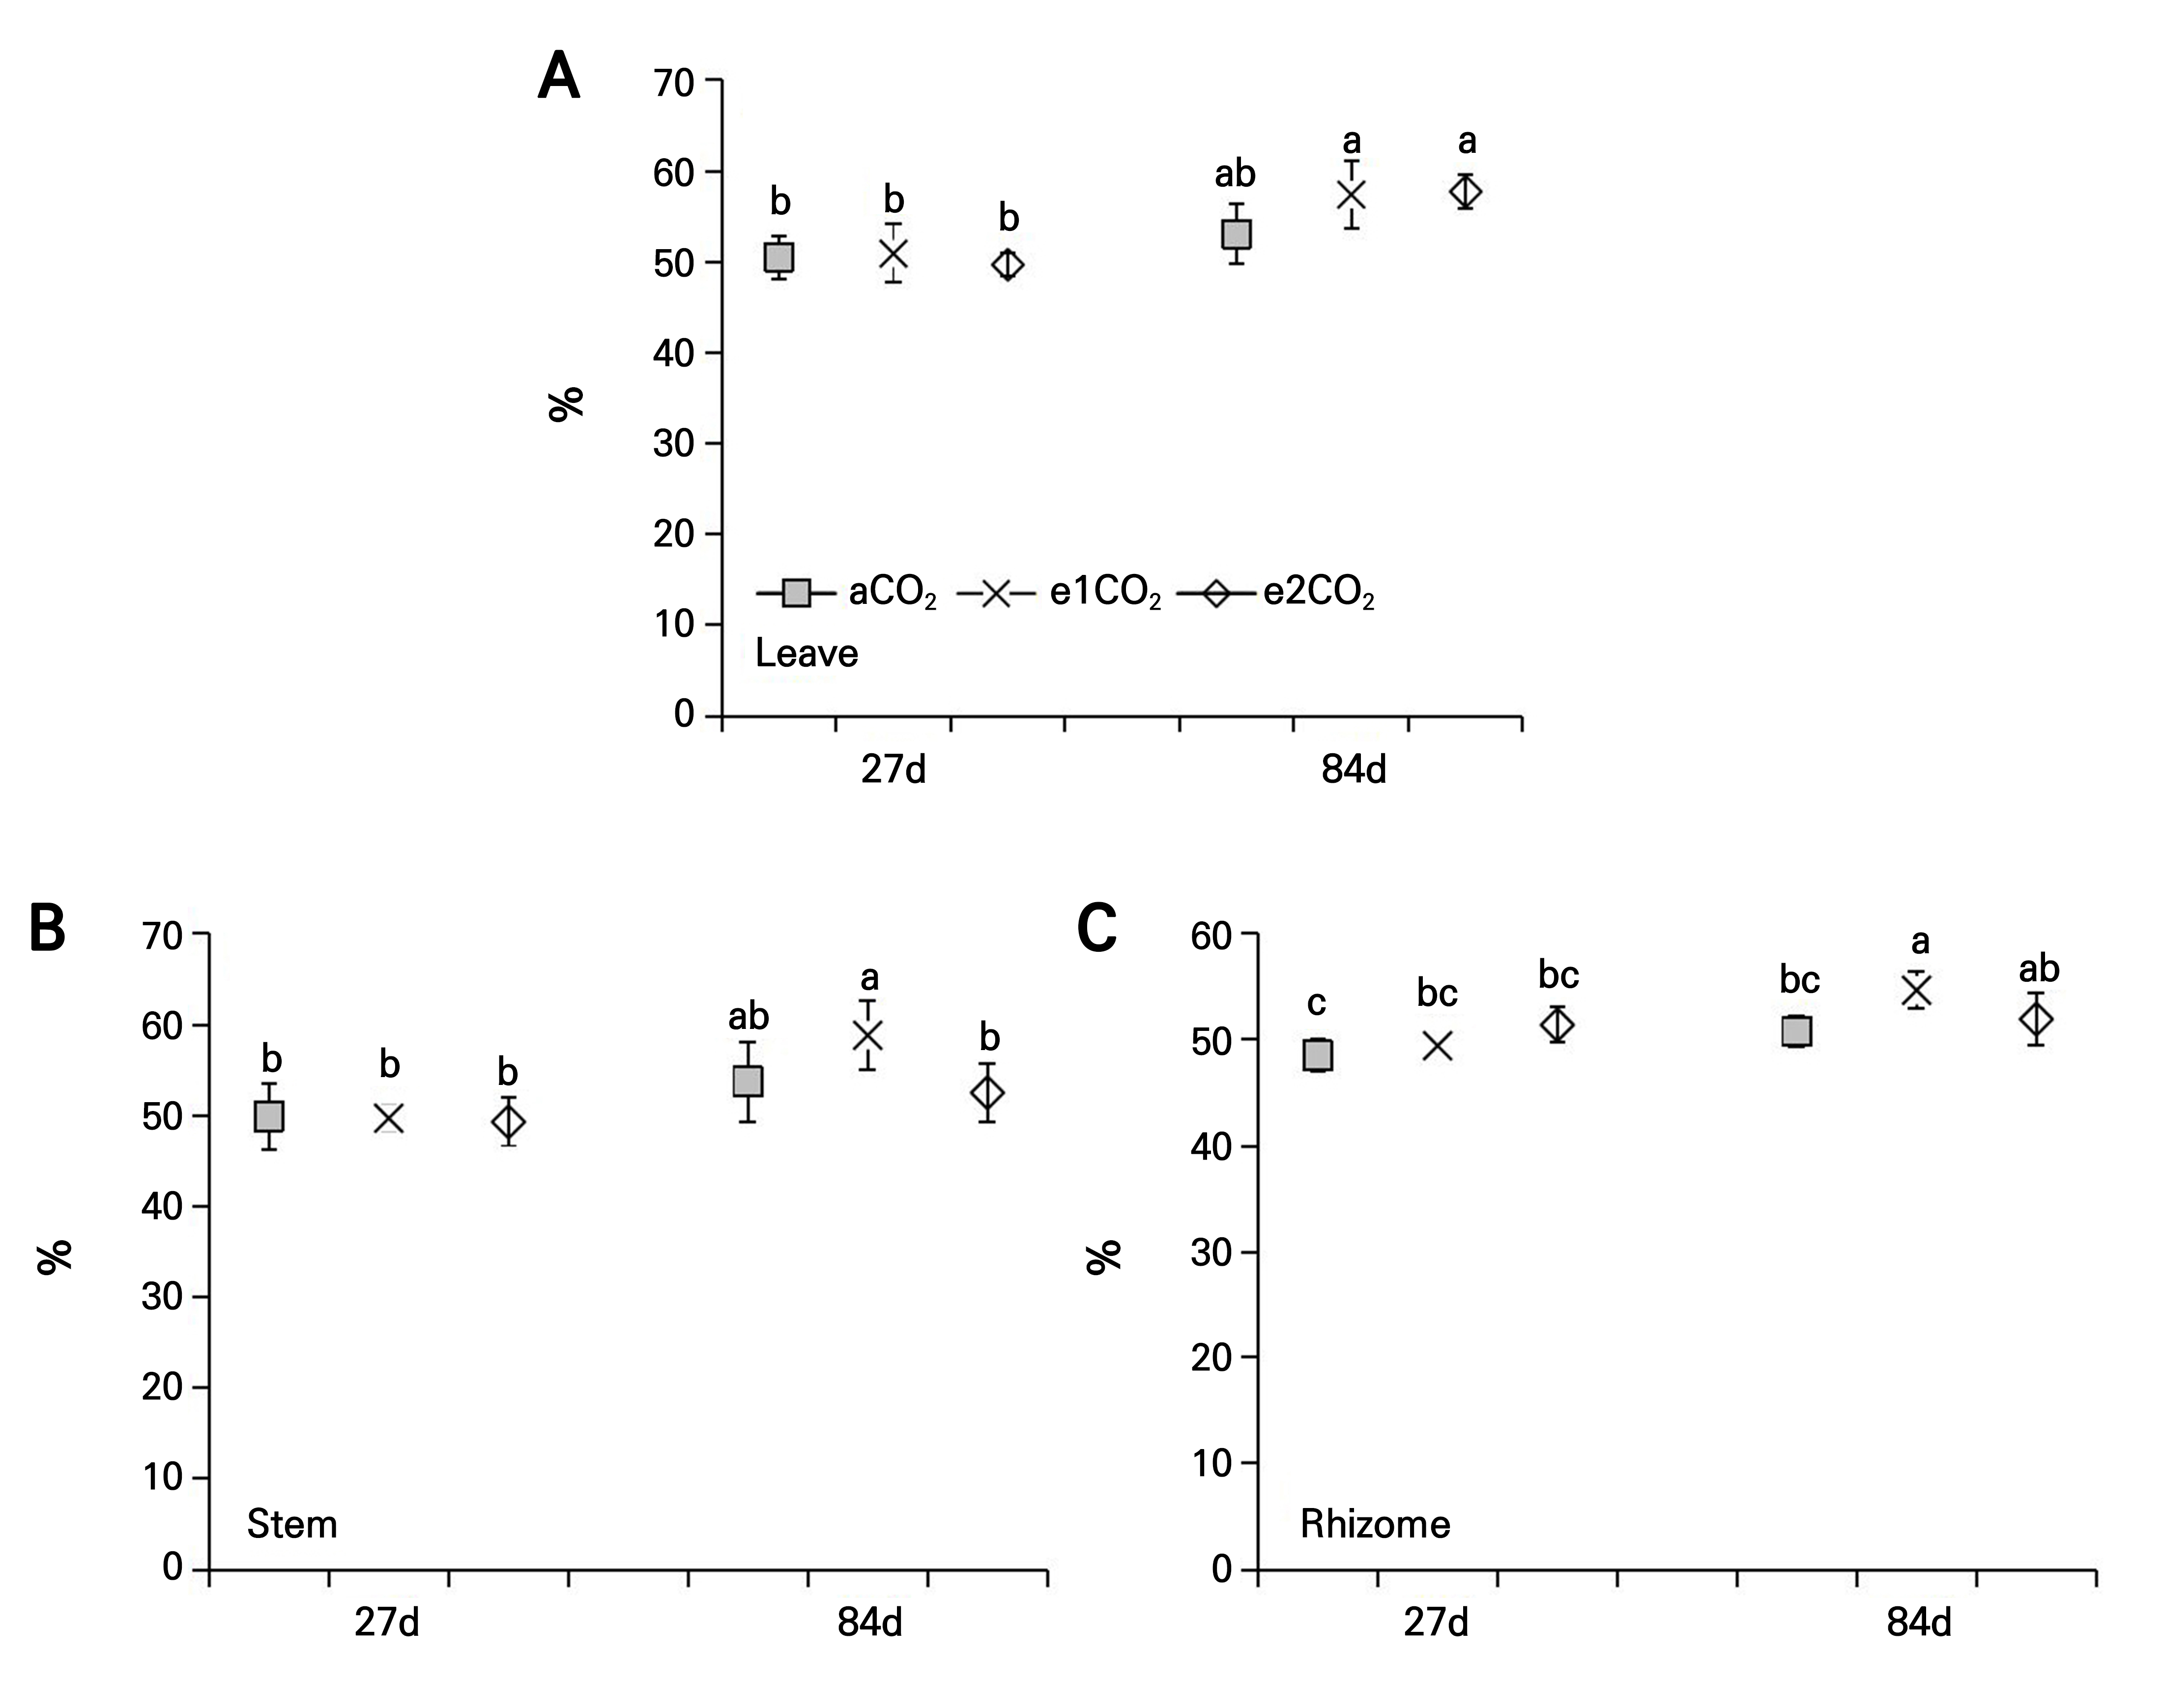
Fig. 3.
C content of P. japonicus grown under ambient CO2 (aCO2) or elevated CO2 (e1CO2, 550 ± 10 µmol mol-1; e2CO2, 750 ± 10 µmol mol-1) concentrations: (A) leaf C content; (B) stem C content; (C) rhizome C content. Data points represent the means ± the SD; n = 5. Data points with different lowercase letters are significantly different (p < 0.05) according to Tukey’s test.
Effects of different treatments on the N content of P. japonicus
The various eCO2 treatments had no impact on the N content in the leaves and stems of P. japonicus at 27 DAT (Fig. 4A and 4B). The e1CO2 treatment significantly increased the rhizome N content by 19.29% over the controls at 27 DAT (Fig. 4C). The e1CO2 and e2CO2 treatments significantly reduced the N content in leaves by 12.03% and 19.84%, respectively, compared to the controls at 84 DAT (Fig. 4A). The e1CO2 treatment reduced the N content in the stems and rhizomes by 16.82% and 18.24%, respectively, compared to the controls at 84d (Fig. 4B and 4C).
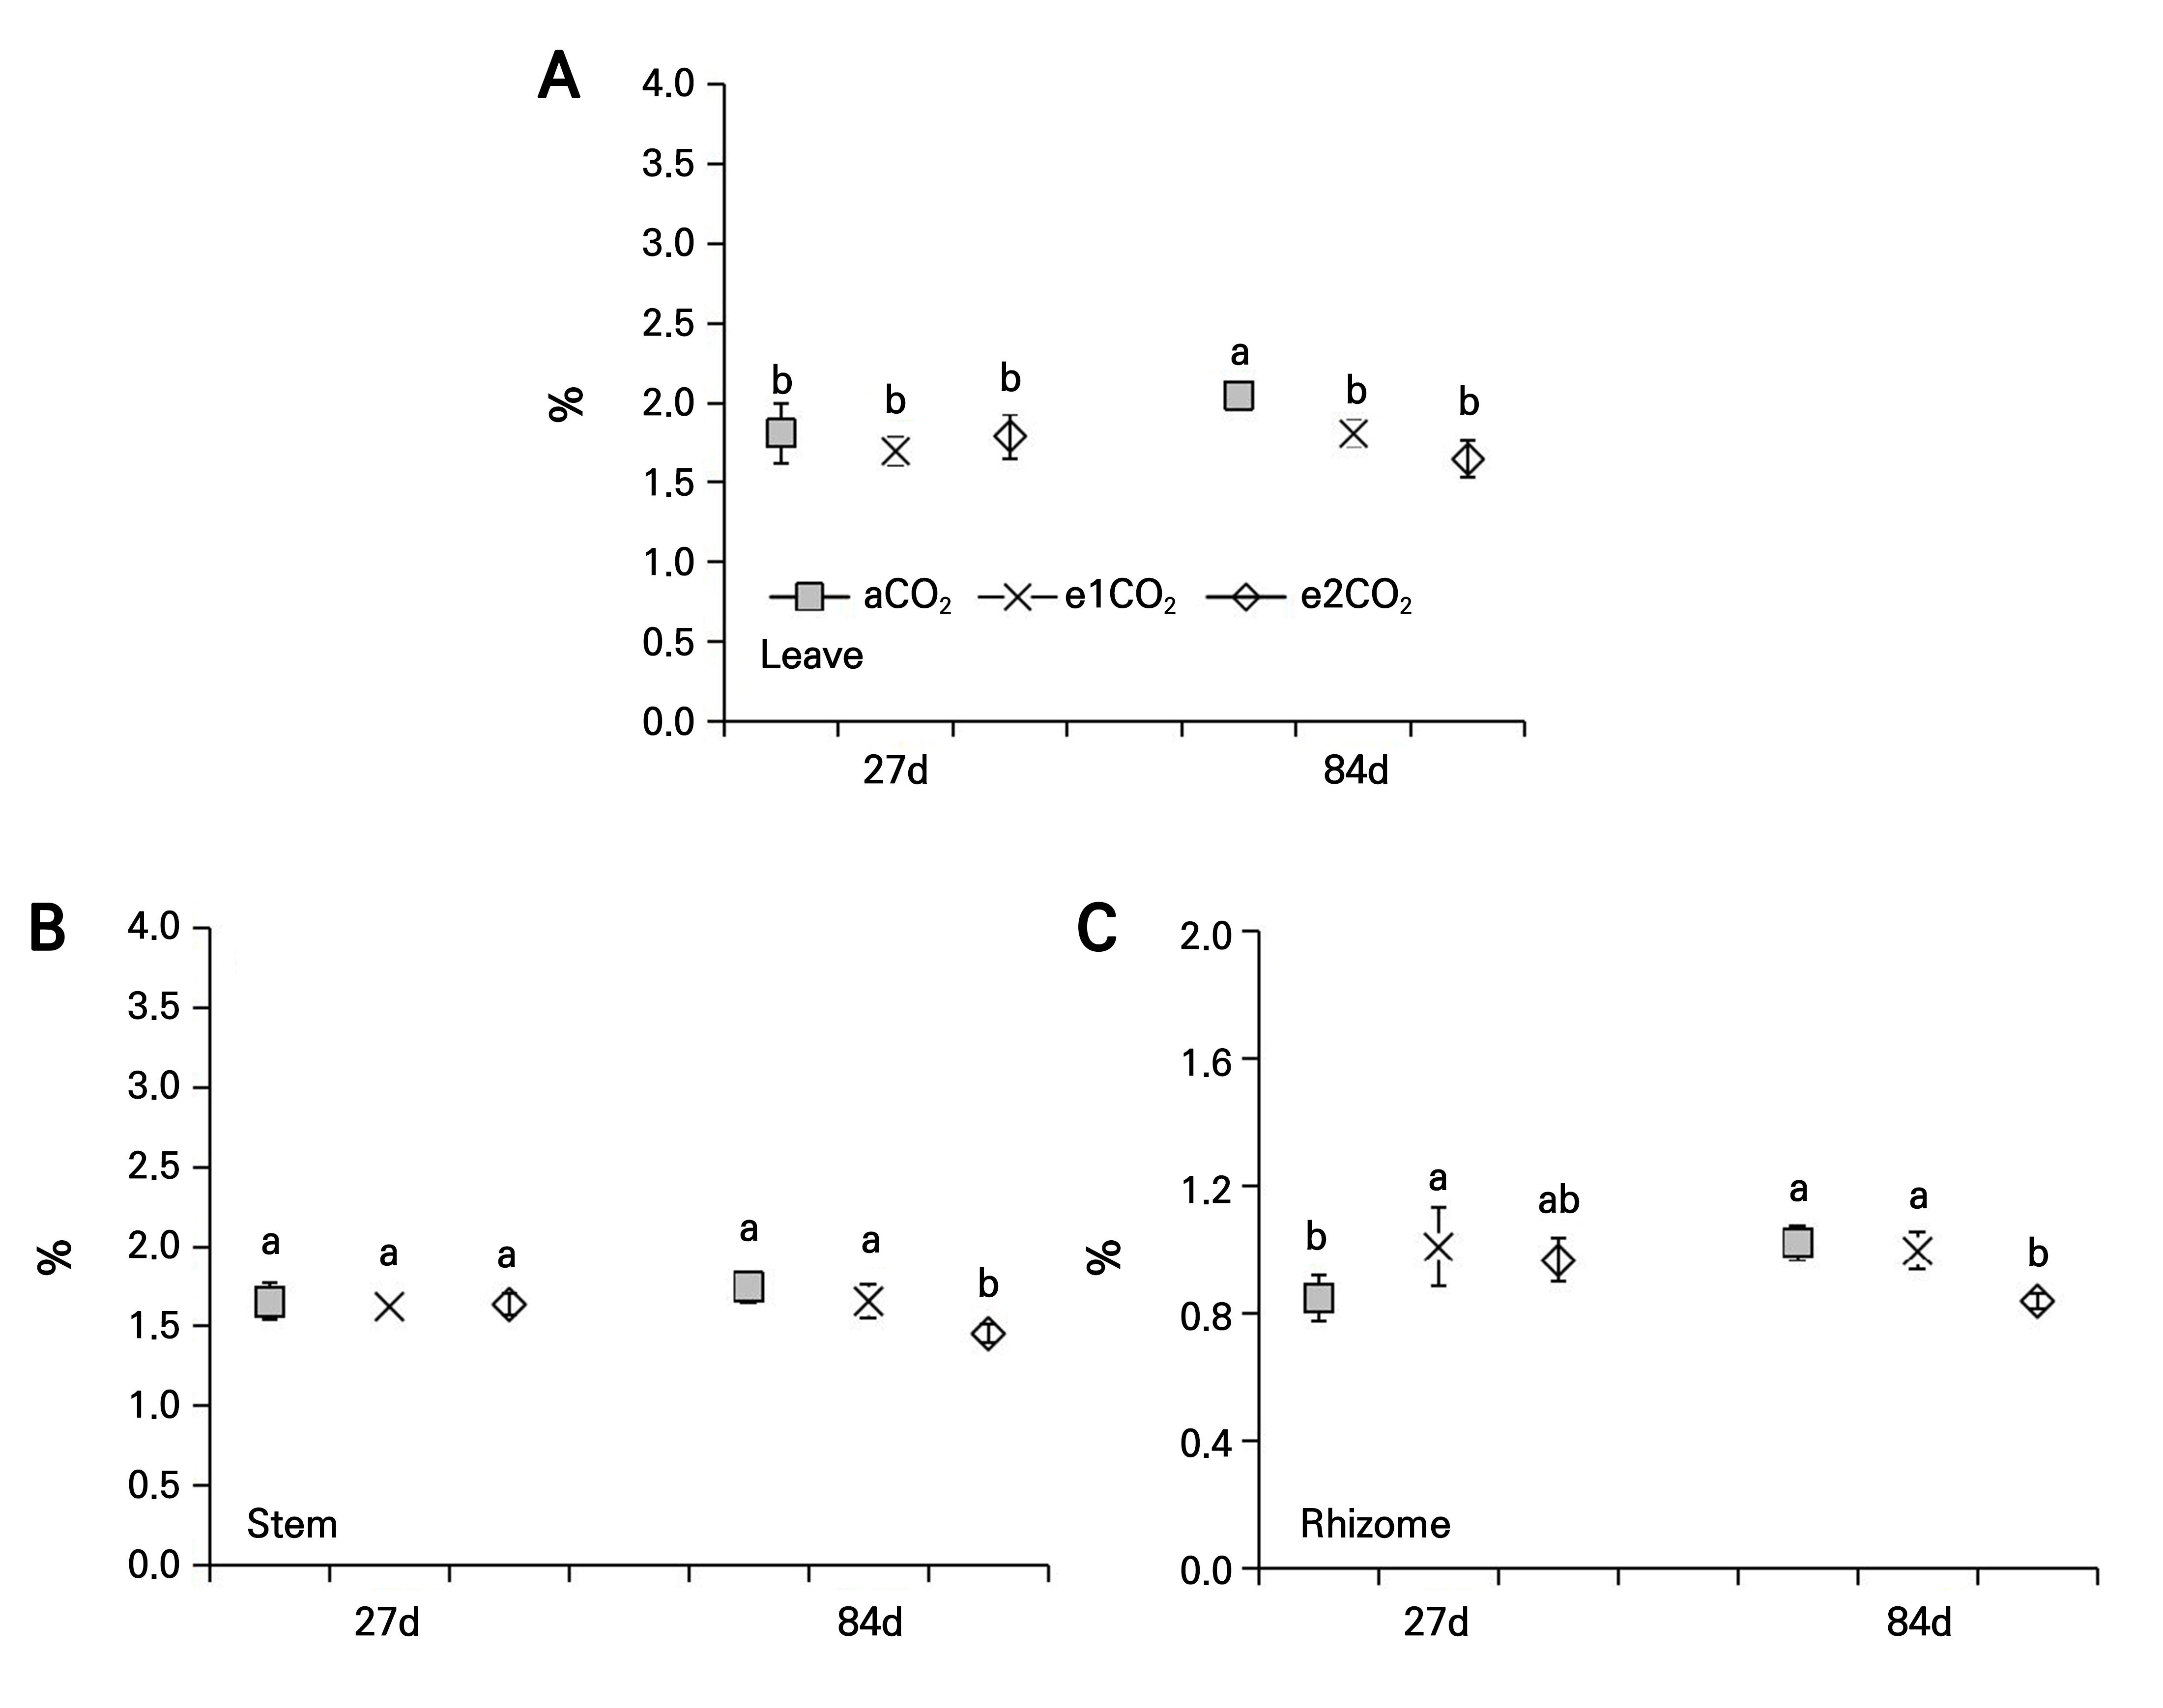
Fig. 4.
N content of P. japonicus grown under ambient CO2 (aCO2) or elevated CO2 (e1CO2, 550 ± 10 µmol mol-1; e2CO2, 750 ± 10 µmol mol-1) concentrations: (A) leaf N content; (B) stem N content; (C) rhizome N content. Data points represent the means ± the SD; n = 5. Data points with different lowercase letters are significantly different (p < 0.05) according to Tukey’s test.
Effects of different treatments on the C/N ratio of P. japonicus
No considerable effects on the C/N ratio were noted in the leaves, stems, and rhizomes of P. japonicus under the different eCO2 treatments at 27 DAT (Fig. 5). At 84 DAT, the C/N ratio under the e1CO2 treatment was significantly higher in the leaves by 24.25% and in the stems by 15.38% compared to the controls, whereas the C/N ratio under the e2CO2 treatment was significantly higher by 43.66% and 17.38% in the leaves and stems, respectively, as compared to the controls (Fig. 5A and 5B). The C/N ratio of the e1CO2 treatment was found not to significantly affect the rhizomes, but the e2CO2 treatment increased the C/N ratio of the rhizomes by 25.07% as compared to the controls at 84 DAT (Fig. 5C).
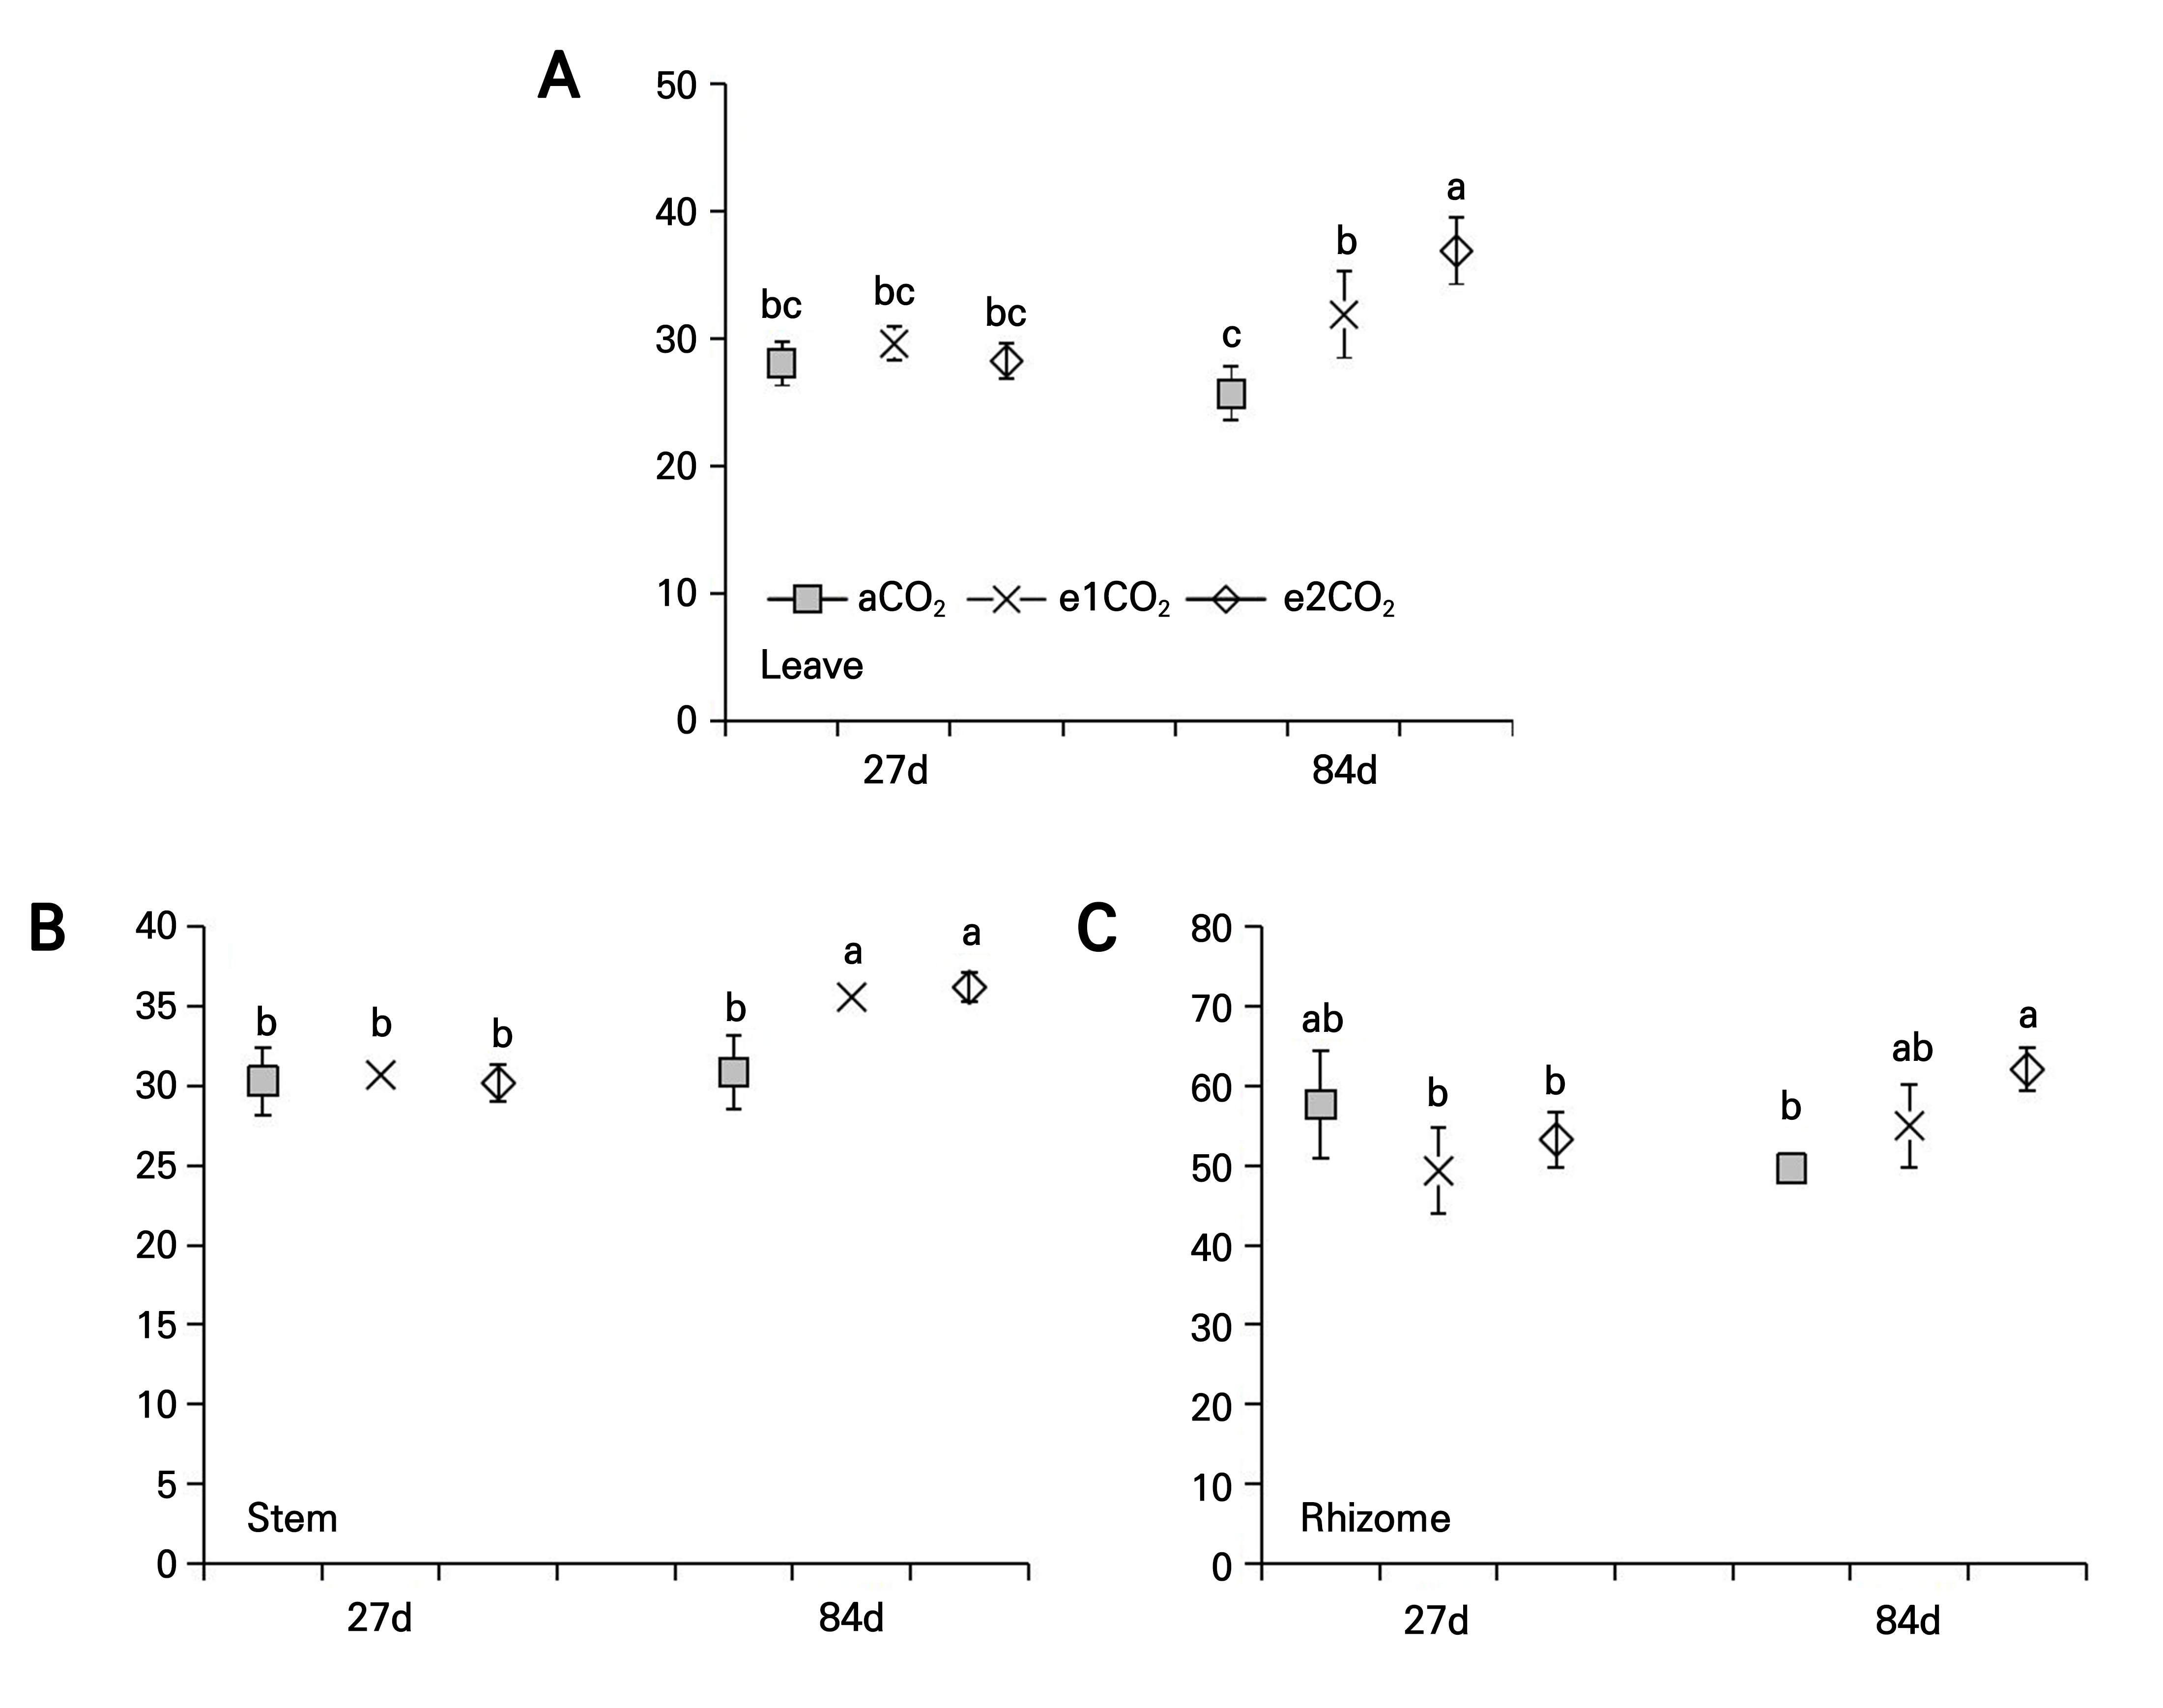
Fig. 5.
C/N ratio of P. japonicus grown under ambient CO2 (aCO2) or elevated CO2 (e1CO2, 550 ± 10 µmol mol-1; e2CO2, 750 ± 10 µmol mol-1) concentrations: (A) leaf C/N ratio; (B) stem C/N ratio; (C) rhizome C/N ratio. Data points represent the means ± the SD; n = 5. Data points with different lowercase letters are significantly different (p < 0.05) according to Tukey’s test.
Effects of different treatments on the total saponin content of P. japonicus
At 27 DAT, the different magnitudes of the eCO2 treatment had no significant effect on the total saponin content in the leaves of P. japonicus (Fig. 6A). The e1CO2 treatment did not affect the total saponin content in the stems and rhizomes, while the e2CO2 treatment significantly increased the total saponin content in the stems (29.90%) and rhizomes (27.50%) compared to the controls at 27 DAT (Fig. 6B and 6C). At 84 DAT, the e1CO2 treatment significantly increased the total saponin content in the leaves, stems, and rhizomes by 29.09%, 39.50%, and 17.45%, respectively, compared to the controls (Fig. 6). The e2CO2 treatment significantly increased the total saponin content in the leaves, stems, and rhizomes by 69.51%, 78.36%, and 24.04%, respectively, compared to the controls at 84 DAT (Fig. 6).
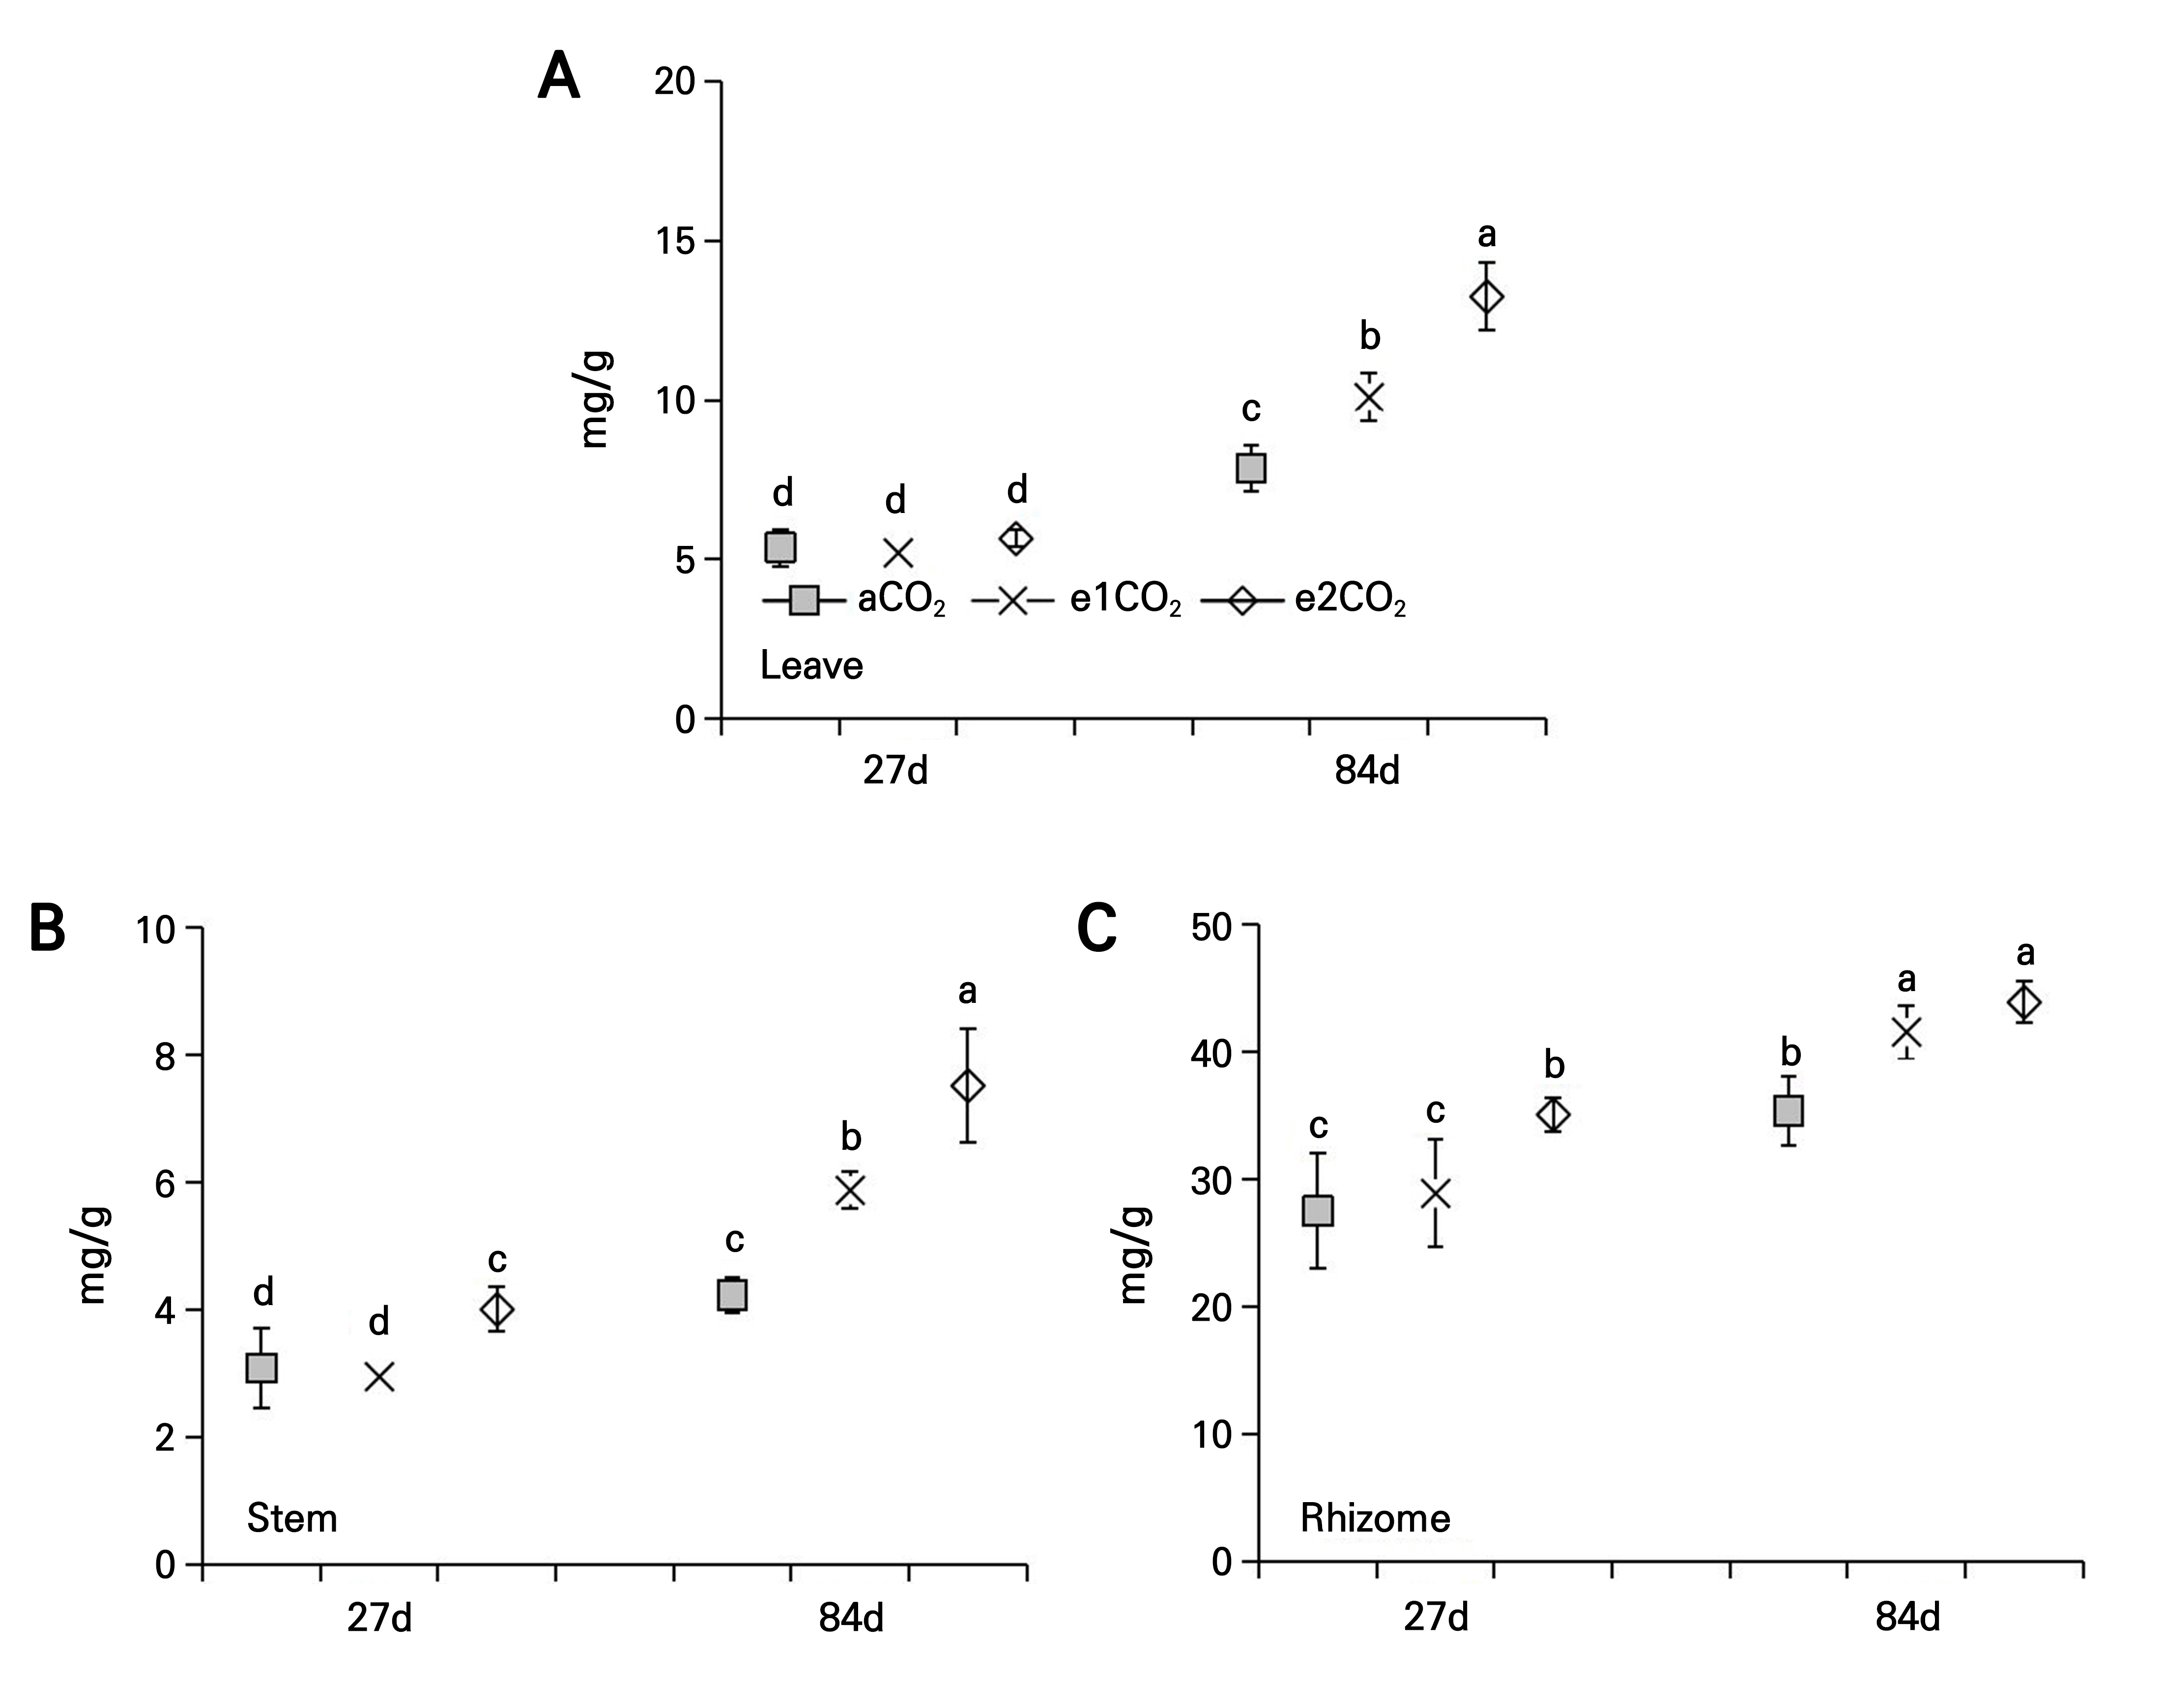
Fig. 6.
Total saponin content of P. japonicus grown under ambient CO2 (aCO2) or elevated CO2 (e1CO2, 550 ± 10 µmol mol-1; e2CO2, 750 ± 10 µmol mol-1) concentrations: (A) leaf total saponin content; (B) stem total saponin content; (C) rhizome total saponin content. Data points represent the means ± the SD; n = 5. Data points with different lowercase letters are significantly different (p < 0.05) according to Tukey’s test.
Correlation analysis of C and N balances affecting saponin accumulation in P. japonicus
The correlation analysis between the C and N contents, their ratios, and saponin accumulation in P. japonicus revealed that the total saponin contents of the leaves and rhizomes were positively correlated with the C content, the total saponin contents of the leaves and stems were significantly positively correlated with the N content, and the total saponin contents in various parts of P. japonicus were positively correlated with the C/N ratio (Table 1).
Table 1.
Correlation analysis of the C and N contents and ratios with saponin accumulation in P. japonicus
Values represent the means ± SE; n = 5. *, p < 0.05; **, p < 0.01; ***, p < 0.001; ns, not significant. LC: leaf carbon content; SC: stem carbon content; RC: rhizome carbon content; LN: leaf nitrogen content; SN: stem nitrogen content; RN: rhizome nitrogen content; LC/N: leaf carbon/nitrogen ratio; SC/N: stem carbon/nitrogen ratio; RC/N: rhizome carbon/nitrogen ratio; LS: leaf total saponin content; SS: stem total saponin content; RS: rhizome total saponin content.
C and N content and saponin accumulation in P. japonicus as affected by eCO2
An ANOVA revealed that the duration and magnitude of the eCO2 treatments significantly affected the C content in different parts of P. japonicus, also affecting the total saponin content and the C/N ratios of the leaves and stems (Table 2). The interaction between the treatment duration and CO2 magnitude also significantly impacted the C/N ratios of different plant parts, the N content in the stems and rhizomes, and the total saponin content (Table 2).
Table 2.
Analysis of variance of the C and N contents and saponin accumulation in P. japonicus as affected by eCO2
| LC | SC | RC | LN | SN | RN | LC/N | SC/N | RC/N | LS | SS | RS | |
| Term (T) | ** | ** | ** | ns | ns | ns | * | *** | ns | *** | *** | *** |
| CO2 (C) | * | ns | ns | * | * | ns | ** | *** | ns | *** | *** | ** |
| T*C | ns | ns | ns | ns | * | * | ** | ** | ** | *** | ** | ns |
Values represent the means ± the SE; n = 5. *, p < 0.05; **, p < 0.01; ***, p < 0.001; ns, not significant. ANOVA factors: Term level (T): short term (27d) and long term (84d); CO2 level (C): ambient CO2 (aCO2) and eCO2 (e1CO2, e2CO2). LC: leaf carbon content; SC: stem carbon content; RC: rhizome carbon content; LN: leaf nitrogen content; SN: stem nitrogen content; RN: rhizome nitrogen content; LC/N: leaf carbon/nitrogen ratio; SC/N: stem carbon/nitrogen ratio; RC/N: rhizome carbon/nitrogen ratio; LS: leaf total saponin content; SS: stem total saponin content; RS: rhizome total saponin content.
Discussion
N plays a crucial role in plant growth under eCO2 (Yang et al. 2006). In this study, the e2CO2 treatment for 84 days significantly reduced the N content in various parts of P. japonicus seedlings. The decrease in the N concentration can either result from eCO2 interfering with N uptake or may be due to increased plant growth, where the N concentration becomes diluted (Jayawardena et al. 2019b). Given that CO2 acts as a raw material for photosynthesis in plants, when its concentration increases, it enhances carbohydrate generation in plants, increasing the C composition inside the plants (Leakey et al. 2009). The impact is not fixed, as an increase in CO2 may also disturb N uptake, upsetting C and N interrelations in terms of metabolism and carbohydrate production and hence reducing the C composition (Ben Mariem et al. 2021). The eCO2 impact on the C composition in various parts of P. japonicus was noted in this study with an elevated C composition of the rhizomes under the e1CO2 treatment after 84 days. There were no improvements noted in the other treatment effects with regard to the C composition in various parts of P. japonicus, implying that the eCO2 impact on the C composition can depend on performance in terms of biomass. The impact of eCO2 on C and N metabolism may play a critical role in changes occurring in the C and N composition (Wang et al. 2020). The experiment here was conducted under one elevated CO2 concentration and lasted only 84 days. Longer-term or multi-level CO2 treatments and extended growth periods could reveal different adaptive or compensatory responses.
C and N metabolism are closely interlinked. The C/N ratio reflects an important aspect of the C and N balance in plants, with this balance being crucial to achieving maximum growth in plants (Hu et al. 2021). The impact of eCO2 on the C/N ratio in leaf tissue can either increase, decrease, or show no change (Gifford et al. 2000). The C/N ratios in nine perennial plants increased by a mean of 7% under eCO2 conditions due to a decrease in the leaf N concentration by a mean of 10% (Inauen et al. 2012). The C/N ratio in Quercus gilva was found to increase under eCO2 and high temperature conditions due to a decrease in the N concentration (Kim and You 2012). In this study, varying increases in the CO2 concentration and growth duration induced either neutral or significant increases in the C/N ratio of P. japonicus organs—changes tightly correlated with alterations in the N concentration (Figs. 4 and 5). Specifically, short-term eCO2 exposure left the leaf C/N balance largely intact, whereas long-term high eCO2 (750 µmol mol-1) exposure drove marked C/N ratio elevations in the leaves, stems and rhizomes, driven by concurrent N depletion. Physiologically, these observations align with the mechanism whereby eCO2 levels modulate the plant C/N ratio by influencing either photorespiration rates or chloroplastic CO2 concentrations (Wujeska-Klause et al. 2019).
Secondary metabolism is intricately connected to primary metabolism through the rates at which substrates are diverted from primary pathways and redirected into secondary biosynthetic routes (Ibrahim and Jaafar 2011). In plants, eCO2 alters plant sugar metabolism, and the synchrony between sugar metabolism and secondary metabolite synthesis finds additional support from analyses conducted at both the transcriptomic and metabolic levels under eCO2 conditions (Wedow et al. 2019). These findings underscore the critical role of sugar metabolism in mediating shifts in plant secondary metabolism in response to environmental changes. N nutrition plays an important role as an environmental factor impacting secondary metabolite synthesis and accumulation in medicinal plants. Satisfactory levels of N facilitate secondary metabolic biosynthesis of Chrysanthemum morifolium (Li et al. 2015). Increased N enhances alkaloid synthesis in Atropa bella-donna (Khan and Harborne 1990), whereas N starvation may facilitate saponin synthesis and accumulation in Gynostemma pentaphyllum (Long et al. 2008). Low nitrogen usually leads to the accumulation of secondary metabolites, including phenylketones and flavonoids (Cipollini et al. 2002; Lou et al. 2004). Work by Zhu et al. (2018) concluded that negative effects induced by eCO2 were observed in the plant protein and chlorophyll contents and in several mineral nutrient levels. These effects are mainly attributable to the dilution effect generated by growth promotion. However, this also indicates that the benefits of eCO2 for plant secondary metabolism outweigh the dilution effect. It was found in research on two-year-old Panax notoginseng that when the application of N reached a certain level, photosynthetic C metabolism decreased, root N absorption decreased, and excessive N was allocated to the ground, resulting in a reduction of the C/N ratio and the hindrance of saponin synthesis and accumulation (Cun et al. 2020). N availability was not manipulated or varied in this study, despite the fact that it is a well-documented modulator of both primary metabolism and secondary metabolite biosynthesis under eCO2. Different N levels could lead to divergent outcomes in C/N ratios and saponin accumulation.
The C/N ratio has been identified as a crucial indicator in evaluations of how carbon is allocated between primary and secondary metabolism (Royer et al. 2013). In P. japonicus, saponins are the primary medicinal constituents, directly determining the plant’s pharmacological efficacy and economic value (Matt et al. 2001). Our study provides empirical evidence that eCO2 (550 and 750 µmol mol-1) and extended exposure durations (27 vs. 84 days) significantly modulate the C/N balance, thereby influencing saponin accumulation in this medicinal plant. These findings are visually supported by Figs. 5 and 6, which summarize the total saponin content in the leaves, stems, and rhizomes (the main medicinal organs), showing it to be consistently higher under both the e1CO2 and e2CO2 treatments lasting 84 days compared to the controls. This aligns with the C/N balance hypothesis proposed by Huang and Guo (2007), which posits that a higher C/N ratio favors the biosynthesis of C-based secondary metabolites (e.g., saponins) by reducing competition for carbon resources between growth and secondary metabolism. Consistently, we found a strong positive correlation between the saponin content and C/N ratio across all organs (Table 1), further validating that the observed saponin enhancement is mechanistically linked to C/N allocation shifts. These results, visualized in Table 1, support the C/N balance hypothesis (Huang and Guo 2007) by demonstrating that C/N allocation shifts consistently predict saponin accumulation. The biosynthetic pathway of saponins (primarily triterpenoids) relies on the mevalonic acid and methylerythritol phosphate pathways, which utilize carbon skeletons but do not directly compete with N-dependent growth processes (Bustamante et al. 2020). Elevated CO2 typically increases carbon assimilation (via enhanced photosynthesis) while potentially altering nitrogen uptake/utilization, leading to an elevated C/N ratio. In our study, the increased C/N ratios (particularly in rhizomes under e2CO2 for 84 days, with a 25.07% rise) created a favorable metabolic environment for saponin biosynthesis by prioritizing carbon flux toward secondary metabolism. This is directly supported by Figs. 5 and 6, which plot the C/N ratios and saponin contents across the treatments. The regulation of saponin biosynthesis involves transcription factors (AP2/ERF, MYB, bHLH, WRKY) and key enzyme genes (e.g., dammarenediol synthase), whose expression is sensitive to nitrogen availability (Qiu et al. 2025). Altered N assimilation under eCO2 (manifested as a reduced N content in the stems and rhizomes under e1CO2 and across all organs under e2CO2) likely influenced the activity of these regulatory nodes, thereby modulating the expression of enzymes in the saponin pathway. This molecular-level regulation provides a mechanistic basis for the observed correlation between the C/N ratios and saponin content.
While various ecological factors such as the temperature, CO2, light, and soil properties can influence the physiological and biochemical responses of medicinal plants and their secondary metabolism under natural or variable conditions (Pant et al. 2021), in the present study, these factors were maintained under controlled conditions to focus on the specific effects of eCO2. The study did not simulate other critical climate factors that co-vary with eCO2 in nature, such as elevated temperatures, drought, ozone, or soil nutrient variations, all of which can interactively affect C/N metabolism and secondary metabolism. Plant secondary metabolites are those compounds involved in the interactions of plants with abiotic stressors (Kim and You 2012). The increased total saponin content in P. japonicus under conditions involving extended eCO2 levels could be caused by stress generated due to imbalances in the accumulation of C and N. While we discussed potential regulatory mechanisms involving transcription factors and key enzymes in the saponin pathway, these were based on literature inference rather than direct experimental data. Future studies should integrate multi-omics approaches to validate these pathways.
Conclusion
Over the course of the experiment, exposure to 750 ppm CO2, particularly at 84 days, led to a marked decline in the N content across all organs, resulting in a significant increase in the C/N ratio of P. japonicus. Notably, the highest total saponin content was observed in the rhizomes under 750 ppm CO2 after 84 days of treatment, suggesting a positive relationship between elevated C/N ratios and secondary metabolite accumulation under prolonged CO2 enrichment. The interaction between the CO2 concentration and exposure time indicated that C assimilation and nitrogen partitioning were dynamically regulated over time, with longer exposure times enhancing the effects of eCO2 on the C/N balance and saponin biosynthesis. Although this study provides valuable insights into the CO2-mediated regulation of C and N metabolism in relation to medicinal compound accumulation, certain limitations should be acknowledged, including the relatively narrow range of the CO2 and duration treatments. Such knowledge may inform future cultivation practices, tissue culture optimization efforts, or controlled-environment agriculture approaches aimed at improving the yield and quality of this high-value medicinal plant in the context of global atmospheric CO2 change.
