

Introduction
Material and Methods
Growth Conditions
Measurement of Leaf Areas
Selection of Regression Models
Structure and Training of Artificial Neural Network (ANN)
Verification of Regression Models and ANN
Results and Discussion
Characteristics of Paprika Leaves
Selection of Regression Models
Estimation and Verification of Regression Model
Training and Verification of ANN
Discussion
Introduction
Paprika (Capsicum annuum L.), a high-value horticultural crop, requires a significant level of environmental control for successful cultivation. Under favorable greenhouse conditions, paprika grows rapidly to form a dense community with high stem elongation; therefore, a simple and accurate model to estimate growth conditions is needed (Cho et al., 2007). Leaf area is an important trait in plant growth and yield analysis, and affects transpiration, photosynthesis, and response to irrigation and fertilization. Thus, estimation of individual leaf growth in greenhouse studies is crucial (Launay and Guerif, 2003; Rosenthal and Vanderlip, 2004; Blanco and Folegatti, 2005). Destructive methods are commonly used to measure leaf area but are time-consuming, have high cost, and may affect light interception and growth patterns of neighbor crops. Therefore, a simple method is needed for estimating leaf area through indices that can be measured through non-destructive methods (Peksen, 2007). Among several indices, the leaf length and width are used to estimate the leaf area of various crops (Gamiely et al., 1991; Montero et al., 2000; Cho et al., 2007; Tai et al., 2009; Jung et al., 2016). These studies were conducted based on the assumption that all leaves from a single crop are constant in shape, so that leaf area can be estimated using a regression analysis of the leaf length and width. However, even genetically identical crops have varying leaf morphologies (Dickinson et al., 1987, Weight et al., 2008; Xia et al., 2013). Paprika, which has a number of growth stages, is known to have non-uniform leaf forms during varying leaf ages (Xia et al., 2013). According to de Swart et al. (2004), the estimation accuracy of paprika leaf areas via a modified model that accounted for leaf age was higher than that via a regression model using only the leaf length and width. Therefore, accounting for leaf age is crucial in the development of models that accurately estimate individual leaf areas. The age of leaves, however, needs to be continuously identified starting at early growth stage. Thus, estimating leaf area with measurements conducted in a specific aperiodic stage is difficult, and an indirect leaf age indicator is required. The objective of this study was to develop an accurate estimation model for paprika leaf areas by adding a node number variable to the model developed using leaf length and width. In addition to the existing regression models, an artificial neural network model was applied for more accurate and precise results.
Materials and Methods
Growth Conditions
The paprika (Capsicum annuum L. ‘Cupra’) plants to be measured were cultivated in a Venlo greenhouse at the Protected Horticulture Research Institute (RDA) based in Haman, Gyeongsangnam-do (35.249° N, 128.425° E), Korea. Paprika plants grown over ten months of transplanting were used in the experiment because all of their leaves could be sampled regardless of size. Nutrient solutions were maintained at an electrical conductivity (EC) of 2.5-3.0 dS·m-1 and a pH of 5.8-6.0. Air temperatures in the greenhouse were maintained at 25/18°C (day/night) with ventilation and heating.
Measurement of Leaf Areas
A total of 442 leaf samples were randomly selected from six individual paprikas. The widely-used traits leaf length and width were measured, and the number of nodes where the leaves were attached was recorded from the standard of the first node. Leaf length was measured from the end of the petiole to the opposite end of the leaf, and the leaf was measured after it was flattened. Leaf width was measured in the direction perpendicular to the leaf area, and the longest leaf width was measured in the middle part of the leaf. The leaf shape ratio (length/width) was calculated for each leaf, and leaf area was measured using a leaf area meter (Li-3100, LI-COR, Lincoln, NE, USA).
Selection of Regression Models
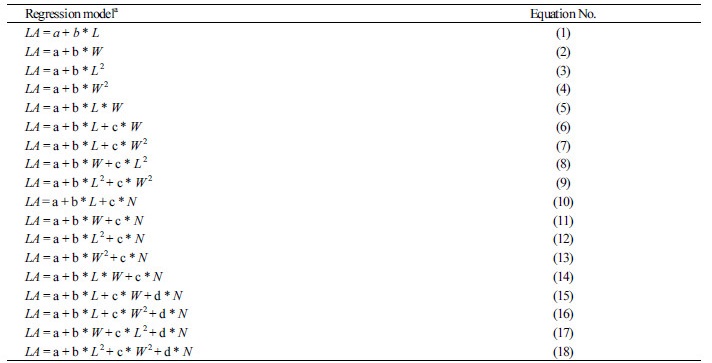
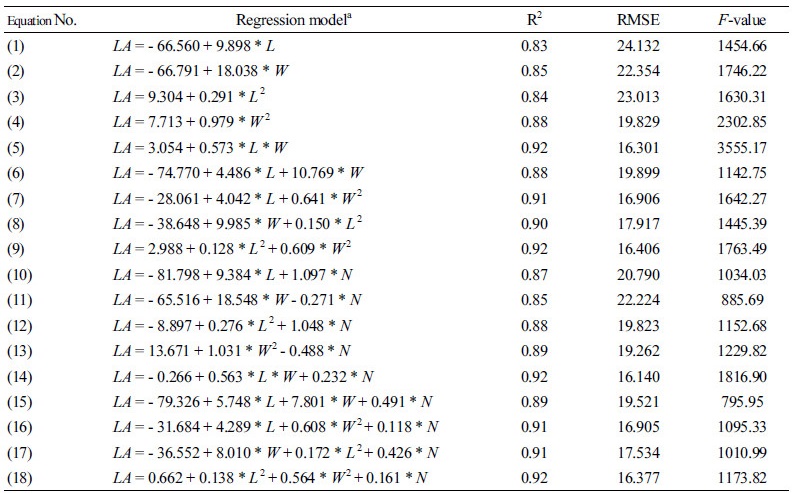
To estimate leaf areas, 18 types of regression equations were selected as standard models (Cho et al., 2007; Table 1). The regression model was used to estimate leaf area by expressing the leaf area (L) and width (W) and the number of nodes with leaves (N) as linear variables. Values with high correlations to leaf area, such as leaf length and width, were combined with multiplication. The number of nodes with leaves, however, was not strongly correlated with leaf area, so the number could not be combined with multiplication. Standard models (Eqs. 1-9) expressed with linear or multiplication equations of leaf area and width have been used widely. The modified model (Eqs. 10-18), which added the number of nodes with leaves corresponding to 1-9 as a variable, was also used.
Table 1. Regression models for estimating leaf area (LA). L, W, and N indicate leaf length, width, and node number,
respectively
 |
Regression analysis was performed using the SPSS statistical software (IBM, New York, NY, USA) for 18 models randomly selected from 337 samples of a combined 442 leaves. Sigmaplot (Systat Software, San Jose, CA, USA) was used to plot the graphs. The model with the highest R2 value was selected for each regression analysis, and that with the lowest root mean square error (RMSE) was selected when the R2 values were the same.
Structure and Training of Artificial Neural Network (ANN)
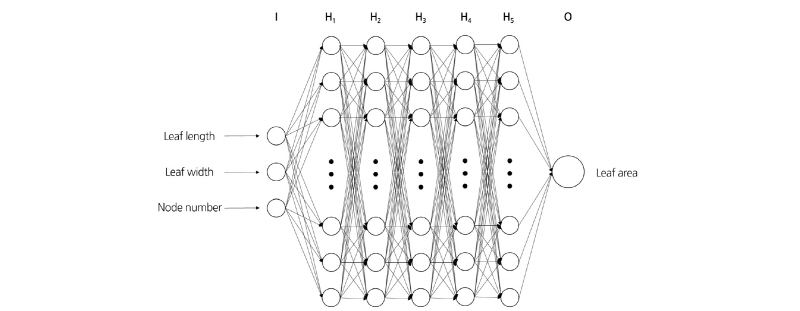
A machine learning method was also applied for estimating leaf areas using the node numbers in addition to the leaf area and width. The machine learning tool used in the present study was Tensorflow (v. 1.2.1, Google, Menlo Park, CA, USA), a numerical computation library based on the programming language Python. An ANN consists of input, hidden, and output layers, with each layer consisting of perceptrons. The perceptrons of the input layer correspond to leaf area and width and node number, and those of the output layer correspond to leaf area. In the hidden layer, the value received from the input layer was multiplied by the weight and the input information passed through the activation function. In the present study, each of the five hidden layers consisted of 512 perceptrons (Fig. 1). The rectified linear unit (ReLU) function was used as the active function, and learning proceeded to lower the mean square error (MSE).
Verification of Regression Models and ANN
The verification procedure was conducted on the most reliable model derived from regression analysis and on the training results of the ANN. The regression models and the ANN were verified using 105 leaf samples excluded in regression modeling and ANN training. For comparison, regression analysis for 1: 1 line was conducted with SPSS program, and model reliability was verified by checking the R2 value.
Results and Discussion
Characteristics of Paprika Leaves
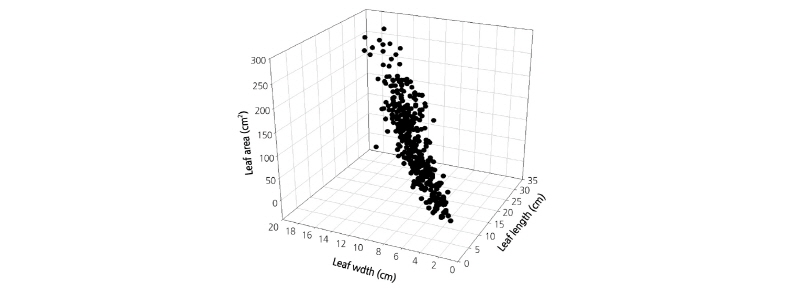
The relationship between measured leaf length and width and estimated leaf area of 442 leaves was plotted (Fig. 2). As the leaf length and width increased, the leaf area grew linearly from 9.26 to 268.92 cm2. In the relationship between node number and leaf area, an increase in the number of nodes with leaves correlated with an increase in leaf area (Fig. 3A). This result is due to physiological characteristics of Solanaceae crops, in which new nodes are developing at the top of the previous node, and to the characteristics of the defoliation of cultivated paprika, in which only one or two leaves are left in each node (Lohr and Sudkamp, 1989). The leaf shape ratio of paprika plants also changed depending on growth stage (Fig. 3B). The newly-emerged leaves had a longer length with a higher leaf ratio, but the ratio decreased as leaf growth progressed. It is known that leaves constituting the paprika are not uniform in leaf shape because they occurred at different times and have been grown under different environmental conditions (de Swart et al. 2013). Nevertheless, leaf ratio of the paprika leaves was correlated with node number (Fig. 3B). Therefore, the present study confirmed that the node where the leaves are present is an appropriate indicator of paprika leaf ages and shapes.
Selection of Regression Models
Table 2 shows the regression results for the leaf areas of 18 paprika plants according to leaf length and width and node number. Among the regression results of Eqs. 1-9, which were expressed as leaf length and width, Eq. 5 consisted of the multiplication terms of the leaf length and width and showed the highest accuracy, with an R2 and RMSE of 0.92 and 16.301, respectively. This model was similar to that selected in previous studies on paprika (Tai et al., 2009). The regression analysis of the modified model equations (Eqs. 10-18) improved accuracy thanks to the addition of node number as a new variable. Eqs. 10 and 12, modified from Eqs. 1 and 3, respectively, had relatively higher accuracy, while Eqs. 13 and 18, modified from Eqs. 4 and 9, showed no increase in R2 but a lower RMSE. In general, the modified models that included the node number had higher accuracy and lower RSMEs than the standard models.
Estimation and Verification of Regression Model
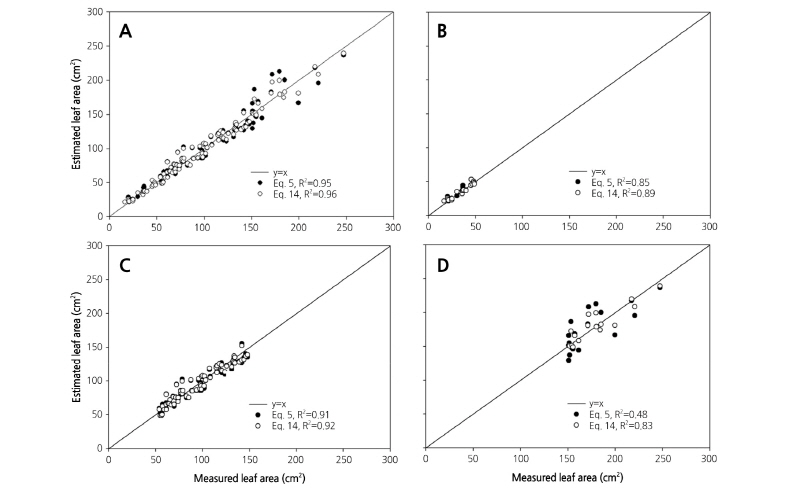
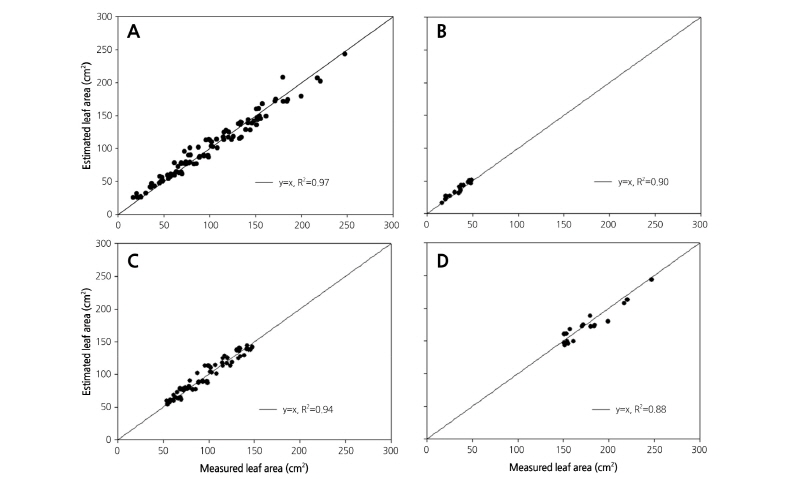
Equations 5 and 14 were selected as the most reliable models for estimating leaf area in the standard and modified models, respectively. Verification was performed between the estimated and measured leaf areas for 105 leaves, which were separately classified without using the regression process (Fig. 4A). As a result, Eqs. 5 and 6 showed the highest accuracy, each with an R2 of 0.95.
Leaf size was classified into three groups: big (over 150 cm2), middle (150-50 cm2), and small (under 50 cm2; Fig. 4B-4D). Accuracy differed when Eqs. 5 and 14 were applied to the three groups. When the standard model Eq. 5 was applied to each group, the areas of middle and small size leaves showed stable prediction accuracy (Fig. 4B and 4C). The highest accuracy was seen in the middle size because most paprika leaves were of middle size, and this consequently affected the regression analysis. Accuracy was poor, however, among the big size leaves (R2 = 0.48), indicating the inapplicability of Eq. 5 to leaf area prediction for large leaves. On the other hand, the modified model Eq. 14 showed a higher R2 than Eq. 5 for all leaf sizes. Even among the big leaf sizes accuracy was relatively higher (R2 = 0.83), because the node number was crucial in reflecting the change of leaf shape over growth stages.
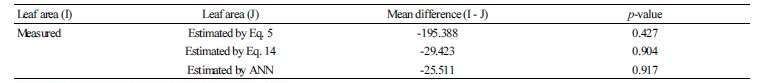
The mean difference in the total leaf area of each plant estimated by Eq. 5 was larger than those estimated by Eq. 14 (Fig. 5). The accuracy of the standard model was low for big size leaves compared to other methods. The p-values for Eqs. 5 and 14 in the Fisher least-significant difference post-test were 0.427 and 0.904, respectively (Table 3). Therefore, it would be more adequate to apply the modified model using node numbers. Under regression analysis using only leaf length and width, non-uniformity was shown in the leaf areas of each leaf size group. The use of the same number of leaves by growth stage in regression analysis has been reported to solve this problem (Jung et al., 2016). It is difficult, however, to estimate the leaf area of an individual paprika plant because old leaves of over 150 cm2 occupy a high portion of the paprika plant, while their number is lower than that of new or growing leaves. The leaf area of each individual paprika plant in a specific growth period was considered especially useful in the prediction of irrigation control (Ferrara et al., 2011; Patanè, 2011; Shin et al., 2011), estimation of photosynthesis (Díaz-Pérez, 2013), and distribution management of assimilation products (Marcelis et al., 2004; González-Real et al., 2009). Therefore, use of the modified model including node numbers to non-destructively estimate leaf area in paprika is appropriate, in addition to utilizing leaf length and width.

Training and Verification of ANN
The training frequency of the ANN was 70,000 times, assuming that the number of training times was one when all data were used, and training accuracy had an R2 of 0.92. Using the trained ANN with leaf length and width and node number, verification performed between the estimated and measured leaf areas of 105 leaves showed an R2 of 0.97, which was higher than those of Eqs. 5 and 14 (Fig. 6A). For all groups classified by leaf size, the ANN also showed higher accuracy than regression analysis (Fig. 6B-6D). The p-value was 0.917, showing a higher accuracy of individual leaf area estimation than regression models (Table 3).
ANN is a suitable algorithm to use big data that are difficult to analyze manually, and its accuracy becomes higher with the use of more data (Trejo-Perea et al., 2009). Because this study only used 1,768 points (leaf length, leaf width, node number, and leaf area of 442 leaves), the ANN did not show a dramatic improvement in estimation accuracy. However, the application of ANN to leaf area estimation has advantages over the regression analysis method, in addition to higher accuracy. In this case, adding only the node number increased the model accuracy, without the use of additional equipment or labor for measuring leaf areas. However, many variables such as SPAD, leaf length and shape ratio, and environmental factors have been suggested for improving the accuracy of leaf area estimation (Lu et al., 2004; Serdar and Demirsoy, 2006; Cho et al., 2007; Antunes et al., 2008; Jung et al., 2016). Use of ANNs is suitable for finding optimal combinations through fast and simple methods with high accuracy, while deriving the relationship between factors and results in complicated systems via regression analysis is difficult (Vaidyanathan et al., 2015; Taormina and Chau, 2016; Wang et al., 2016). Therefore, ANN is anticipated to be a more accurate and faster method of nondestructive estimation of crop growth indicators such as leaf area. Since leaf area is an important growth index related to crop growth and yield, the nondestructive prediction of leaf area with simple indicators is important.
The present study proposed the node number of leaves as a measurable variable that requires no additional equipment or labor and can improve the accuracy of models for leaf area estimation. Furthermore, use of ANN allowed estimation of leaf areas with higher precision than the regression analysis method. Therefore, the results of the present study may help devise an effective method to estimate leaf area in paprika.
