

Introduction
Materials and Methods
Plant Materials
Evaluation of Russet
Statistical Analysis
Results and Discussion
Introduction
Russet is a reddish-brown color on fruit skin as a result of the formation of a cork layer, which composed of suberin and lignin, and microcracks (Wang et al., 2016; Jia et al., 2021). The skin colors of Asian pears are divided into three types: russet, green, and intermediate russet and green, depending upon the occurrence of russet. Russet on fruit skin protects the fruit from external stresses, including disease, insects, and stressful weather conditions when fruits are growing (Inoue et al., 2006). A previous study reported that ‘Whangkeumbae’ (a non-russeting pear) developed russet on its skin during non-bagging cultivation (Hong et al., 1989). Spotted russet on pear fruit skin reduces its commercial value. Therefore, reducing russet development on pear fruit skin is one of the priorities of pear breeding programs (Shi et al., 2019).
Asian pear skin colors are typically measured using visual estimation and a color-difference meter (Han et al., 2012; Yamamoto et al., 2014). Visual estimation is an easy and simple method, but it is subjective and poorly reproducible. Therefore, visual estimation is unsuitable for quantitative trait investigations such as russet development. A color-difference meter has also been used for phenotyping fruit color. However, Hunter’s values cannot represent the whole fruit color because the russet formation is affected by environmental conditions. Thus, a precise method for russet measurement is required.
Image analysis is a technically simple method to collect accurate phenotype data (Underhill et al., 2020). In addition, image analysis could be used to phenotype numerous plants in an automated format and could increase the scale and throughput of the process (Eberius and Lima-Guerra, 2009; Ubbens and Stavness, 2017). Image analysis has become an essential method for precisely investigating the phenotypes of the trait of interest and has been used to investigate quantitative traits including berry cluster yield, drought response, and root development for quantitative trait loci (QTL) analysis and genome-wide association studies (GWASs), which require phenotype data from numerous accessions. As a result, genes controlling the expression of the target traits have been identified using accurate phenotypic data (Chen et al., 2014; Diago et al., 2014; Le Marié et al., 2014; Leitner et al., 2014). Falginella et al. (2015) used image analysis in an apple population of ‘Renetta Gridia di Torriana’ (russet) × ‘Golden Delicious’ (slight to moderate russeting) and identified two QTLs associated with russet on the apple fruit skin. Underhill et al. (2020) also applied image analysis in an investigation of the fruit skin color of six species of Vitis and performed QTL analysis. In addition, fruit skin color was measured through image analysis according to the maturity of tomatoes (Takahashi et al., 2013; Bello et al., 2020). However, the development of an image analysis technique for russet investigation in pear fruit skin has not been reported yet.
‘Whangkeumbae’ (Pyrus pyrifolia) has been used as a maternal parent in Korean pear breeding programs, showing slight russet formation during bagging cultivation. In contrast, ‘Minibae’ ((P. pyrifolia × P. ussuriensis) × P. pyrifolia) displays abundant russet formation on the fruit skin, and the fruits of ‘Minibae’ have low commercial value. Therefore, ‘Whangkeumbae’ × ‘Minibae’ is a suitable material for genetic analysis related to russet formation. To verify the accuracy and efficiency of image analysis, this study compared the russet phenotypic data obtained from a color-difference meter with the image analysis of ‘Whangkeumbae’ × ‘Minibae’.
Materials and Methods
Plant Materials
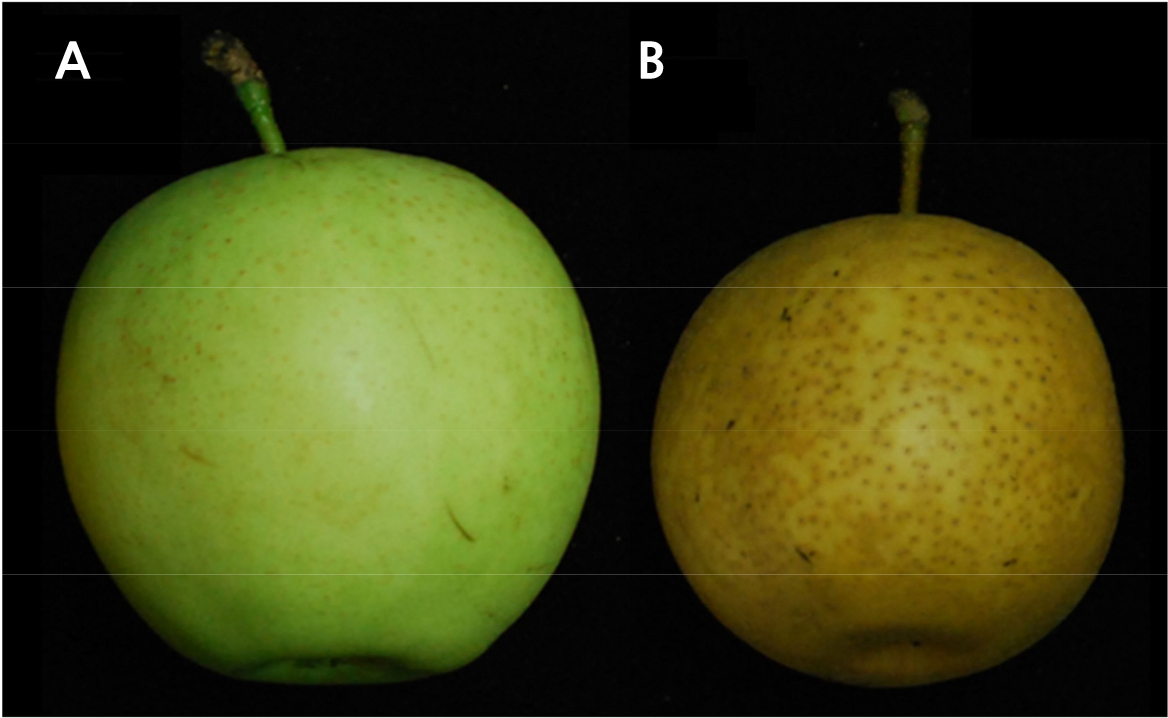
Three to four fruits of ‘Whangkeumbae’ (non-russet), ‘Minibae’ (russet), and their 127 F1 individuals were randomly collected at 130 days after full bloom in 2019 and 2020 (Fig. 1). All the pear trees used in this study were planted at the Pear Research Station, National Institute of Horticultural and Herbal Science (35°01'27.9"N, 126°44'44.5"E) in Korea.
Evaluation of Russet
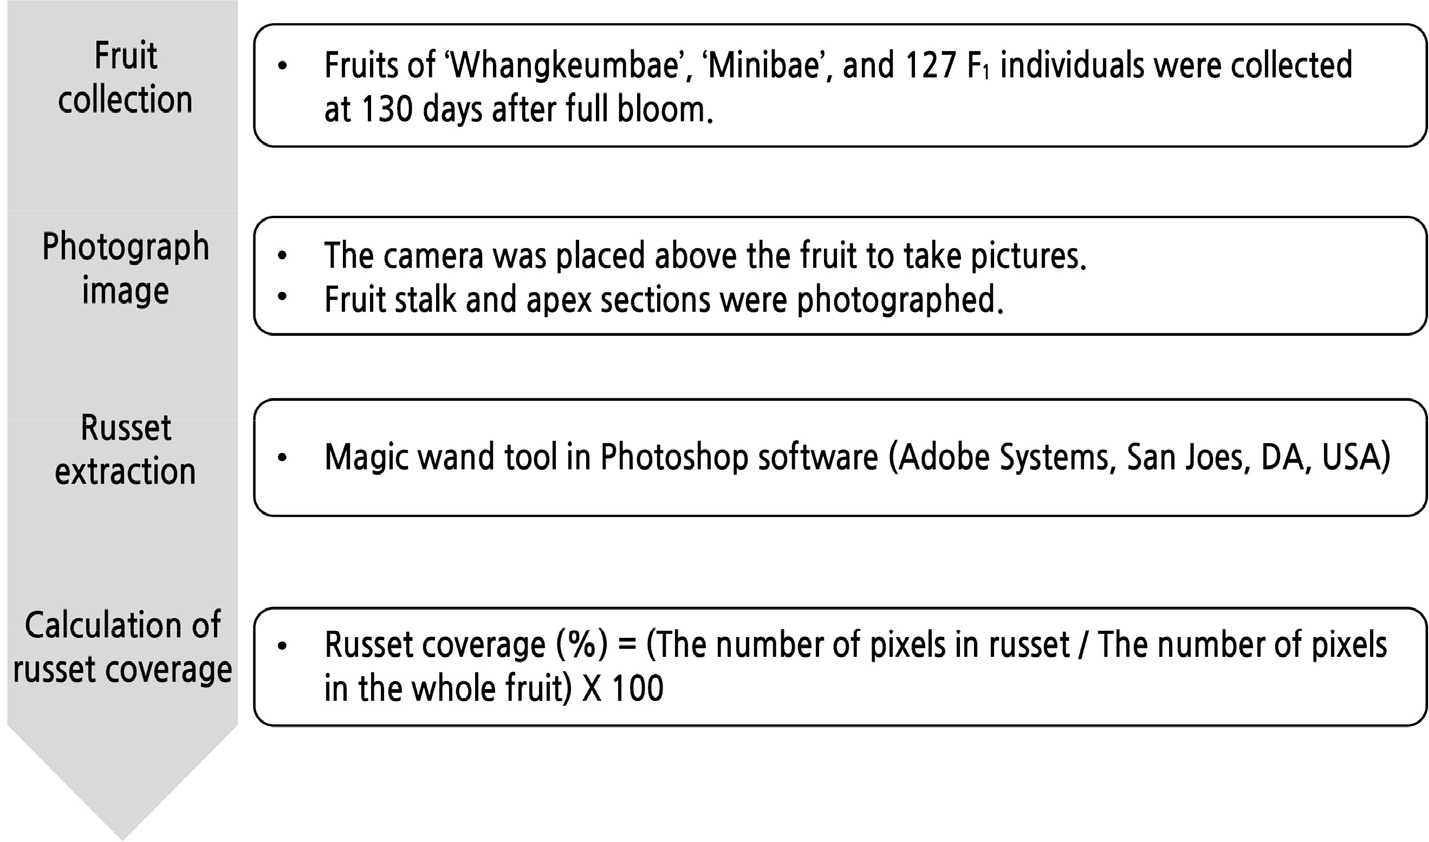
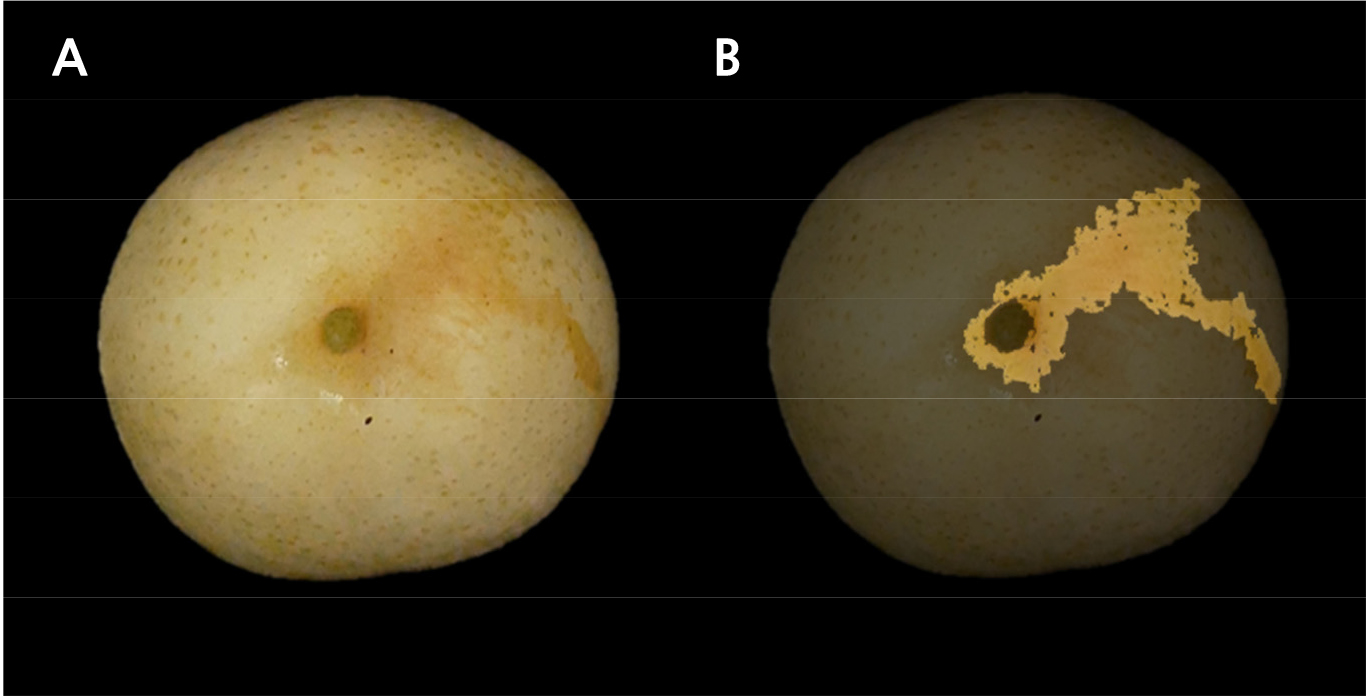
Three fruits of each individual were used for russet phenotyping. To distinguish the red and green color of pear fruit skin, the Hunter a value was measured using a color-difference meter (CR-300, Minolta Osaka, Japan) for 2 years. Russet coverage was calculated using the fruits collected in 2019 (Fig. 2). After fixing the camera to a certain height, pear fruits were placed on a black cloth, and the top (stalk) and bottom (apex) parts were photographed (Fig. 3A). The black background was removed from the photographed image, and the number of pixels in the russet region was measured using Photoshop software (Magic Wand Tool, Adobe Systems, San Joes, CA, USA). Russet coverage was expressed as a percentage of the number of pixels in the russet area to the number of pixels in the entire fruit area (Fig. 3B).
Statistical Analysis
Kernel density estimation was performed using phenotypic data for Hunter a values and russet coverage in R-studio (RStudio, Inc., Boston MA, USA). The correlation coefficients between the Hunter a values and russet coverage were examined using Pearson’s correlation coefficient in Excel (Microsoft, Seattle, WA, USA).
Results and Discussion
The fruit skin color of pears has been mainly evaluated by Hunter’s values, hue angle, chroma value, and visual estimation (Han et al., 2012; Yamamoto et al., 2014; Charoenchongsuk et al., 2015). Motonaga et al. (2010) constructed a color chart for investigating the fruit skin color of European pears through image analysis. In Korea, pear skin color has been assessed by visual estimation and/or using a conventional color chart. However, russet formation, which is one of the characteristics of Asian pears, varies by cultivars or species. Therefore, precise methods and criteria are required for evaluating russet.
‘Whangkeumbae’, which has a green fruit color (Fig. 1A), showed -10.1 and -9.4 Hunter a values in 2019 and 2020, respectively, whereas ‘Minibae’, displaying russet skin color (Fig. 1B), showed positive Hunter a values of 5.8 and 1.8 in 2019 and 2020, respectively. Hunter a values in F1 individuals derived from the ‘Whangkeumbae’ × ‘Minibae’ cross showed quantitative distribution in both years. The russet coverage of ‘Whangkeumbae’ × ‘Minibae’ was distributed variously (Fig. 4). The segregation of pear skin color in F1 individuals derived from ‘Niitaka’ (yellowish-brown) × ‘Suhyangri’ (yellowish-green) also displayed various phenotypes (Kim et al., 2004). Thus, the fruit skin color of pears could be used as a quantitative trait, and one or more genes could control russet formation in pear fruit skin.
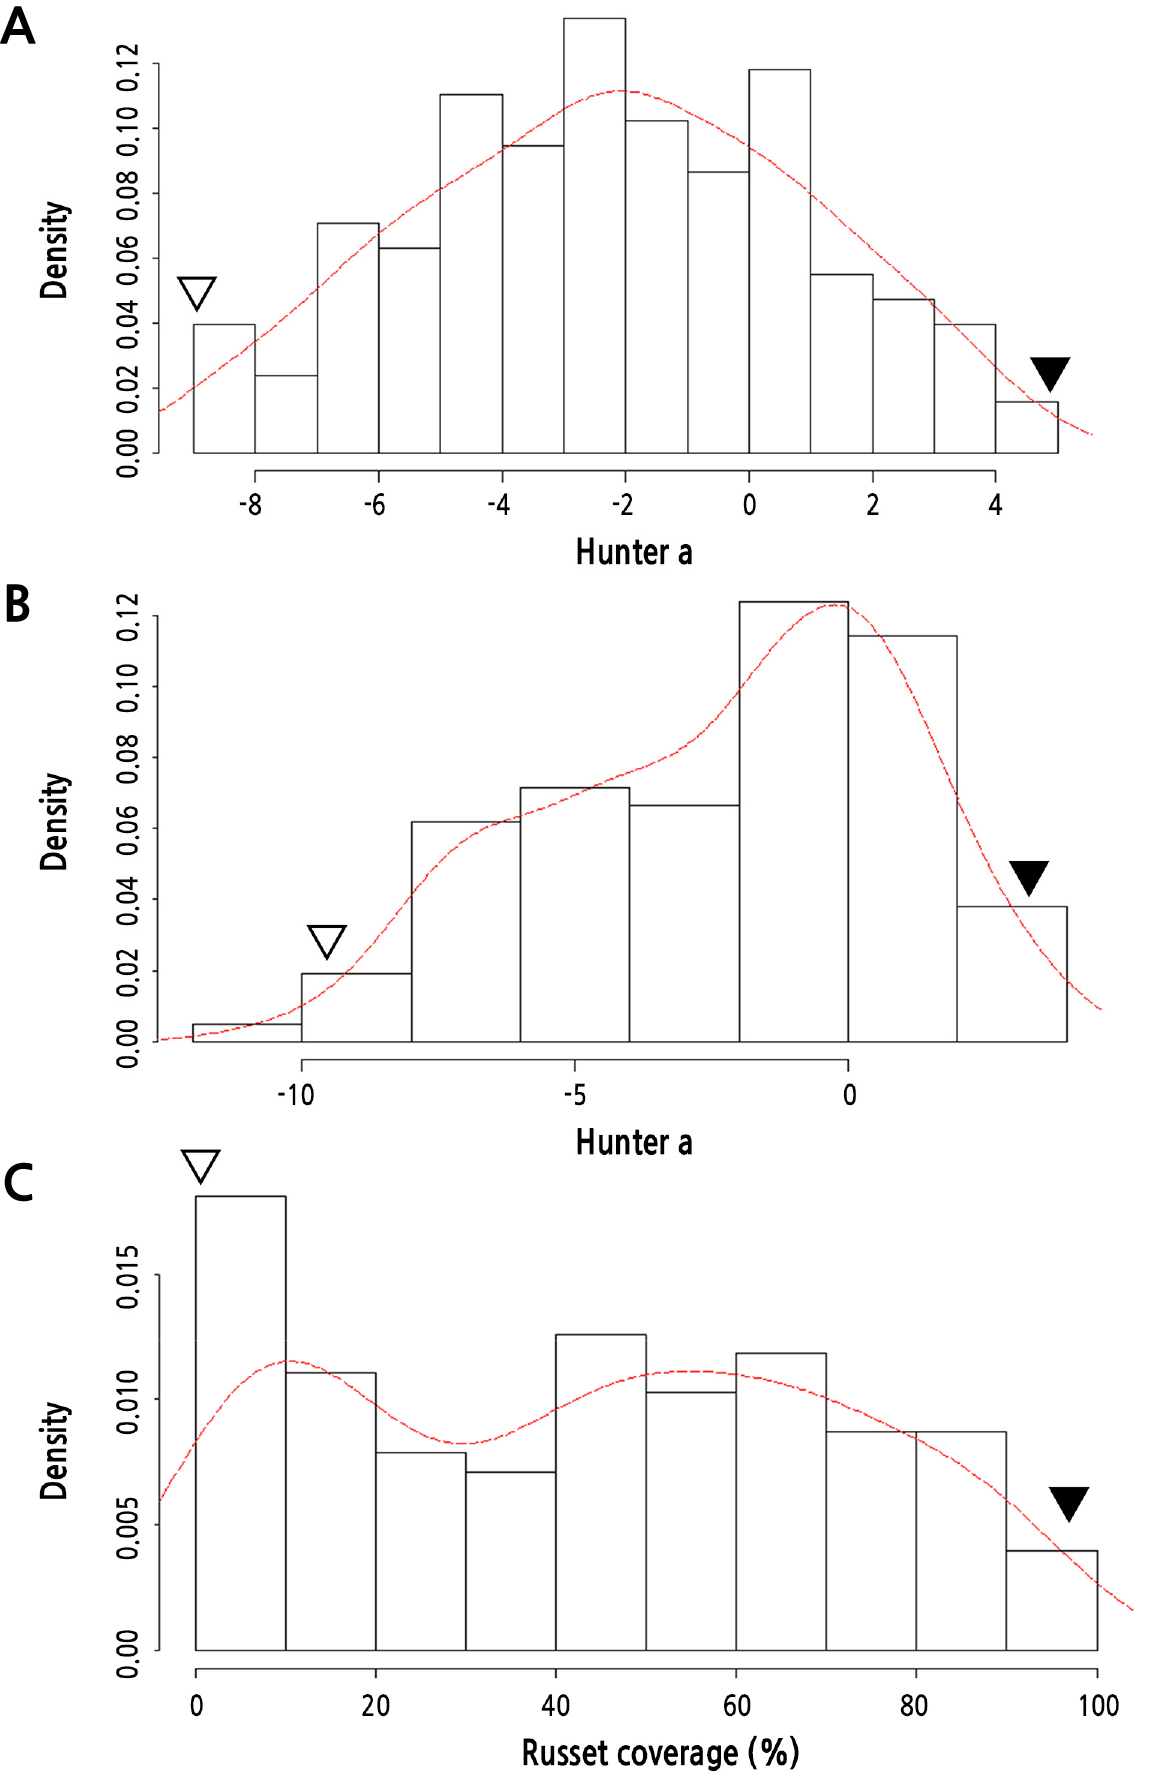
Fig. 4.
Kernel density estimation of Hunter a values and russet coverage in 127 F1 individuals derived from ‘Whangkeumbae’ × ‘Minibae’. The normalized histogram is represented as a red line. ‘Whangkeumbae’ and ‘Minibae’ are represented as white and black inverted triangles, respectively. A, Hunter a values in 2019; B, Hunter a values in 2020; C, russet coverage.
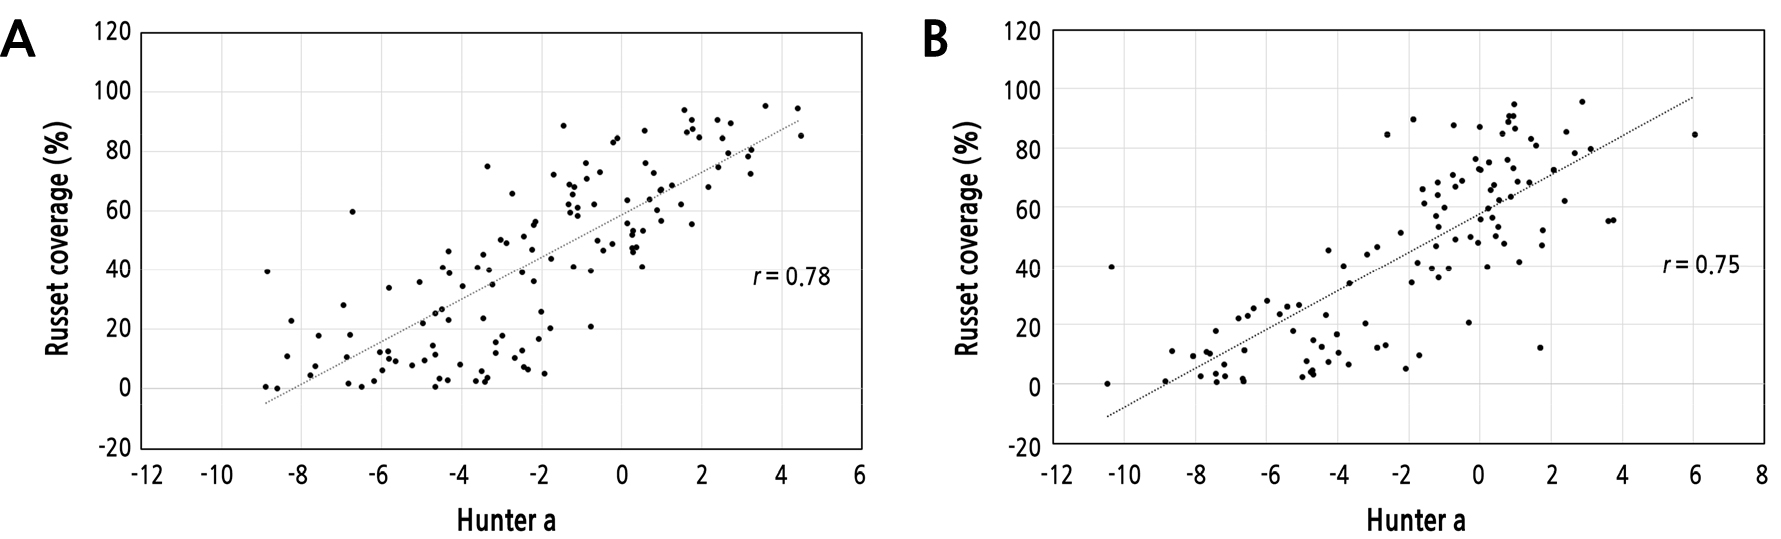
Correlation analysis between Hunter a values and russet coverage was performed to determine an accurate evaluation method for russet development. The correlation coefficient between Hunter a values and russet coverage for 2 years (Fig. 5; r = 0.75 to 0.78, p < 0.05) indicated that the two phenotypes were positively correlated. Takahashi et al. (2013) and Underhill et al. (2020) confirmed a high positive correlation between Hunter a values and image analysis (r > 0.9) in the fruit skin color of tomatoes and grapes, respectively. Russet on pear fruit skin develops informally and is affected by environmental factors. Although Hunter’s values have been used for color investigations in diverse horticultural crops, they cannot represent the color of the entire target organ. Several F1 individuals of ‘Whangkeumbae’ × ‘Minibae’ had negative Hunter a values, but the same F1 individuals developed russet on the fruit skin. For example, the F1 individual 15-91 showed -8.77 ± 2.00 Hunter a values, but its russet coverage was 65.77 ± 11.94%. Because russet formation in pear fruit skin is not due to specific pigmentations like in tomatoes and grapes (Castellarin and Gaspero, 2007; Brar et al., 2008; Wang et al., 2014; Chattopadhyay et al., 2021), Hunter a values and russet coverage could be discordant, resulting in a relatively lower correlation coefficient than in previous studies.
In this study, russet was quantified using bi-dimensional image analysis. This process made it possible to accurately quantify russet in the whole fruit. Therefore, measuring russet coverage in fruit skin was a more accurate phenotyping method than using Hunter a values. To reveal the genetic basis of a quantitative trait, it is necessary to link genotypic data with phenotypic data. Thus, a precise phenotypic investigation is important. Phenotyping a large number of accessions or russet-related cross populations using an image analysis system for the russet evaluation of pear fruit skin will facilitate the identification of genes that control russet formation through GWAS and QTL analyses. Furthermore, our results can be the basis for the development of a new program that automatically evaluates the russet coverage of fruit skin.
