

Introduction
Materials and Methods
Plant Materials and DNA Isolation
SSR Genotyping
Data Analysis
Results and Discussion
A Core Set of SSR Markers
Genetic Diversity Analysis and Cultivar Identification
Introduction
Melon (Cucumis melo L.) is an important cultivated species (2n = 2x = 24) in the Cucurbitaceae family that contains about 965 species representing 95 genera (Christenhusz and Byng, 2016). This crop shows significant variations in fruit traits, such as fruit shape (round, ovoid, oblong, slender, and flat), fruit surface (smooth, warty, wrinkled, and ribbed), flesh color (orange, yellow, green, pink, and white), and fruit weight (50 g to 15 kg) in commercial cultivars (Nunez-Palenius et al., 2008; Monforte et al., 2014; Leida et al., 2015). With great nutrient values and unique flavors, melon fruit
is rich in soluble sugars, vitamin C,  -carotene, minerals, and antioxidant compounds (Lester, 1997; Wolbang et al., 2008; Leida et al., 2015; Zeb, 2016). Melon is divided into six subspecies, including inodorus, reticulatus, cantalupensis, acidulous, saccharinus, and makuwa (Liu et al., 2004). The subspecies C. melo L. var. makuwa (oriental melon) is also called ‘Korean melon’ or ‘Chamoe’.
Generally, oriental melon fruit is ellipsoid or oval-oblong in shape, with a yellow to orange-yellow smooth surface and white longitudinal stripes (Lim, 2012). This subspecies originated from East India and has been cultivated widely in East Asia, particularly in the temperate regions of Korea, Japan, and China (Lim, 2012; Kim et al., 2016). Because of its economic value, many efforts have been made to develop elite cultivars in breeding programs. Thus, it has been important to protect the breeders’ rights for new cultivars. The distinctness, uniformity, and stability (DUS) test was established by the International Union for the Protection of New Varieties of Plants (UPOV, 2002). It is a standard method for evaluating new cultivars for variety protection. However, the DUS test requires labor-intensive and time-consuming evaluation based on phenotypes.
Molecular markers have been used to assess genetic diversity in crops (Mondini et al., 2009). Of the several different types of molecular markers, simple sequence repeats (SSRs) have been used as a marker for genetic study due to their codominance, multiallelic nature, and high reproducibility (Vieira et al., 2016). The SSR motifs are found on both coding and noncoding sequences. Expressed sequence tag SSRs (EST-SSRs) from coding sequences show lower levels of polymorphism but higher cross-species transferability relative to genomic SSRs from noncoding sequences (Varshney et al., 2005). In the last two decades, a large number of SSR markers have been developed and applied to DNA fingerprinting, genetic diversity analysis, and linkage analysis in crop species (Danin-Poleg et al., 2001; Guo et al., 2007; Fernandez-Silva et al., 2008; Zhang et al., 2014., Phan et al., 2016).
In melon, SSR markers have been developed and used to investigate genetic diversity in germplasm collections (Danin-Poleg et al., 2001; Ritschel et al., 2004; Kong et al., 2011; Aragão et al., 2013). The 61 Cucumis SSR markers were developed using genomic and cDNA libraries and database sequences (Danin-Poleg et al., 2001). Of these, the 31 SSR markers showed a total of 111 alleles in a collection of 13 melon accessions and revealed a distinction between the sweet cultivated melon and the ‘exotic’ melon. Ritschel et al. (2004) used an enriched genomic library to develop 144 SSR markers. A set of 25 SSR markers effectively identified 40 melon accessions representing the cultivated subspecies (inodorus, cantalupensis, cantalupensis/reticulatus) and noncultivated subspecies (conomon). Furthermore, the EST-SSR markers developed using the melon unigenes separated thin-skinned melons from thick-skinned melons in a collection of 27 Chinese melon accessions (Kong et al., 2011). Aragão et al. (2013) used 17 genomic SSR markers for genetic diversity analysis in the 38 melon accessions, which belong to different botanical groups and show characteristics of specific market classes. In this study, we curated and selected a core set of SSR markers to establish an accurate DNA database for a collection of 53 oriental melons. This core set of 23 genomic SSRs and 20 EST-SSRs was effective to distinguish all of these cultivars, suggesting the usefulness of these markers for cultivar identification and seed purity tests in oriental melon. This molecular tool will be valuable to protect the breeders’ intellectual property.
Materials and Methods
Plant Materials and DNA Isolation
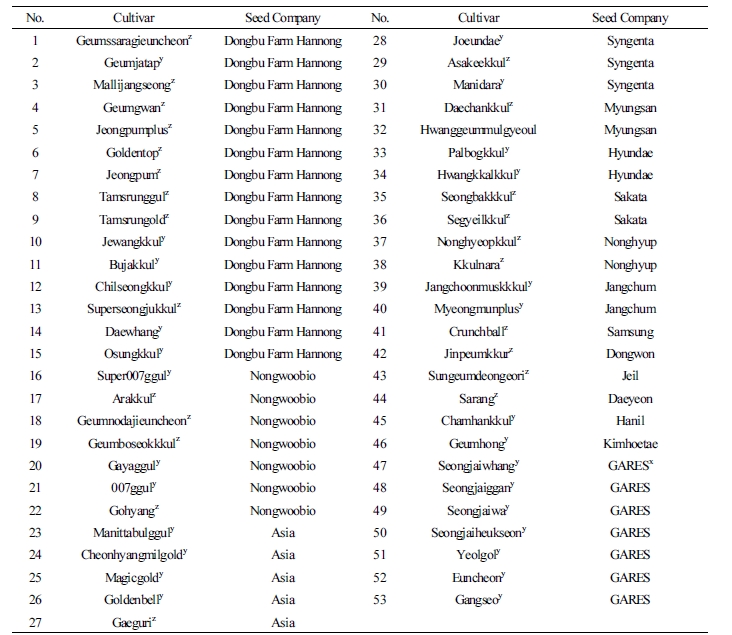
A total of 53 oriental melon cultivars were collected from 16 seed companies in Korea (Table 1). Genomic DNA was isolated directly from the 5 to 7 seeds of each cultivar. Seeds were ground in liquid nitrogen, and genomic DNA was extracted using the NucleoSpin® Plant II kit (Macherey-Nagel GmbH & Co. Germany). The quality and quantity of isolated DNA was measured by using electrophoresis on agarose gel with a quantitative DNA standard. The DNA solution was diluted to final concentration of 10 ng·µL-1 for SSR analysis.
SSR Genotyping
The 521 SSRs used in this study were derived from previous studies (Danin-Poleg et al., 2001; Fazio et al., 2002; Chiba et al., 2003; Ritschel et al., 2004; Gonzalo et al., 2005; Kong et al., 2007; Fernandez-Silva et al., 2008). To identify polymorphic SSRs, these SSRs were tested using a subset of the seven cultivars, including ‘Geumssaragieuncheon’, ‘Manidara’, ‘Chilseongkkul’, ‘Gohyang’, ‘Osungkkul’, ‘Superseongjukkul’, and ‘Hwangkkalkkul’ (Table 1). The HAD-GT12TM Genetic Analyzer (eGEnE, USA) was used for fragment analysis of SSRs. PCR reactions were prepared in a total volume of 30 µL containing 50 mM KCl, 1.5 mM MgCl2, 10 mM Tris-HCl (pH 8.0), 0.2 µM of each SSR primer, 0.2 mM of each dNTP, 1 unit of Taq DNA polymerase, and 25 ng of DNA template. For amplification, we used a thermal program starting with a cycle at 94°C for 5 min for initial denaturation, followed by 40 cycles at 94°C for 30 s, 50-60°C for 30 s, 72°C for 45 s, and a cycle at 72°C for 10 min for final extension. A set of polymorphic SSR markers with simple segregation patterns was used to genotype additional 46 cultivars with the 3130XL Genetic Analyzer (Applied Biosystems, USA). The 5’ end of each forward primer for this analysis was labelled with FAM, VIC, NED, or PET fluorescent dye (Applied Biosystems, USA), and SSR alleles were determined using GeneMapper software version 3.7 (Applied Biosystems, USA).
Data Analysis
The polymorphism information content (PIC) value for each marker was estimated using the following equation:

in which n and piare defined as the total number of alleles and the frequency of the i th allele, respectively (Anderson et al., 1993). Furthermore, genetic relationships in our collection of oriental melon cultivars were investigated using three sets of SSR markers, including EST-SSRs, genomic SSRs, and all combined SSRs. Genetic distances between cultivars were estimated using the Jaccard’s method (Sneath and Sokal, 1973) as implemented in NTSYSpc software version 2.2 (Rohlf, 2008). The unweighted pair group mean algorithm (UPGMA) was used to construct a dendrogram based on the resulting genetic distances. In addition, the Mantel test (Mantel, 1967) was performed to estimate correlation between the genetic distances from EST-SSRs and genomic SSRs using the MXCOMP module in the NTSYSpc software.
Results and Discussion
A Core Set of SSR Markers
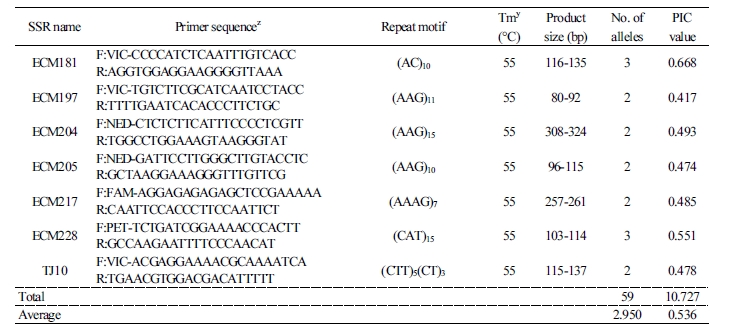
The polymorphism of the 521 SSRs was tested using a subset of seven commercial cultivars. Of these, 185 SSRs were polymorphic in these cultivars and 43 SSRs (20 EST-SSRs and 23 genomic SSRs) showed clear and simple segregation patterns for DNA fingerprinting (Fig. 1). The 20 EST-SSR markers detected 59 alleles with an average of 2.95 alleles per marker in the 53 oriental melon cultivars (Table 2). The seven SSR markers (ECM91, ECM125, ECM197, ECM204, ECM205, ECM217, and TJ10) detected only two alleles, while the 13 SSR markers (CM16, CM38, ECM54, ECM81, ECM123, ECM124, ECM157, ECM172, ECM181, ECM228, ECM130, ECM133, and ECM60) detected 3 to 7 alleles. The PIC values of the EST-SSR markers ranged from 0.411 (ECM157) to 0.816 (ECM60) with an average of 0.536. In a previous study, 19 EST-SSR markers showed an average of 3.0 alleles per marker in 27 melon cultivars (Kong et al., 2011), which is comparable with that of the EST-SSR markers in this study. Interestingly, our EST-SSR markers showed higher average PIC values relative to 0.455 for the 19 EST-SSR markers.
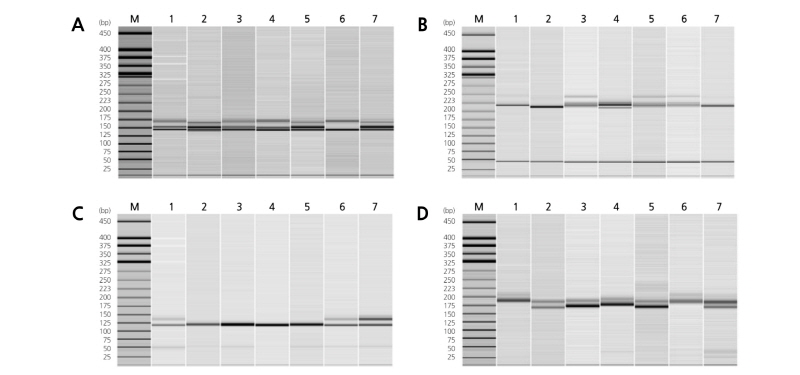
Fig. 1. Polymorphism of four SSR markers: ECM60 (A), ECM130 (B), ECM181 (C), and CMGAN12 (D). The PCR amplicons were analyzed using the HAD-GT12TM Genetic Analyzer. M, QX DNA size marker (25-450bp); lane 1, ‘Geumssaragieuncheon’; 2, ‘Manidara’; 3, ‘Chilseongkkul’; 4, ‘Gohyang’; 5, ‘Osungkkul’; 6, ‘Superseongjukkul’; and 7, ‘Hwangkkalkkul’.
Table 2. Repeat motif, number of alleles, and PIC value of 20 EST-SSR markers selected for genetic characterization of oriental melon cultivars 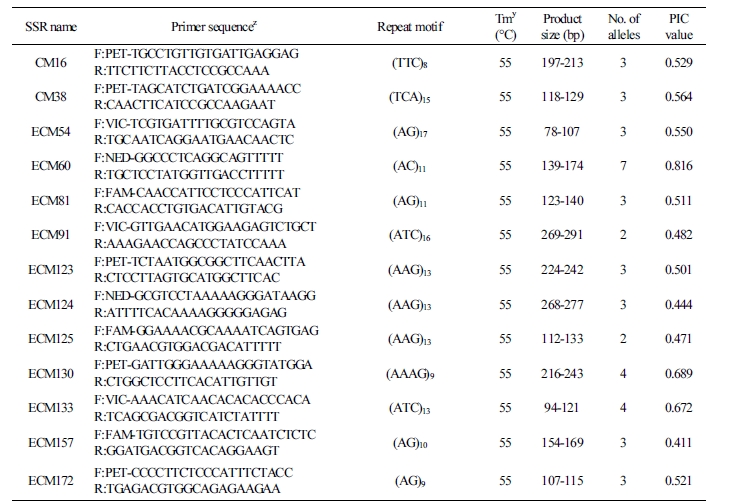 |
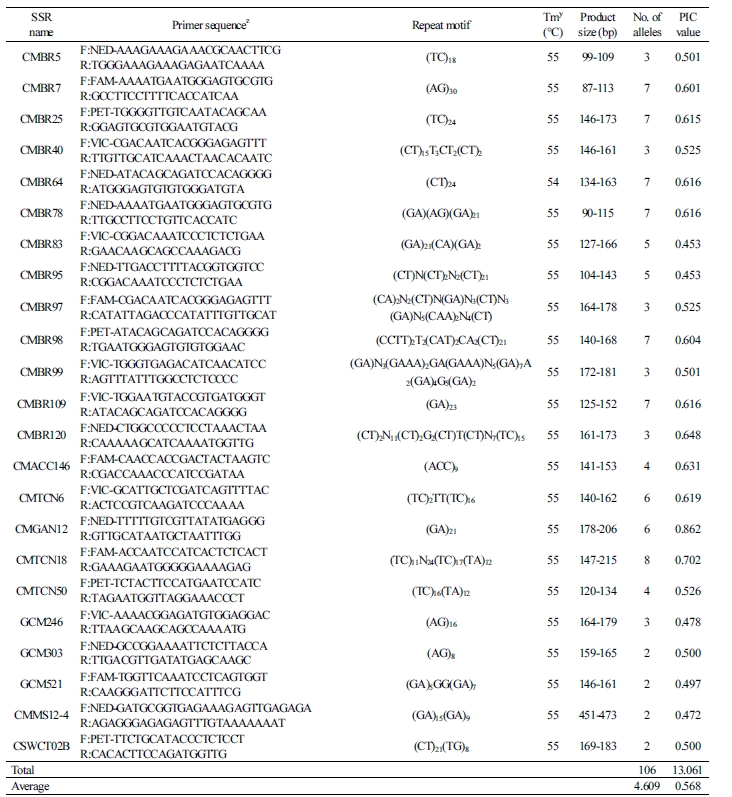
For the 23 genomic SSR markers, we detected a total of 106 alleles with an average of 4.61 alleles per marker in the cultivar collection (Table 3). The 11 genomic SSR markers detected over five alleles: CMBR83 and CMBR95 (five alleles); CMTCN6 and CMGAN12 (six alleles); CMBR7, CMBR25, CMBR64, CMBR78, CMBR98, and CMBR109 (seven alleles); and CMTCN18 (eight alleles). These genomic SSR markers showed the PIC values ranging from 0.453 (CMBR83 and CMBR95) to 0.862 (CMGAN12) (Table 3). In the study of Ritschel et al. (2004), 25 genomic SSR markers detected an average of 3.72 alleles per marker in a collection of 40 commercial melon cultivars. Aragão et al. (2013) found an average of 2.41 alleles per marker for 17 genomic SSR markers in 38 melon accessions representing different botanical groups. Park et al. (2013) reported seven genomic SSR markers to identify six oriental melon accessions. These markers only produced a total of 17 alleles with 2 to 3 alleles per marker. In contrast, we detected a considerably higher number of alleles per marker relative to the previous studies (an average of 4.61).
The EST-SSR markers are developed using coding sequences that are more conserved than noncoding sequences. Since the genomic SSR markers are often derived from noncoding genomic sequences, higher levels of polymorphism are expected in genomic SSR markers than EST-SSR markers (Guo et al., 2007; Hu et al., 2011; Mujaju et al., 2013; Tabbasam et al., 2013). However, both EST-SSR and genomic SSR markers used in this study showed comparable ranges for the PIC values. This result suggests that the resulting EST-SSR markers in this study are effective as genomic SSR markers to identify genetic variations in the oriental melon cultivars. The core set of 43 SSR markers (20 EST-SSR and 23 genomic SSR markers) in this study detected a total of 165 alleles with an average of 3.84 alleles per marker in our collection of 53 oriental melon cultivars. The average PIC value of these SSR markers was 0.553.
Genetic Diversity Analysis and Cultivar Identification
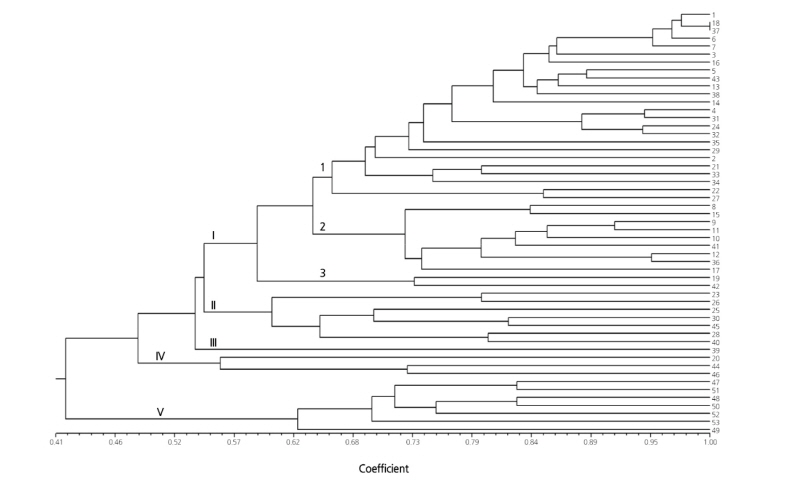
Three sets of SSR markers (20 EST-SSR, 23 genomic SSR, and all 43 SSR markers) were used to estimate genetic distances in the 53 oriental melon cultivars. The Mantel test showed a significant correlation (r = 0.767) between pairwise genetic distances from the EST-SSR and genomic SSR markers. However, different clustering patterns were observed with these two marker sets (Figs. 2 and 3). In the UPGMA dendrogram, the EST-SSR marker set divided the 53 cultivars into five clusters at Jaccard’s coefficients of 0.42 to 0.54 (Fig. 2). The largest cluster (cluster I) was further separated into three subclusters: I-1 (24 cultivars), I-2 (nine cultivars), and I-3 (two cultivars). The two cultivars ‘Geumnodajieuncheon’ and ‘Nonghyeopkkul’ were not separated in subcluster I-1. Clusters II and III consisted of seven cultivars and one cultivar, respectively. The cultivar in cluster III was ‘Jangchoonmuskkkul’ from the Jangchum seed company. The other cultivar, ‘Myeongmunplus’, developed by the same company, was grouped in cluster II. All seven cultivars collected from Gyeongsangbuk-do Agricultural Research & Extension Services (GARES) were found in a single cluster (cluster V).
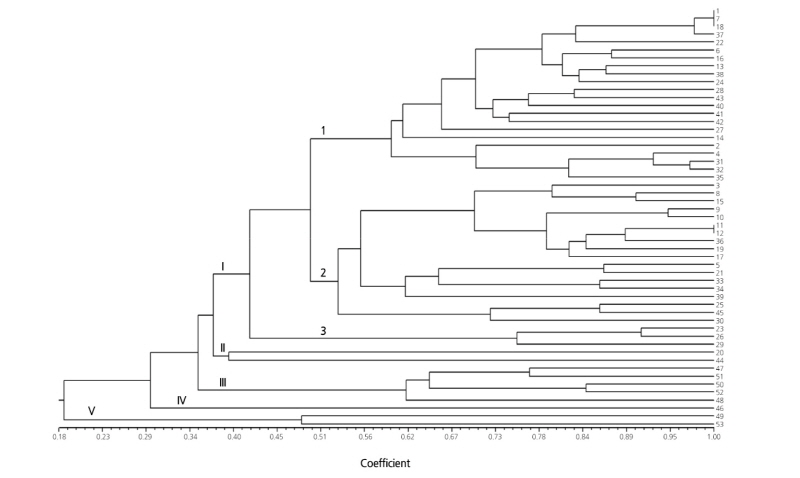
The 23 genomic SSR markers showed five major clusters at Jaccard’s coefficients of 0.19 to 0.37 (Fig. 3). The 43 cultivars in the cluster I were further divided into three subclusters: I-1 (22 cultivars), I-2 (18 cultivars), and I-3 (three cultivars). In subcluster I, the three cultivars ‘Geumssaragieuncheon’, ‘Jeongpum’, and ‘Geumnodajieuncheon’ were not separated. Additionally, ‘Bujakkul’ was not distinguished from ‘Chilseongkkul’ in subcluster I-2. Cluster II included only two cultivars, ‘Gayaggul’ and ‘Sarang’. These cultivars were clustered with the cultivar ‘Geumhong’ in the dendrogram based on the EST-SSR markers. The genomic SSR markers showed that cluster IV only had cultivar ‘Geumhong’. The seven cultivars from GARES were separated into cluster III (five cultivars) and cluster V (two cultivars).
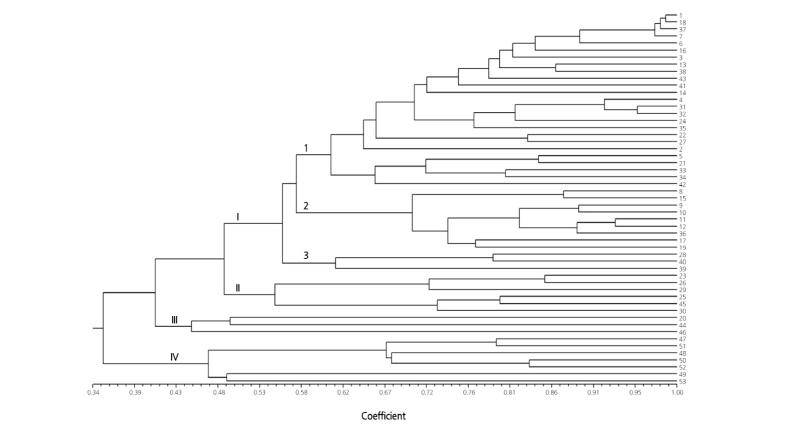
In contrast to the EST-SSR and genomic SSR marker sets, clustering analysis using all marker sets revealed four distinct clusters (Fig. 4). Cluster I consisted of 37 cultivars and the other clusters consisted of three to seven accessions. The three sets of SSR markers generated different dendrograms. This discrepancy was previously reported in other crop species and could be due to different genomic regions covered by both the markers and the variation in number of markers (Tabbasam et al., 2013; Parthiban et al., 2018). In addition, the EST-SSR markers are derived from expressed sequences compared to genomic sequences that are spread throughout the genome. The genomic SSR markers are often developed using the noncoding sequences, such as intron and intergenic regions. Using the combined set of 20 EST-SSR and 23 genomic SSR markers, we found that the 53 oriental melon cultivars were clearly differentiated, suggesting effectiveness of these SSR markers for cultivar identification and other applications in oriental melon breeding programs.
The use of molecular markers is an efficient strategy for detecting genetic variations in crop species. SSR markers are often used as markers for DNA profiling and cultivar identification in several vegetables, including pumpkin (Sim et al., 2016), tomato (Phan et al., 2016), and cucumber (Kwon and Choi, 2013). In this study, we generated the DNA profiles of 53 oriental melon cultivars using a core set of 43 SSR markers. These SSR markers showed fairly high levels of PIC values relative to the previous SSR markers reported in melon. Furthermore, our SSR markers were effective in separating all 53 oriental melon cultivars with narrow genetic backgrounds. Therefore, the core set of 43 SSR markers will be a valuable tool for protecting breeders’ intellectual property. Rapid progress in next-generation sequencing technologies has led to the discover of genome-wide single nucleotide polymorphisms (SNPs) in melon (Natarajan et al., 2016; Sim et al., 2018). Since the SNP markers provide a cost-effective method for high-throughput genotyping, use of SNP markers along with our SSR markers can leverage development of an advanced DNA profiling pipeline for cultivar identification and seed purity tests in oriental melon.
