

Introduction
Materials and Methods
Experimental conditions and crop growth management
Installation of environmental monitoring sensors
Measurement of crop growth variables
Statistical analysis
Results and Discussion
Day-night CO2 concentration changes in the greenhouse
Crop growth comparison
Crop yield comparison
Accumulated weekly CO2 concentration and crop growth rate
Conclusions
Introduction
Improving energy efficiency in controlled-environment agriculture is critical for reducing crop production costs and minimizing environmental impact. Greenhouse cultivation especially has high energy demands for heating, cooling, and other operations, resulting in significant greenhouse gas emissions that can negatively affect the environment. Among these factors, controlling carbon dioxide (CO2) levels within greenhouses is directly linked to crop photosynthesis efficiency. Therefore, developing sustainable energy management strategies is essential to enhance energy efficiency and mitigate environmental burdens.
CO2 is an essential factor for plant photosynthesis. Proper regulation of its concentration can significantly enhance crop growth and yield (Lawlor and Mitchell 1991; Rogers and Dahlman 1993; Byeon et al. 2023). Previous studies have primarily focused on utilizing CO2 generated from combustion of fossil fuels or industrial processes as a source for greenhouses. However, these methods face challenges related to cost increases and sustainability (Gruda 2005; Esen and Yuksel 2013). To address these limitations, recent efforts have explored the development and implementation of systems that can integrate heating and CO2 supply by combusting livestock waste such as manure (Fang et al. 2021; Shahid et al. 2021).
Livestock manure, an agricultural byproduct, has the potential to be utilized as a source of CO2 for greenhouse cultivation through combustion. Compared to traditional CO2 sources, manure combustion is gaining attention as a cost-effective and environmentally friendly alternative. This approach not only enables efficient use of biomass, but also addresses waste disposal challenges (Ekpo et al. 2016; Szymajda and Joka 2021). Additionally, heat energy generated during the combustion process can be repurposed for greenhouse heating, further enhancing energy efficiency (Huang et al. 2018; Cao et al. 2019).
The primary method of energy recovery from livestock manure is processing animal manure into pelletized solid fuel. However, during the combustion of manure-based solid fuels, various additional gases, such as nitrogen oxides (NOX), sulfur dioxide (SO2), and volatile organic compounds (VOCS), may be emitted alongside carbon dioxide (Park et al. 2013; Yoo and Park 2017; Thengane et al. 2019; Katsaros et al. 2021). According to previous studies, nitrogen oxides (NOX) produced during the combustion of livestock manure-based solid fuels induce oxidative stress in plant leaf tissues, resulting in decreased chlorophyll content and reduced photosynthetic efficiency (Sheng and Zhu 2019; Lobell et al. 2022). Sulfur dioxide (SO2) can induce physiological disorders, such as chlorophyll degradation and stomatal closure in leaf tissues, thereby decreasing crop growth and productivity (Muneer et al. 2014; Lee et al. 2017). Additionally, according to Cape (2023), volatile organic compounds (VOCS) have relatively low direct toxicity to plants; however, secondary pollutants produced through reactions between VOCS and NOX, such as ozone (O3) and peroxyacetyl nitrate (PAN), can cause severe physiological damage to plants (Park et al. 2013). Therefore, technologies are required for the purification of air pollutants generated during the combustion of livestock manure-based solid fuels, as well as for efficient carbon dioxide (CO2) capture. Recently, technologies utilizing wet scrubber processes have been developed to effectively mitigate air pollutants emitted during combustion processes and capture CO2, and research aimed at their commercialization is currently underway.
For effective supply of greenhouse-captured carbon dioxide using the developed technology, systematic and comprehensive analyses regarding the spatiotemporal distribution characteristics of carbon dioxide concentration within the greenhouse and the relationship between changes in carbon dioxide concentration and crop growth should be conducted beforehand. Therefore, this study was carried out to identify the distribution of CO2 concentrations at different positions within the greenhouse and to analyze the effects of variations in CO2 concentration on the growth rate and yield of paprika, thus establishing an efficient CO2 supply strategy for greenhouse cultivation.
Materials and Methods
Experimental conditions and crop growth management
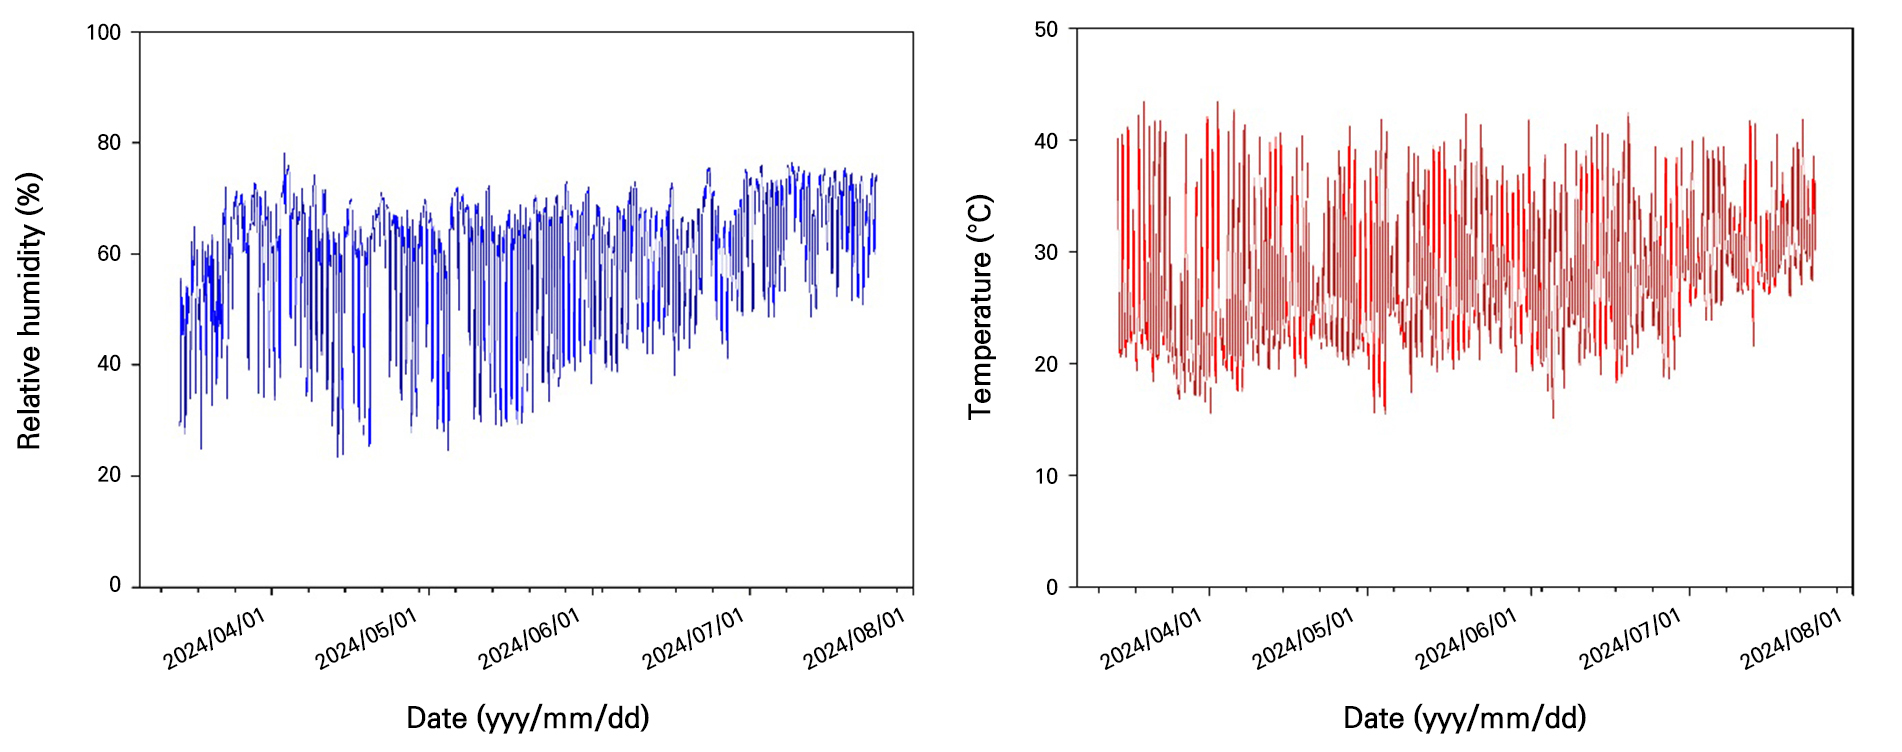
The experiment was conducted from February 21 to July 30, 2024, in a 5,200 m2 plastic multi-span greenhouse located in Bunam-myeon, Cheongsong-gun, Gyeongsangbuk-do, Korea (36.2°N, 129.1°E). The paprika (Capsicum annuum L.) cultivar used for this experiment was the red-colored variety ‘GINA’ (Syngenta Co., Swiss), and the substrate employed was coco-peat (Satis International Co., Ltd, Sri Lanka). Throughout the experimental period, the electrical conductivity (EC) of the nutrient solution supplied ranged between 2.0 and 4.5 dS·m-1, and the pH was maintained within the range of 5.8–6.2. Crop irrigation and greenhouse environmental management followed the conventional practices of the experimental farm. During the experiment, greenhouse temperatures ranged from 20 to 45°C with daily averages between 25 and 35°C, while relative humidity (RH) fluctuated between 40 and 90%, with daily average levels maintained at 60–80% (Fig. 1). Additionally, paprika plants were cultivated using the two-stem training method, and leaf pruning was conducted to maintain a constant leaf number of 20 per plant. Furthermore, supplemental CO2 was not separately supplied during this experiment in order to analyze the spatiotemporal distribution patterns of carbon dioxide within the greenhouse environment.
Installation of environmental monitoring sensors
To monitor environmental variables in a cultivation greenhouse, a total of 12 environmental monitoring systems were developed using Arduino Uno R3 boards (Arduino, Arduino LLC, Italy) and CM1107 carbon dioxide sensors (CM1107, Cubic Sensor and Instrument Co., Ltd., China). These sensors were installed in the greenhouse divided into two longitudinal sections (front and rear) and three lateral sections (left, center, and right). They were placed at both upper and lower parts of crops (Fig. 2A and 2B). Data were recorded every second using an SD storage module. Using Arduino Uno R3 boards (Arduino, Arduino LLC, Italy) and CM1107 CO2 sensors (CM1107, Cubic Sensor and Instrument Co., Ltd., China), 12 environmental monitoring systems were built. CO2 sensor readings were calibrated with correction equations obtained using a CO2 analyzer (Li-820, Li-Cor Inc., Lincoln, NE, USA). Final measurements were calculated based on these corrections (Table 1).
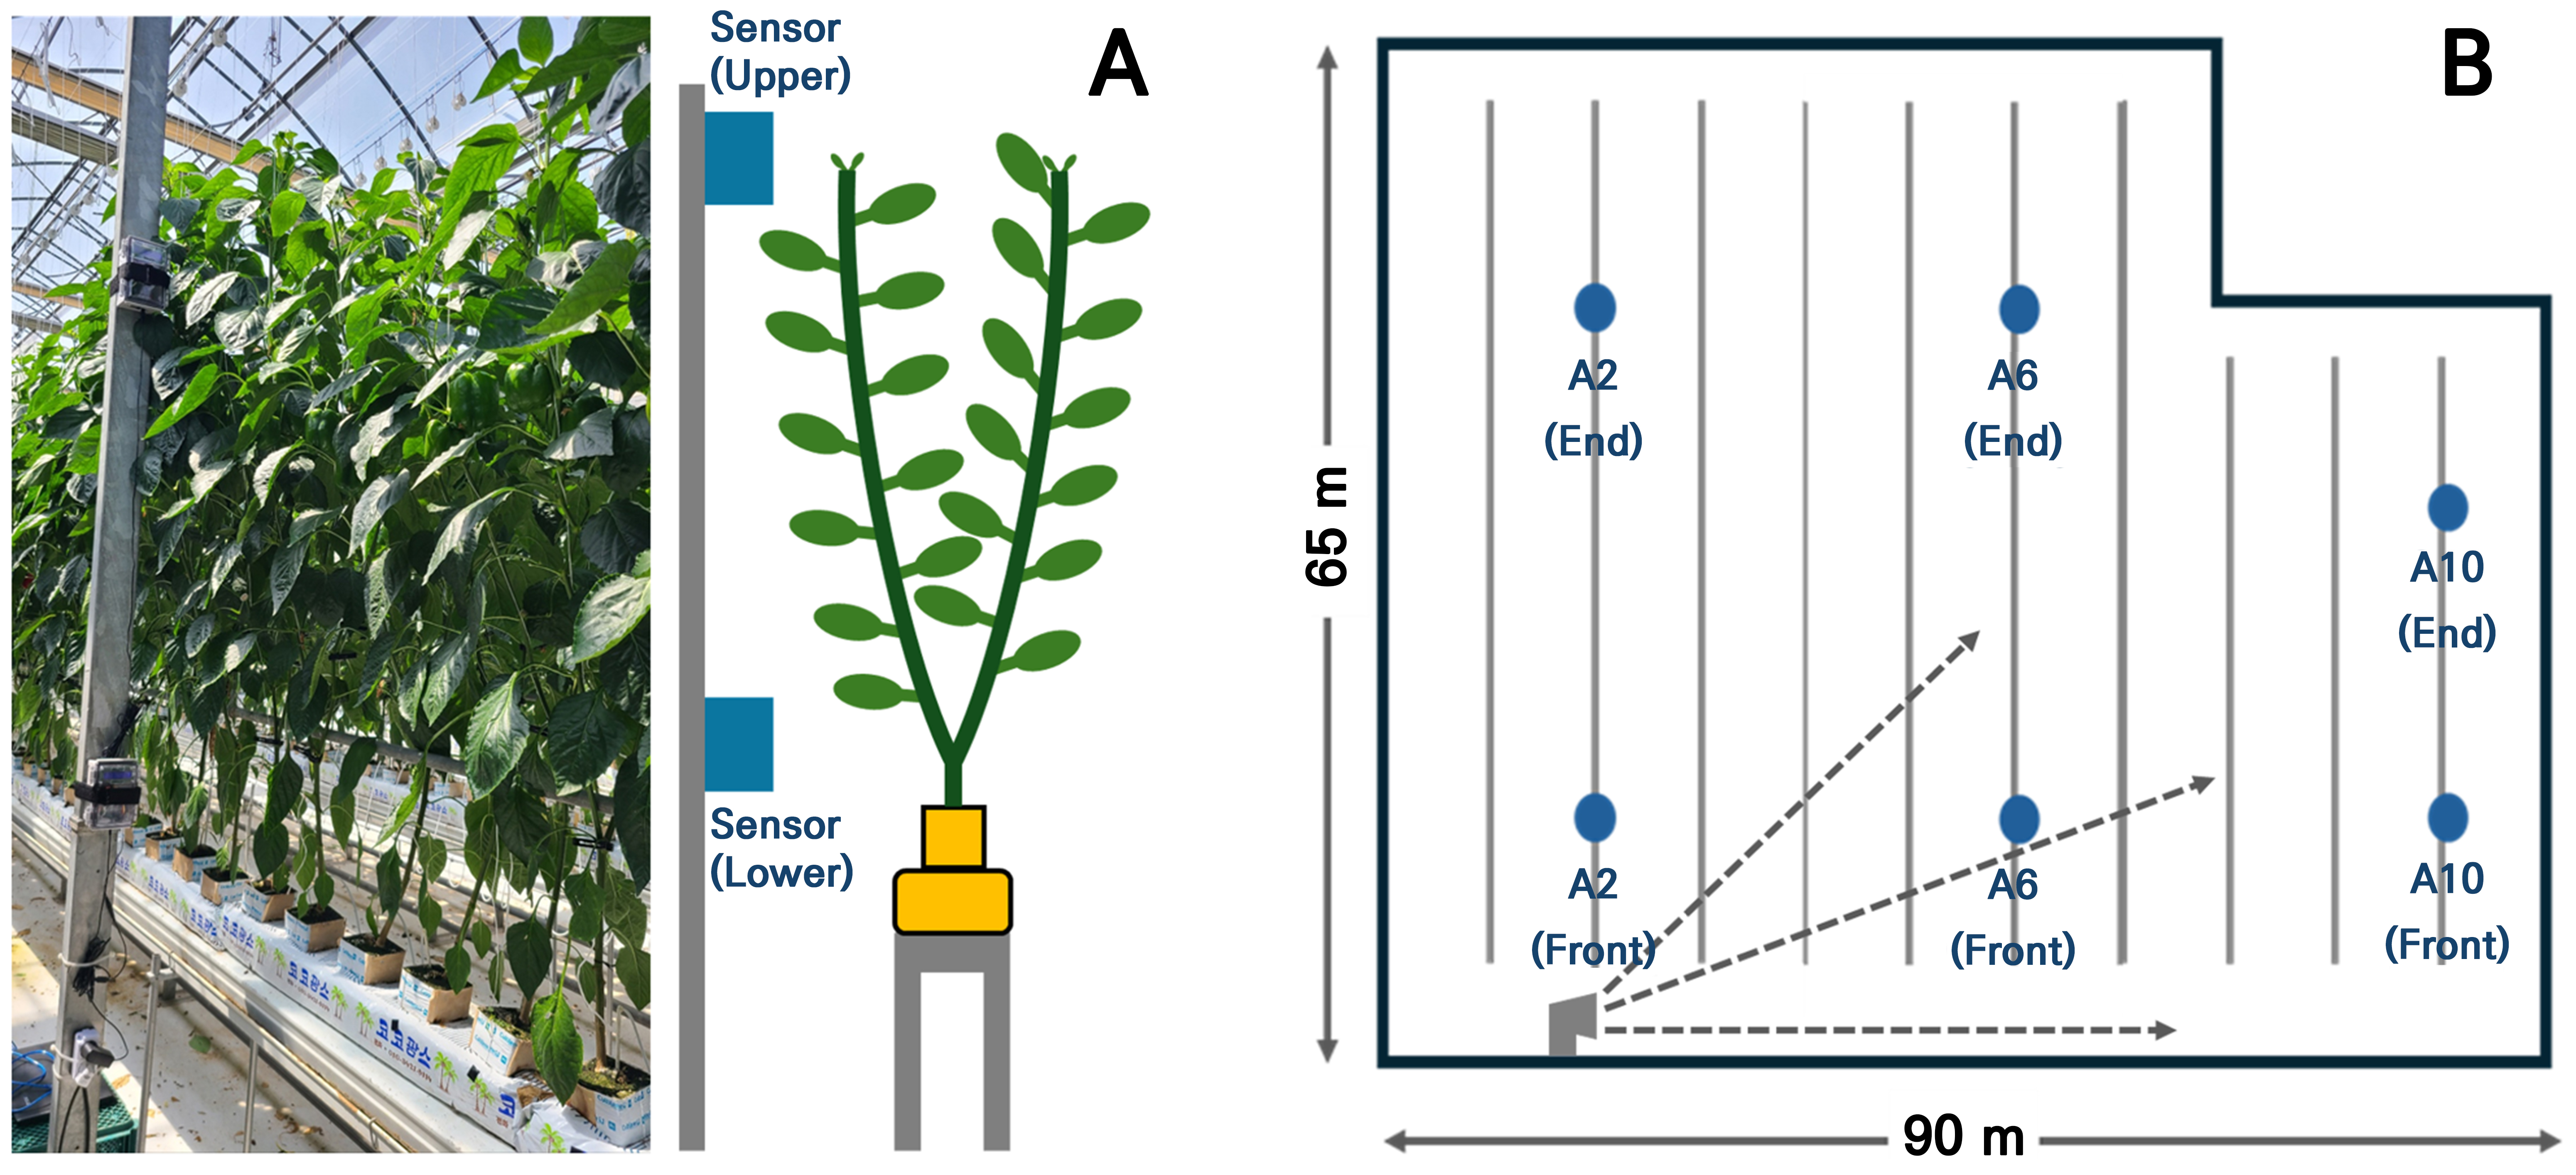
Table 1.
Calibration equation of carbon dioxide sensor used in the experiment
| Senso | Correction equation |
| A2Fz upper | CO2 = 1.1810 × sensor value ‒ 74.3615 |
| A2F lower | CO2 = 0.9437 × sensor value + 180.2582 |
| A2E upper | CO2 = 0.8392 × sensor value + 33.7303 |
| A2E lower | CO2 = 7.7674 × sensor value ‒ 11.3432 |
| A6F upper | CO2 = 0.8829 × sensor value + 152.8724 |
| A6F lower | CO2 = 0.7843 × sensor value ‒ 39.564 |
| A6E upper | CO2 = 0.9038 × sensor value + 48.4655 |
| A6E lower | CO2 = 0.8136 × sensor value + 20.1327 |
| A10F upper | CO2 = 0.8469 × sensor value + 21.0377 |
| A10F lower | CO2 = 0.8114 × sensor value ‒ 74.3615 |
| A10E upper | CO2 = 0.8457 × sensor value ‒ 40.4134 |
| A10E lower | CO2 = 0.8360 × sensor value ‒ 43.1978 |
zDetailed sensor positions are illustrated in Fig. 2B.
Measurement of crop growth variables
To compare growth of paprika, weekly measurements of plant height (from base to growth point), stem diameter (measured at the base using a digital vernier caliper, CD-20APX, Mitutoyo Co., Ltd., Japan), leaf count, and node count were taken from February 21, 2024 to July 4, 2024.
Statistical analysis
Crop leaf area and fresh weight by greenhouse location were analyzed using SAS version 9.4 (SAS Institute Inc., Cary, NC, USA) with triplicate measurements. Statistical significance was evaluated using Duncan’s multiple range test (p < 0.05). Non-linear regression curves and graphs were generated using SigmaPlot 12.5 (Systat Software Inc., USA).
Results and Discussion
Day-night CO2 concentration changes in the greenhouse
During the early growth stage, daytime CO2 concentrations dropped sharply between 7:00 AM and 9:00 AM, from 400 to 1200 µmol·mol-1 in the upper section and from 300 to 1000 µmol·mol-1 in the lower section (Fig. 3A). This rapid decline in atmospheric CO2 concentration could be attributed to active crop photosynthesis following sunrise as plants could quickly absorb CO2 from the air. In the mid-growth stage, CO2 concentrations decreased from 500 to 1100 µmol·mol-1 in the upper section and from 400 to 900 µmol·mol-1 in the lower section. However, the reduction was less pronounced compared to the early growth stage (Fig. 3C). This trend can be interpreted as results of increased plant biomass and improved ventilation, which facilitated air exchange between the greenhouse and the external environment, stabilizing CO2 levels. In the late growth stage, CO2 concentrations stabilized at 400 to 600 µmol·mol-1 in the upper section and 300 to 500 µmol·mol-1 in the lower section (Fig. 3E). Compared to sharp declines observed during the early growth stage, these results indicate a more stable CO2 variation pattern. Additionally, during the mid and late growth stages, crop photosynthetic efficiency likely reached its peak, limiting further CO2 absorption.
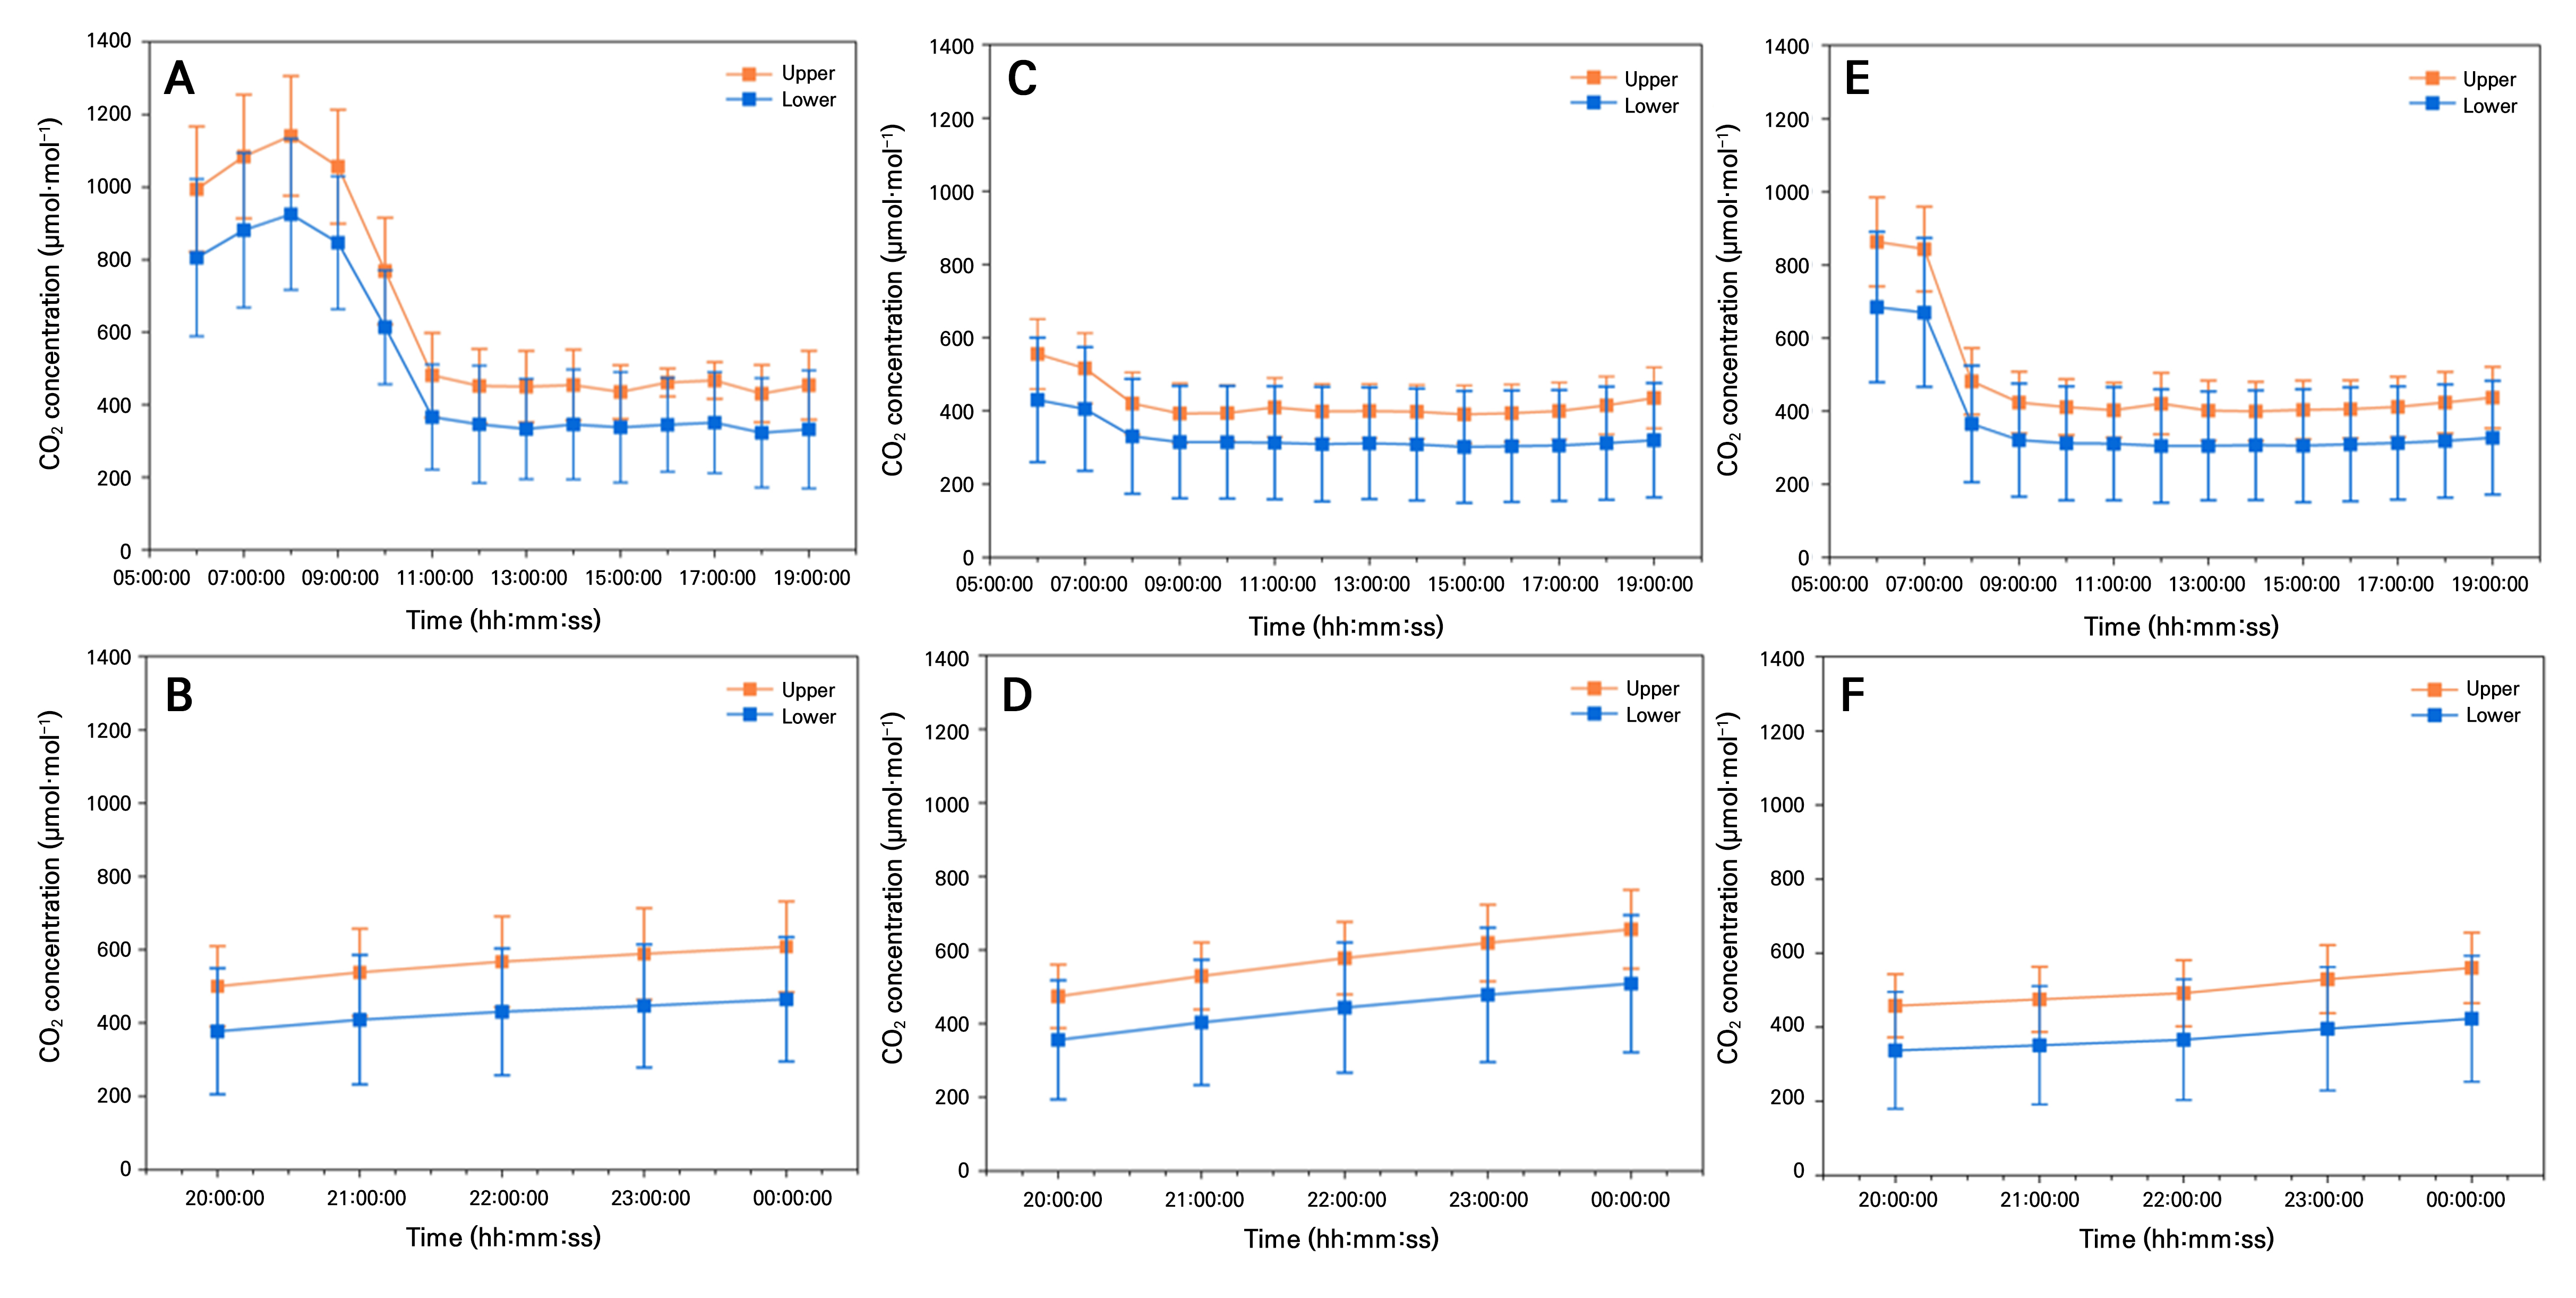
During the early growth stage, nighttime CO2 concentrations in the upper section of the greenhouse increased gradually between 6:00 PM and 12:00 AM, ranging from 600 to 700 µmol·mol-1, while the lower section ranged from 400 to 500 µmol·mol-1 (Fig. 3B). In the mid-growth stage, the upper section reached 700–800 µmol·mol-1 and the lower section rose to 500–600 µmol·mol-1, showing a similar increasing pattern to the early stage (Fig. 3D). Additionally, during the late growth stage, nighttime CO2 concentrations increased further, reaching 800–900 µmol·mol-1 in the upper section and 600–700 µmol·mol-1 in the lower section (Fig. 3F). Overall, nighttime CO2 concentrations tended to increase gradually as crops grew.
This trend could be interpreted as a result of photosynthesis ceasing at night, allowing CO2 released through plant respiration to accumulate inside the greenhouse. In particular, the increase in nighttime CO2 concentrations was relatively small during the early growth stage. However, as plants progressed to mid and late growth stages, their increased biomass and corresponding rise in respiration rates might have contributed to higher nighttime CO2 concentrations in the greenhouse.
Crop growth comparison
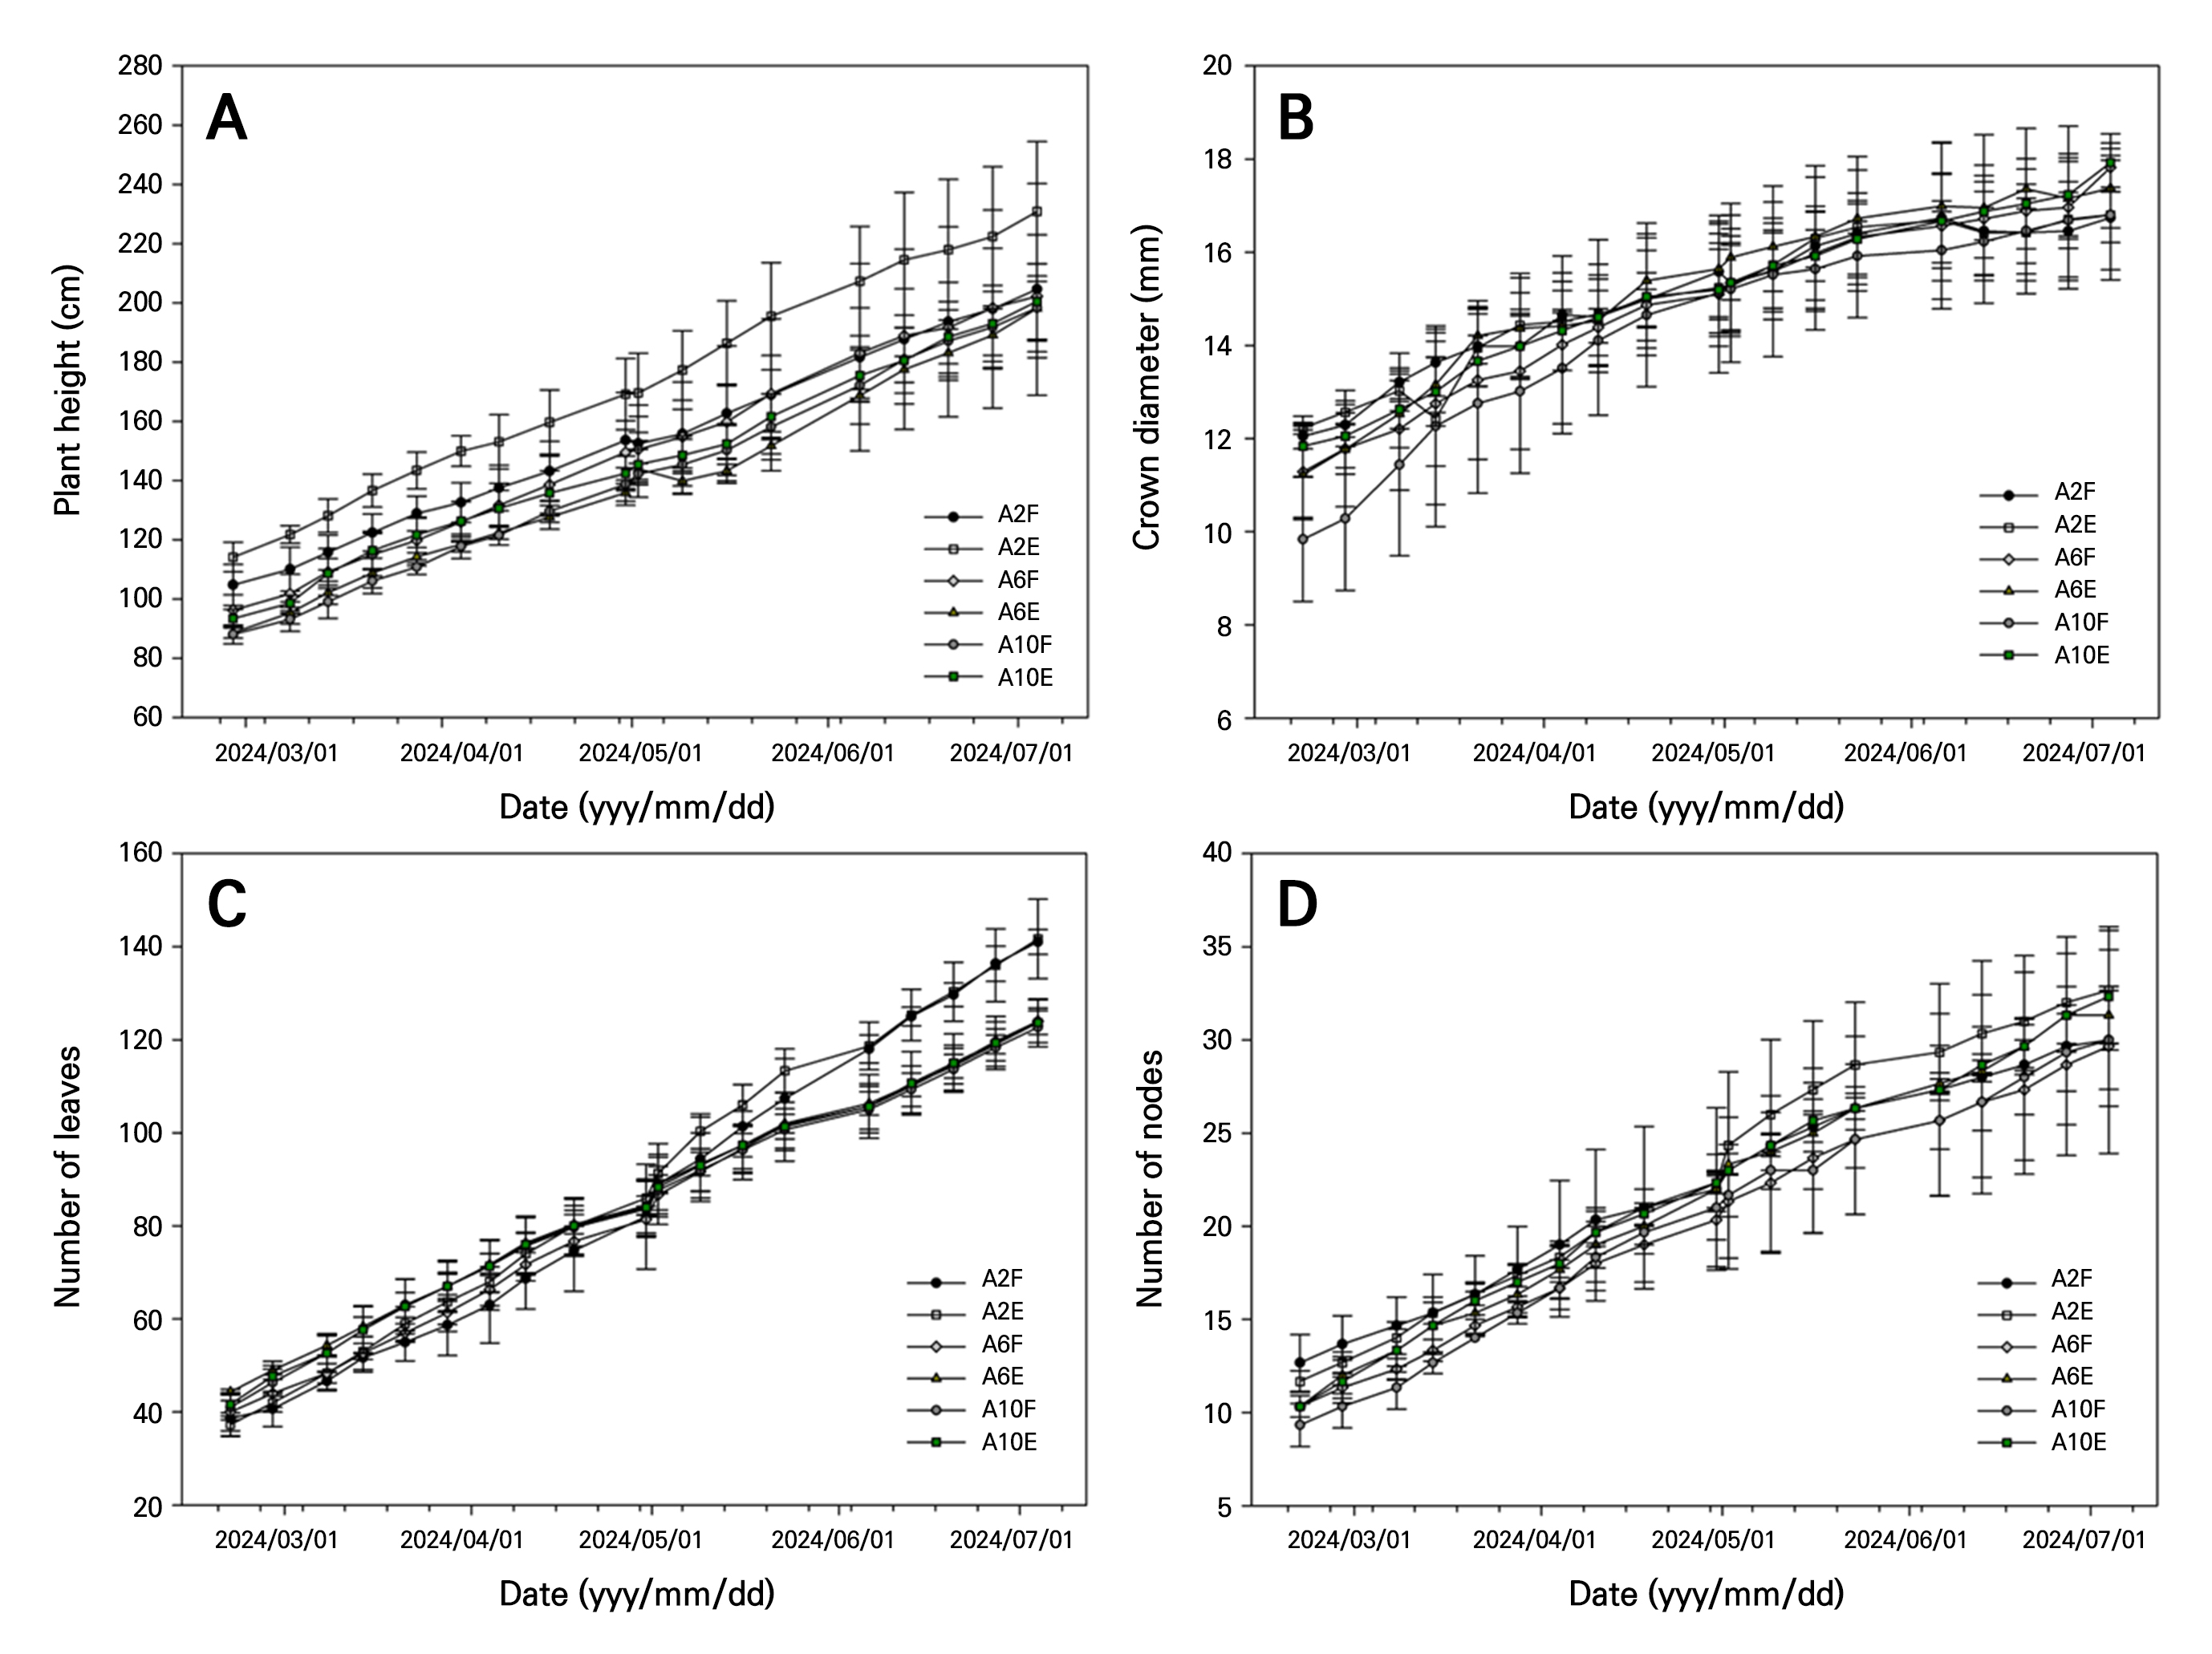
Growth characteristics (plant height, stem diameter, number of leaves, and number of nodes) of crops in the greenhouse generally showed a continuous increasing trend across all locations during the experimental period (March 1, 2024–July 1, 2024). However, the growth tended to be higher in A2F and A2E locations than in other positions within the greenhouse (Fig. 4A–4D). At the end of the experiment, a plant height of 260 ± 8 cm, a stem diameter of 19 ± 1.34 mm, number of leaves of 141 ± 2.65, and number of nodes of 30 ± 6.08 were found for the A2F location, indicating a relatively higher growth rate than in other positions within the greenhouse.
These differences in crop growth are believed to be due to variations in microclimatic variables depending on the location within the greenhouse. Nomura et al. (2021) have reported that as cumulative CO2 concentration increases, photosynthetic efficiency improves, leading to an increase in aboveground growth. A similar trend was observed in this study, consistent with previous research findings. Wagner and Ter-Mikaelian (1999) have reported that an increase in root collar diameter can enhance the transfer of water, nutrients and assimilate between roots and aboveground parts, positively influencing shoot growth. The spatial distribution of microclimatic variables varies depending on the location within the greenhouse (Vermeulen 2014; Kozai et al. 2015; Hidaka et al. 2022). These differences are known to affect photosynthesis and metabolism, ultimately impacting crop growth. Crop growth characteristics observed at the A2F location are considered to reflect the influence of localized microclimatic conditions.
Crop yield comparison
Cumulative daily average CO2 concentration, leaf area, and biomass varied significantly among different greenhouse locations (A2F, A2E, A6F, A6E, A10F, A10E) (Table 2). The cumulative daily average CO2 concentration at the A2F location was 71,478.14 µmol·mol-1, which was higher than those at other locations. Additionally, the leaf area and biomass at A2F were 14,416.08 ± 256.36 cm2 and 1,015.77 ± 96.81 g, respectively, showing statistically significant differences compared to A6F and A6E locations (Table 2).
Table 2.
Cumulative daily average CO2 concentration, leaf area, and fresh weight of crops according to location in the greenhouse
| Location | Cumulative daily average CO2 concentration (µmol·mol-1) |
Leaf area (cm2) |
Fresh wight (g) |
| A2F | 71480 | 14420 ± 260 az | 1016 ± 97 a |
| A2E | 51410 | 14230 ± 450 ab | 961 ± 51 ab |
| A6F | 43420 | 13510 ± 330 b | 796 ± 75 b |
| A6E | 46900 | 13580 ± 660 b | 789 ± 91 b |
| A10F | 56470 | 14380 ± 350 a | 956 ± 103 ab |
| A10E | 51330 | 14580 ± 220 a | 952 ± 129 ab |
At the A2F location, higher cumulative daily average CO2 concentration, leaf area, and biomass were observed. They might have accelerated crop growth by increasing carbohydrate accumulation due to enhanced photosynthetic rates. High CO2 concentration distribution can activate photosynthetic reactions, promoting leaf area expansion and biomass increase through somatic cell division and cell expansion (Thongbai et al. 2010; Xu et al. 2014; Yildiz 2021). On the other hand, low CO2 concentration in the greenhouse can limit carbohydrate production due to a lack of available carbon supply for photosynthetic reactions, potentially restricting crop growth. CO2 distribution within a greenhouse is influenced not only by CO2 concentration itself, but also by various physical and environmental factors, such as greenhouse structural layout, ventilation fan placement, and circulation fan positioning, which can interact with each other (Panwar et al. 2011; Kuroyanagi et al. 2014). These findings hold significant implications for greenhouse environmental management strategies. Rather than concentrating CO2 supply in specific areas, optimizing airflow can help growers create a more favorable growth environment for crops (Pasgianos et al. 2003; Yogev et al. 2016).
Accumulated weekly CO2 concentration and crop growth rate
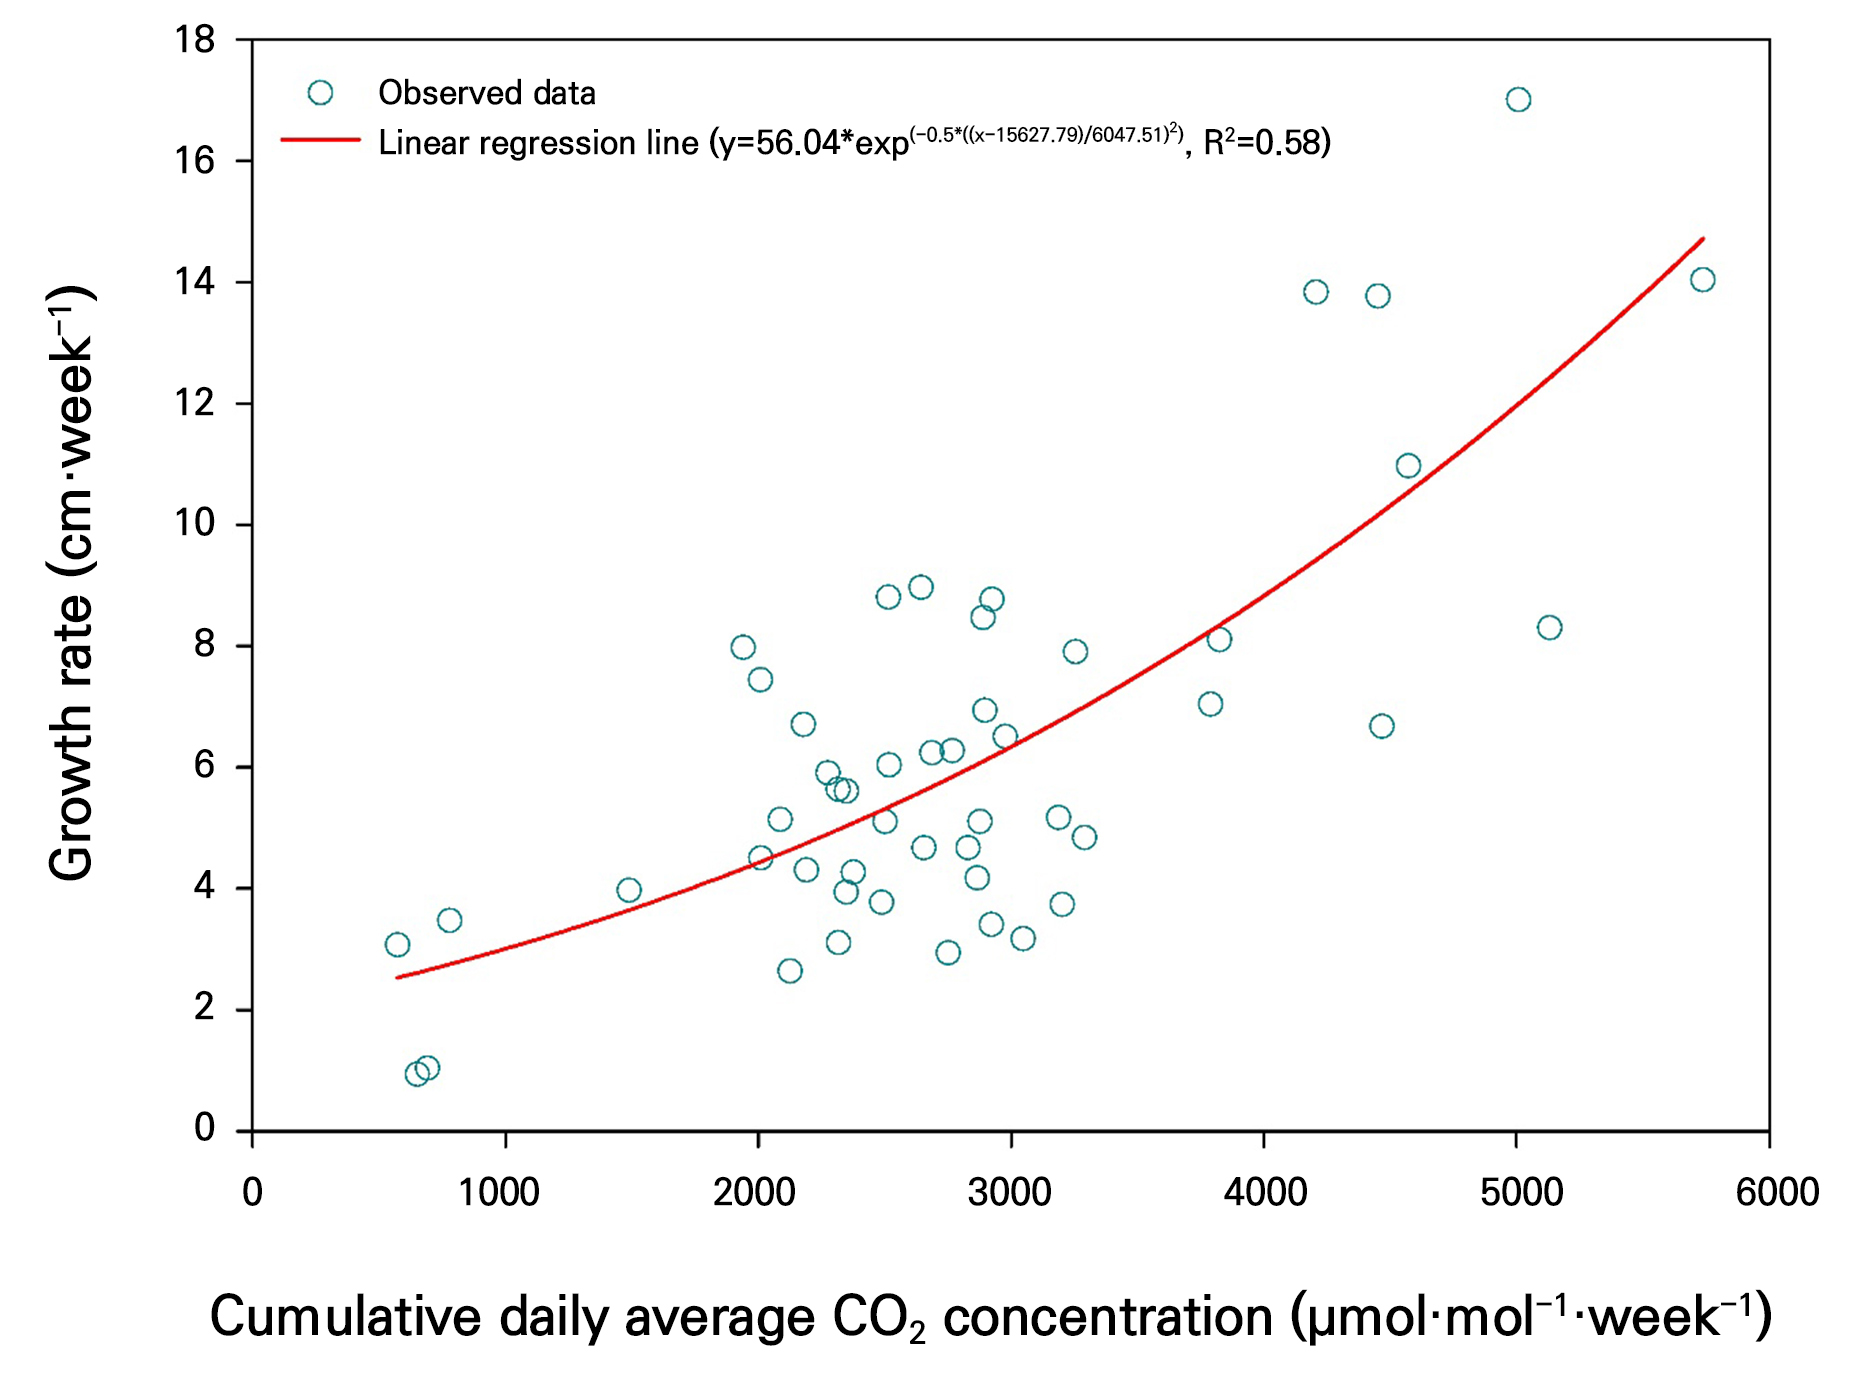
Plant height exhibited a linear increase as the cumulative CO2 concentration increased (Fig. 5). This suggests that the accumulated carbon supply over time positively contributes to photosynthetic activity and cell elongation. The change in crop growth rate in response to the weekly cumulative CO2 concentration change rate showed the highest curve fitting (R2 = 0.58) in the Gaussian peak model. Additionally, as weekly cumulative CO2 concentration change rate increased from 1,000 to 5,000 µmol·mol-1, the growth rate rose from 3 cm to over 14 cm (Fig. 6). The Gaussian peak model can explain the distribution pattern in which growth rate reaches its maximum within a specific range of change rates (Motulsky and Christopoulos 2004). Plant height is determined by the accumulation of growth rate over a given period. Furthermore, by strategically utilizing various patterns of weekly cumulative CO2 concentration change rates, it might be possible to establish more efficient crop growth strategies.

Conclusions
Differences in cumulative CO2 concentration and microclimatic conditions within a greenhouse could significantly influence crop growth and productivity. Higher cumulative CO2 concentrations can enhance photosynthetic efficiency, promoting above-ground crop growth. Additionally, crop growth rates exhibited a linear increase with rising cumulative CO2 concentrations. The relationship between weekly cumulative CO2 concentration and crop growth rate followed a Gaussian peak pattern, where growth reached its maximum within a range of changes in CO2 concentration. These spatial and temporal distribution characteristics of CO2 concentration observed in this study with corresponding crop growth and productivity data can serve as a foundation for developing effective greenhouse environmental management strategies
