

Introduction
Materials and Methods
Fruit materials
Estimation of internal browning
Fruit nutrients analysis
Statistical Analysis
Results and Discussion
Effect of storage time on browning disorder incidence
Macro nutrient response to browning disorder
Correlation between nutrient contents and browning disorder severity level
The K/Mg ratio as a predictor of the level of browning disorder severity
Introduction
Pears (Pyrus spp.) develop physiological disorders after low-temperature storage (Franck et al., 2007). The affected fruits appear healthy and intact but have a brown core or cavities in the flesh (Melado-Herreros et al., 2013). Therefore, this disorder results in unexpected economic losses. Various terms such as brown heart, brown core, core browning, core breakdown, and internal breakdown have been used to describe browning disorders owing to the similarity of the symptoms (Franck et al., 2007; Larrigaudiere et al., 2004). The symptoms of browning disorder are browning and the presence of water-soaked tissue in the flesh and core. These were found to be a consequence of membrane damage, oxygen free radical action, and a lack of ATP (Veltman et al., 2003). The intercellular breakdown is related to cell deformation and cell decompartmentalization (Chun et al., 2003), and the intercellular spaces in the fluid-filled tissues have been shown to accumulate sorbitol and glycolipids (Gao et al., 2005). The incidence of each kind of internal browning has been correlated with the activity of enzymes involved in fermentative and oxidative metabolisms (Larrigaudiere et al., 2004).
Development of internal browning during stone fruit storage depends on a range of factors such as fruit maturity (Bowen and Watkins, 1997; Li et al., 2011), temperature during the growing seasons (Ferguson et al., 1999; Sakuma, 2003; Zerbini et al., 2002), or temperature and carbon dioxide interaction (Watkins and Liu, 2010). Mineral nutrient distribution in developing fruits is the most frequently discussed cause of physiological disorders in post-harvest fruits, of which calcium (Ca) deficiency is the most common factor (Fallahi et al., 1997; Franck et al., 2007). Apples harvested from light-cropping trees are larger and more susceptible to browning disorders, and have lower Ca contents because the movement of minerals into fruit is affected by the crop load (Crisosto et al., 1997; Ferguson and Watkins, 1992; Tough et al., 1998; Van der Boon, 1980). However, the opposite effects on Ca contents and the bitter pit incidence level have also been observed regarding crop load (Ferguson and Watkins, 1992). Superficial scald of apples negatively correlates with Ca content, but calcium treatment does not always reduce the browning disorder occurrence (Moor et al., 2006). Calcium treatment administered by applying calcium paste on the pedicel before harvest (Tanaka et al., 1992) or by dipping fruit at harvest in a calcium chloride solution (Mahajan and Dhatt, 2004) can effectively reduce the occurrence of browning disorder. But the study of fruits from a sequential harvest date showed that only the initial development of browning symptoms appears to be associated with the calcium concentration (Bowen and Watkins, 1997). In ‘Niitaka’ pears, watercore resulted mainly from delayed harvest and showed no direct correlation with the calcium content (Cho et al., 2010).
Asian pears are popular because of their crispy texture; thus, softened and browning flesh reduces the value of these fruits. Browning disorders have been found in several Japanese pear cultivars (Cho et al., 2010; Lee et al., 2007; Li et al., 2011; Zhang et al., 2009; Zhou et al., 2008), and in a new Taiwanese cultivar ‘Taichung No. 2’. In this study, we analyzed the nutrient components of ‘Taichung No. 2’ pears, including nitrogen (N), phosphorus (P), potassium (K), calcium (Ca), and magnesium (Mg) contents, and examined the relationship between nutrient contents and internal browning incidence in order to provide a basis for the further improvement of Asian pear management practices.
Materials and Methods
Fruit materials
In 2010 and 2011, fruits grown in 22 orchards located in 7 villages and towns of the Changhua, Taichung, and Miaoli counties in Taiwan were harvested following the commercial standard (average fruit weight and height were 460 g and 85.8 mm, respectively, and fruit diameters were in the range of 94.0-95.2 mm). These 22 orchards were conventionally cultivated and had 5-7-year-old pear trees fertilized with commercial chemical fertilizers. The annual average temperature, average relative humidity, and total annual precipitation in the 22 orchards were 21.5°C, 78%, and 947 mm, respectively. Forty fruits were collected from each orchard each year and stored at 2°C for 0, 2, 4, 6, or 8 weeks. The severity of the internal browning of fruit flesh (levels 0-4), and N, P, K, Ca, and Mg contents were determined in different parts (peel, flesh, and core) of 8 fruits from each orchard for each storage period.
Estimation of internal browning
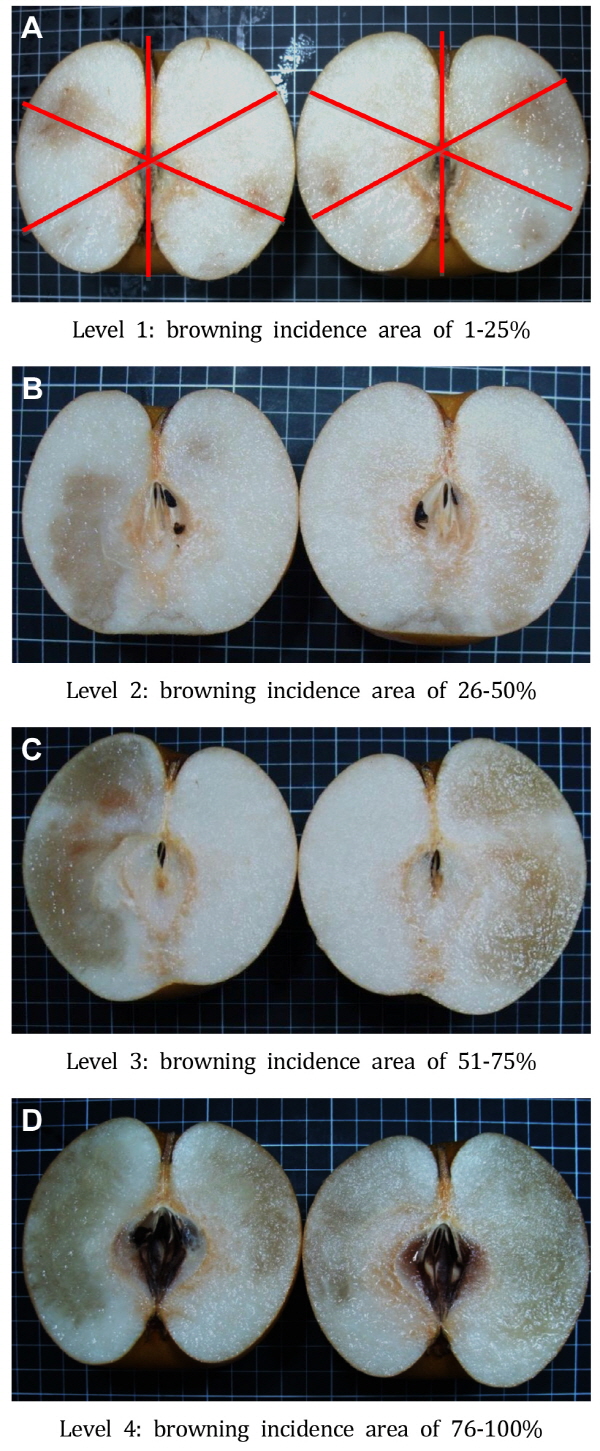
The browning disorder severity was determined by cutting the fruit longitudinally. The cross section of the fruit flesh was divided into 12 segments in order to evaluate the severity according to the proportion of brown flesh. The browning disorder severity was classified as 0, 1, 2, 3, and 4 if the total browning area accounted for 0%, 1-25%, 26-50%, 51-75%, and >75% of the sectional flesh area, respectively (Fig. 1).
Fruit nutrients analysis
The peel (thickness of 0-2 mm), core, and flesh of 1/4 fruit segments were separated and the individual samples were dried at 80°C until a constant dry weight was achieved. The dry samples were ground into powder and passed through a < 40 mesh for nutrient analysis. The Kjeldahl method was used for N analysis. To analyze P, K, Ca, and Mg levels, ash samples were obtained using the high-temperature ashing method, and 1.2 N HCl extracts were used for sub-sequent analyses. The ammonium molybdate ascorbic acid method (absorbance measured at 600 nm) was used for phosphorus analysis and atomic absorption spectroscopy was used to determine the absorbance of K, Ca, and Mg at 766.5 nm, 422.7 nm, and 285.2 nm, respectively.
Statistical analysis
The experiments to determine the effect of the storage period length were carried out in duplicate for each orchard and the browning disorder severity level for each storage period was determined based on the average value of 8 fruits. To determine the relationship between nutrient content and browning disorder, the average content from 2 to 8 fruits (depending on the number of fruits available for each severity level in each orchard) with the same browning disorder severity level was used as a replicate. Two-way ANOVA with a completely randomized design was used to analyze the statistical significance of the year and browning disorder severity level. The least significant difference multiple range test was used to compare the nutrient contents for each severity level and year. Liner regression and the Pearson correlation coefficient were used to test the relationships between nutrient contents and severity levels. The data were analyzed using the Statistical Analysis System software (SAS; SAS Institute Inc., Cary, NC, USA) and graphs were created using SigmaPlot 11 (Systat Software, Inc., San Jose, CA, USA).

Results and Discussion
Effect of storage time on browning disorder incidence
The results from our two-year study suggest that browning disorder was present in ‘Taichung No. 2’ pears stored at 2°C for 2 weeks, and the condition did not worsen after continuous storage for up to 8 weeks (Fig. 2). This suggests that physiological browning disorder appeared within 2 weeks and that prolonged storage did not increase browning severity in fruits that did not exhibit symptoms initially, which showed near constant characteristics. Consequently, browning disorder levels could be determined by examining the stored fruits after 4 weeks. Therefore, in this study, fruits stored for 6 weeks were analyzed to examine the relationship between nutrient levels and browning disorder incidence.
Macro nutrient response to browning disorder
The contents of N, P, K, Ca, and Mg were analyzed in different parts of fruit, different severity levels and different years in this study. The N content in the core and flesh did not vary among the different browning severity levels, but the content in the different fruit parts was different between the two years (Table 1). Results of the mineral ion contents, including K, Ca, and Mg, are shown in Table 1. Phosphorus is an important component of cell plasma membranes, and browning disorder might be related to cellular degradation due to cell membrane damage (Chun et al., 2003; Veltman et al., 2003). Calcium deficiency is considered to be a key factor causing storage disorders in apples and pears, and modified cultivation techniques have been applied to decrease the incidence of browning disorders (Crisosto et al., 1997; Volz et al., 1996) such as bitter pit in apples (Fallahi et al., 1997), cork spot in pears (Raese and Drake, 1995), or fruit softening in papaya (Paull et al., 1999). Calcium deficiency has also been con-sidered to be a possible cause of watercore in apples and pears (Tanaka et al., 1992).
Different to previous study, the experimental results obtained from our two-years study showed that fruits with higher browning severity levels had a significantly higher Ca content in the flesh, whereas no relevant variation in Ca content was observed during the two years of investigation in the peel and core tissues (Table 1). Thus, the correlation between Ca content in fruits and browning incidence severity remains to be clarified. Ca content in pear fruits was not significantly higher when the fruits were planted on volcanic soils instead of on alluvial soils (Gemma et al., 2002). On the other hand, reduced browning incidence was observed in fruits treated with EDTA-Ca as a paste on the pedicel; however, application by spraying was ineffective (Tanaka et al., 1992). Late-harvested fruits exhibited more severe browning symptoms and their Ca contents were relatively high (Kuo et al., 2006). Taken together, these studies indicate that the lack of Ca is not the main reason for watercore, and there is not a constant relationship between Ca content and the browning severity level.
Correlation between nutrient contents and browning disorder severity level
We also investigated the correlation of each contents included N, P, K, Ca, and Mg with the browning disorder severity levels. Nitrogen content in the peel was positively correlated to the browning severity level, and the correlation coefficient was 0.174 (Table 2). But the content of N content was not constant in two-year experiment (Table 1). This indicates that N content is not a good index for predicting browning severity. There was no significant correlation between N content and the severity levels in other parts of the fruits (Table 2). The P content of browning severity levels were not correlated in most fruit tissues in the two sampling years (Table 2). With the results showed in Table 1, it seems to show that P content is not the critical nutrient stood for browning disorder. Through Ca content was wide discussed with browning disorder (Gemma et al., 2002; Kuo et al., 2006; Tanaka et al., 1992) it showed little significant in our research.
In ‘Taichung No. 2’ pears, only Ca content in the fruit flesh showed a constant positive correlation with browning disorder severity in the two sampling years. Therefore, we considered that Ca deficiency is not the definite cause of browning disorder incidence. During the early stage of ‘Niitaka’ pear fruit growth, spraying with CaCl2 increased the development of more stone cells in the flesh tissue (Lee et al., 2007). However, the stone cells separated and appeared disorganized in the browning tissue (Chun et al., 2003; Kuo et al., 2006). This could be one of the reasons explaining the higher Ca contents observed in more severely damaged fruits in our study.
Besides Ca content, a higher K content in the peel was accompanied by more severe browning disorder (Table 1). However, K contents in the flesh and core had no effect on the browning disorder severity. The K content in the peel was positively correlated to the browning severity (Table 2). Emongor et al. (1994) also reported that high K content increased fruit susceptibility to browning incidence during apple storage. The correlation between K content in the peel and browning severity was 0.766. Although the correlation coefficient was high enough to imply that K content might be a good indicator of the browning severity level, the range of K content suggested otherwise and showed that K content is not useful to predict the browning severity level. Mg is antagonistic to Ca in fruit nutrition, although Mg treatment was found to be effective for reducing the incidence of Ca-related disorders (Yuri et al., 2002). The variations in Mg content in the peel and core were significantly different at each browning severity level (Table 1), but Mg content in the peel was not correlated with the severity level (Table 2). Fruits with more severe browning disorder had a lower Mg content in each fruit part. The significant negative linear relationship is indicative of the severe browning incidence observed in pears with low Mg content (Table 2). Nevertheless, K and Mg content varied depending on the year and, consequently, so did the correlation with browning disorder.
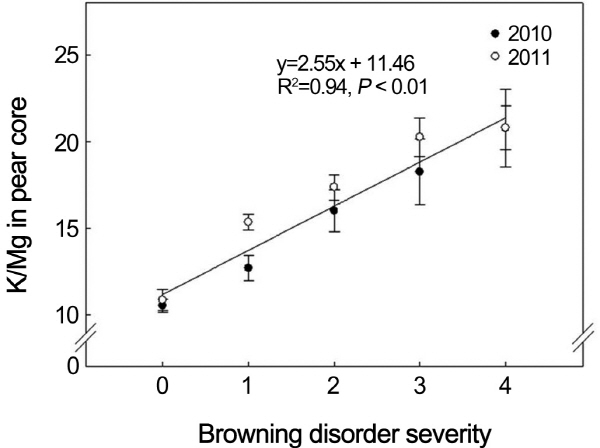
The K/Mg ratio as a predictor of the level of browning disorder severity
Ca, K, and Mg are involved in maintaining membrane stability and ion transportation. The interactions between Ca, K, and Mg on browning disorders have showed inconsistent effects. Since K and Mg contents in the peel varied in the two sampling years, we used the ratio of K content to Mg content (the K/Mg ratio) to evaluate the browning disorder in ‘Taichung No. 2’ pears. The K/Mg ratio in all fruit tissues was positively correlated to the browning severity level (Table 2). Unlike the year-dependent variations in K and Mg contents, the range of the K/Mg ratio was relatively stable. The ratio ranged from 10 to 20 and was strongly positively correlated to the browning disorder severity level (r2 = 0.94, p < 0.01) (Fig. 3). The concentration of Mg and K provided a more accurate measurement of the effect of mineral concentrations on bitter pit incidence in apples (Ferguson and Watkins, 1992). The browning disorder in apples correlated not only negatively to Ca contents but also positively to the K/Ca and Mg/Ca ratios (Moor et al., 2006). Our results demonstrate that the K/Mg ratio is the best index to predict the browning severity in Asian pears after cold storage. Hence, we recommend the use of this ratio as a predicting factor. This means that growers should monitor the stored fruit quality carefully when the K/Mg ratio of the peel is higher than 10 (which corresponds to a severity level of 2).
In our investigation, ‘Taichung No. 2’ pears started to develop browning disorder symptoms after 2weeks of storage at 2°C. Pears with a high browning disorder level had high Ca and K contents in the fruit flesh and peel, respectively. The Mg content in pear fruits was negatively correlated to the browning disorder severity level. Never-theless, none of the single nutrient contents could effectively predict browning disorder. N and P contents of pears were poorly related to the browning disorder severity level. Mineral contents, including K, Ca, and Mg, were correlated to the browning disorder severity level in the different fruit tissues and years. However, the contents of these nutrients were inconsistent in the two sampling years. Only the K/Mg ratio showed a consistent and strong positive linear correlation with the browning disorder severity levels. Thus, the K/Mg ratio could be an effective predictive index of the browning disorder severity in ‘Taichung No. 2’ pears.
