

Introduction
Materials and Methods
Data Collection
Description of Nutrient Expert System
On-farm Validation
Calculations
Statistical Analysis
Results
Soil Indigenous Nutrient Supply
Yield Response and Relative Yield
Agronomic Efficiency
Relationship between YR and Indigenous Nutrient Supply
Relationship between YR and RY
Correlation between YR and AE
On-farm Validation of the NE Approach for Lychee
Discussion
Soil Indigenous Nutrient Supply
YR and AE
Evaluation of NE Approach for Lychee Production
Introduction
Lychee (Litchi chinensis Sonn) originates in China and has been cultivated there for at least 2,100 years. This fruit is very popular because of its attractive appearance, pleasant flavor, and juicy arils. There are abundant germplasm resources of lychee in China. Lychee is suitable for cultivation in subtropical regions located in the range of N 12°–32° and S 6°–29°, which are characterized by short, cool, dry frost-free winters and long, hot summers with high rainfall and humidity. China is the largest lychee producer, with a cultivation area of more than 0.55 million ha mainly distributed in Guangdong, Guangxi, Hainan, Fujian, Taiwan, Sichuan, Chongqing, Yunnan provinces. Guangdong Province is the largest lychee producer in China. In 2018, the planting area of lychee in Guangdong was 0.25 million ha, with an annual output of 1.17 million tons, accounting for 44.9% and 51.1% of the national total planting area and production, respectively (Chen, 2018; Guangdong Statistical Yearbook on Agriculture, 2018).
Low and unstable yields per unit area are some of the main problems in lychee production (Xu et al., 2010). On the one hand, fertilizer guarantees a high fruit yield. On the other hand, unbalanced fertilization and nutrient deficiencies are major contributors to yield fluctuations. Previous studies have revealed that there are serious defects in the fertilization schedules of horticultural crops, especially fruits and vegetables and that insufficient attention has been paid to this problem in the context of the whole productive life of perennial crops (Huett and Dirou, 2000). Lychee fertilization is difficult because it is a perennial crop and so nutrients accumulate in the trees, it is sensitive to climate change, and there are diverse varieties that show inconsistent responses to nutrient supply. The lack of nutritional programs that meet the requirements of lychee has been identified as one of the main contributors to the low yields of this crop (Menzel and Simpson, 1987).
According to statistical data, China was the largest user of chemical fertilizer in agriculture from 2002 to 2018 (FAO, 2020). The Action Plan for Zero Increase in Chemical Fertilizer by 2020 was formulated by the Ministry of Agriculture and Rural Affairs of China to address the problem of excessive chemical fertilizer use. The increased planting area of cash crops (vegetables and fruits) resulted in high-intensity fertilizer application and increased amounts of fertilizer applied (Liu and Lian, 2019). The proportion of fertilizer applied to fruit trees increased significantly from 1.5% to 11.5% from 1984 to 2004 (Yan, 2008). Farmer’s investigations revealed that the amount of fertilizer applied per unit area was in the range of 244.3 to 1300.5 kg hm2, with an average of 724.5 kg ha-1, indicating that the supply of chemical fertilizer exceeded the demands for lychee production (Chen and Qin, 2019). Another study showed that the average amount of fertilizer applied per unit cultivated area was 443.53 kg ha-1, much higher than the upper safety limit (225 kg ha-1) specified to prevent environmental damage (Liu and Lian, 2019). The increased amount of fertilizer applied to fruit trees has increased the total consumption of chemical fertilizer in agriculture. According to our investigations, the average fertilizer application rates for lychee are 350 kg N ha-1, 253 kg P2O5 ha-1 and 393 kg K2O ha-1 (n = 97). Most lychee growers in China mainly rely on experience when applying fertilizers at the small orchard scale. Lychee trees are generally fertilized at the initiation of flowering or fruiting. Lychee growers pursue high yields and rely on chemical fertilizers. However, continuous high fertilization rates do not achieve high yields, reduce soil fertility, and pollute the environment (Zhang et al., 2012). Therefore, it is urgent to establish a lychee nutrient management approach to guarantee the strong growth of lychee trees and high fruit yields.
Previous studies have developed and tested various nutrient diagnosis and fertilizer recommendation methods, such as the soil fertility classification method, the target yield method, soil testing and formula fertilization, and aboveground diagnosis of canopy nutrition (Mistele and Schmidhalter, 2008; Li et al., 2016; Berbel and Martínez-Dalmau, 2021). Another study proposed a nutrient management scheme based on measured nitrogen (N), phosphorus (P), and potassium (K) contents in leaves at the harvest stage, autumn shoot maturation stage, and flower bud differentiation stage (Fan et al., 2004). It was suggested that the number of nutrients removed via harvesting of lychee fruits and pruning should be the lower limit for nutrient application in the following year to maintain soil fertility in lychee orchards and to ensure the normal growth and development of trees (Yao et al., 2020). In addition, a Diagnosis and Recommendation Integrated System was proposed to identify nutrient imbalances in crops and formulate nutrient management strategies to achieve higher yields of perennial fruit crops (Savita et al., 2020).
The production of perennial fruit crops based on nutrient management is complex because of large variations in the relationships between nutrient contents and yield, seasonal differences in nutrient use efficiency, and interannual fluctuations in yield (Srivastava and Malhotra, 2017; Carranca et al., 2018). As mentioned above, it is imperative to establish a scientific, rational, and feasible recommended fertilization approach suitable for lychee farmers. Nutrient Expert (NE), as an computer-based decision support tool, considers nutrients from exogenous addition, soil indigenous supply and environmental deposition as well as the reimbursement of harvested part. The algorithm for fertilizer requirements are based on the database collected field experiments conducted by IPNI China Program, our research and published journals. The N fertilizer recommendation is calculated with the expected yield response and target agronomic efficiency which is simulated using collected data across different soils and weather conditions. The P and K fertilizer recommendations involve to the internal efficiency (IE), YR, and maintaining of soil P and K nutrient balance. Meanwhile, the medium trace elements will be supplement if the soil test data is available.
NE approach is characterized by dynamic fertilizer recommendations based on variable environmental conditions across years. The NE system integrates complicated nutrients management principles into an easily grasped software tailored to make a specific decision on nutrient management. It is convenient and user-friendly software for farmers to use. The information need to input includes agronomic data of specific field, such as crop yield and fertilizer input data in the past 3 to 5 years, and crop residue management practices, which could easily provide by farmers. Besides, some auxiliary information, such as ago-ecological conditions (water availability, and soil limiting factors), soil texture, soil color, are also embedded in the NE approach to provide improved nutrient requirement estimates. The main output information of NE approach includes nutrient recommendation (fertilizer source, application rate, time and place), plant density and crop varieties, and benefit analysis. The advantage of NE approach could overcome the shortcomings inherent in the soil testing approach and rapidly provide nutrient recommendation for smallholders, family farms and specialized cooperative based on their site-specific information in the absence or presence of soil test results. Meanwhile, it could be beneficial for improving fertilizer use efficiency and crop productivity. This recommended fertilization approach has been established and applied to grain crops (Chuan et al., 2013; Xu et al., 2014; Xu et al., 2017), radish (Zhang et al., 2019), Chinese cabbage (Chuan et al., 2019), and some major fruit crops (Li et al., 2020). It provides the necessary support for farmers to implement balanced fertilization on a large scale on farms (Huang et al., 2021).
Because of the lack of systematic analyses of YR and AR data from multi-site and multi-year trials of lychee production, the effectiveness of the NE approach to improving lychee productivity is still not well documented. We hypothesized that, compared with farmers’ practices (FP), the NE approach could optimize fertilizer management and improve lychee yield and nutrient use efficiency. The objectives of this study were to: (1) analyze the soil indigenous nutrient supply, YR, and AE of N, P, and K for lychee; (2) describe the relationships among soil indigenous nutrient supply, YR, and AE; and (3) validate and evaluate the applicability of the NE recommendation approach based on YR and AE for smallholders without soil testing.
Materials and Methods
Data Collection
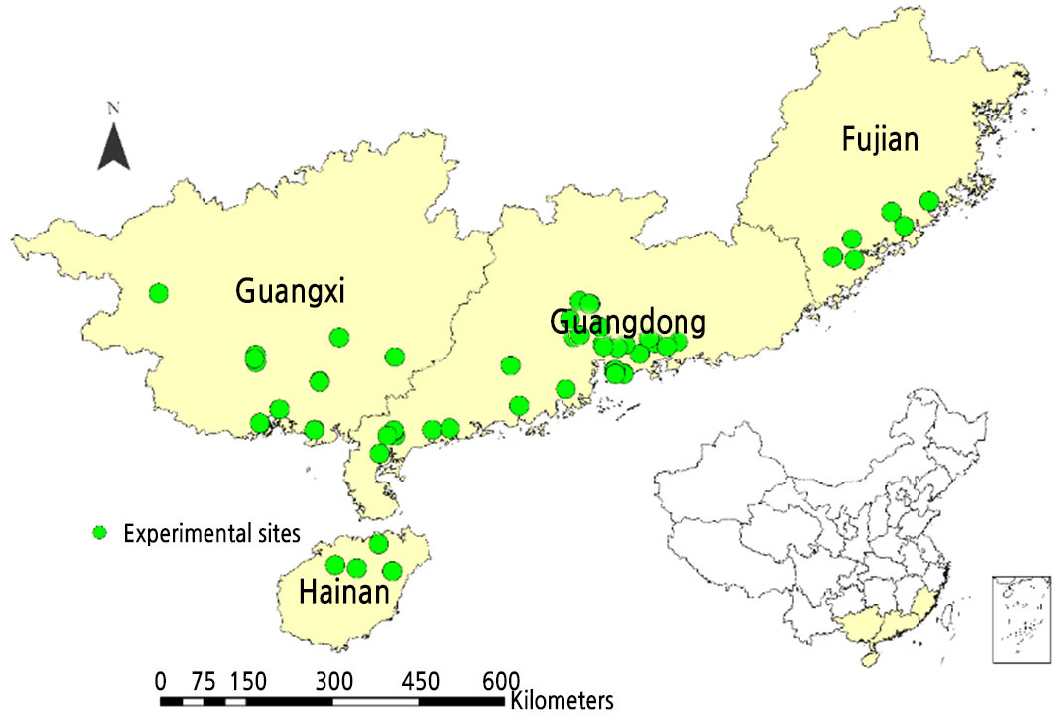
The data in the lychee database were collected from the main planting areas of lychee. The data were primarily collected from various lychee field trials published in academic journals from 1979 to 2020 and unpublished studies conducted by the International Plant Nutrition Institute (1998–2011) and our team (2016–2020). The data included the results of fertilizer efficiency tests, different fertilization ratio experiments, nutrient omission experiments, combined inorganic and organic fertilization experiments, as well as nutrient diagnosis and optimum nutrient management analyses. The parameters recorded included fresh lychee yield, nutrient content, fertilization amount, nutrient requirement characteristics, and basic soil properties in lychee orchards. In total, 144 experimental sites with a wide range of soil types and climatic conditions were obtained after screening. The distribution of the experimental sites is shown in Fig. 1.
Description of Nutrient Expert System
Generally, crop yield is considered an indicator of soil nutrient supply and crop productivity after fertilization. Therefore, the effect of fertilization can be evaluated directly and effectively by characterizing soil nutrient status based on the crop YR. Nutrient Expert is a nutrient decision support system developed by the International Plant Nutrition Institute. It makes fertilizer recommendations based on site-specific nutrient management (SSNM) principles, taking into account the YR and AE incorporated into the Quantitative Evaluation of the Fertility of Tropical Soils (QUEFTS) model (Janssen et al., 1990; He et al., 2022). The NE system is a dynamic nutrient recommendation approach that adjusts the application rate of fertilizer according to the residue of the previous crop, the indigenous nutrient supply, and the expected YR to apply fertilizer. The key parameters of the NE system, including the international efficiency (IE) of N, P, and K applied, maximum yield, estimated attainable yield (Ya), crop YR to fertilizers (N, P, and K), relative yield (RY), AE, and the indigenous nutrient supply, etc (Xu et al., 2017). The IE is defined as kilogram of yield per kilogram of nutrient uptake which were simulated using QUEFTS. Ya is determined from field trials for a typical climatic condition with best management practices and without no limiting factors, which also could be estimated by weather conditions and crop yield in the past 3 to 5 years. YR is used to evaluate the supplying capacity of soil nutrient or soil fertility level. Generally, a higher yield response means lower soil indigenous nutrient supply. RY refers to the ration of yield in nutrient omission plot and attainable yield from NPK plot, which could be used to estimate yield response when this parameter is not available for some specific field. The relative yield of 25th, median and 75th percentile represent the indigenous nutrient supply classes of ‘low’, ‘middle’, and ‘high’ level, which are used as coefficients to evaluate yield response. AE refers to crop yield increase per kg nutrient applied. In the NE system, the target agronomic efficiency is obtained by analysis of data at optimal nutrient management at different conditions. And the indigenous nutrient supply is defined as the average nutrient uptake by the plant in a nutrient-omission plot based on the database. The higher the YR, the lower the basic fertility and the higher the amount of fertilizer recommended. Based on the results of field experiments on the effects of fertilization in recent decades in China, a lychee database was established for the NE system. The database included the YR of lychee, its AE, and indigenous nutrient supply. The lychee recommended fertilization model was established based on YR and AE in terms of the internal relationships among soil nutrient supply, AE, and YR, as well as the characteristic parameters of optimum nutrient uptake and utilization by lychee.
On-farm Validation
On-farm validation experiments of fertilizer recommendations based on the NE approach were conducted in four lychee plantations from 2018 to 2020. The experimental treatments included farmers’ practices (FP), Nutrient Expert (NE), and N-, P-, and K-omission treatments (NE-N, NE-P, NE-K). The amount of N fertilizer recommended by the NE approach was calculated based on the YR and AE of N, while the amounts of P2O5 and K2O fertilizers recommended by NE were mainly determined based on YR and AE of P and K, nutrient removal (including nutrients removed by harvested fresh fruit and pruned branches and leaves), and nutrients remaining in the soil from the last season.
The planting density of lychee trees in the validation experiments was 4 m × 4.5 m, and the trees were 7 years old. Each plant represented a repetition and each treatment was replicated 10 times. All the treatments were arranged in a completely randomized design with all repetitions of each treatment on the same contour line. Because lychee is a perennial woody plant, its 1-year production period starts after the completion of the harvest in the previous year and ends after the harvest in the next year. The fertilizer application rates are listed in Table 1. The N, P and K fertilizer sources used in this experiment were urea, superphosphate, and potassium chloride, respectively. The N fertilizer and K fertilizer were applied after harvest, before flowering, and before fruit set, at ratios of 0.5:0.15:0.35 and 0.4:0.3:0.4 respectively. The P fertilizer was applied only once as basal fertilizer after harvest. At harvest, the fruit of each plant was weighed separately, and samples of fruit, pruned leaves, and branches were collected to analyze nutrient contents. The pruned leaves and branches were weighed after harvesting. Dry matter weights of lychee fruit and pruned leaves and branches were determined after oven-drying at 70°C. The contents of total N, total P, and total K in lychee fruit and pruned leaves and branches were determined by the Kjeldahl method, the vanadium-molybdenum yellow colorimetric method, and flame photometry, respectively.
Table 1.
Application rates of fertilizers in validation experiments
| Site | Treatment | Fertilization application rate (kg ha-1) | ||
| N | P2O5 | K2O | ||
| Zhanjiang 1 | FP | 461 | 422 | 466 |
| NE | 255 | 39 | 205 | |
| Zhanjiang 2 | FP | 461 | 422 | 466 |
| NE | 255 | 39 | 205 | |
| Guangzhou | FP | 584 | 584 | 584 |
| NE | 193 | 29 | 155 | |
| Maoming | FP | 257 | 158 | 185 |
| NE | 207 | 32 | 167 | |
Calculations
The RY, AE, recovery efficiency (RE), partial factor productivity (PFP), and net return were calculated as follows:
RY = yield production in nutrient omission treatment/yield production in the full nutrient treatment
Total nutrient uptake (kg ha-1) = nutrient removal by fresh fruits + nutrient removal from pruned leaves and branches.
where Y and Y0 indicate the fresh lychee fruit yield (kg ha-1) from the NPK treatment and nutrient (N, P, or K) -omission treatments, respectively; F is the amount of N, P2O5, or K2O fertilizer applied (kg ha-1); U is the amount of N, P, or K taken up by the fruit and pruned leaves and branches in the NPK treatment; and U0 is the amount of N, P or K taken up by fruit and pruned leaves and branches in the omission treatments.
where net return represents the net benefit excluding fertilizer cost ($ ha-1); PL, PN, PP, and PK are the price of fresh lychee fruit, N, P, and K fertilizers, respectively; YL is the fresh fruit yield of lychee (t ha-1); and FN, FP, and FK are the amounts of N, P2O5, and K2O (kg ha-1) applied, respectively.
Net return is the gross return above fertilizer cost. The prices of lychee fruit (2018–2020) ranged from $1.76 to $2.35 kg-1, and the average prices of fertilizers used during the experimental period were $0.70 kg-1 N, $0.98 kg-1 P2O5, and $0.74 kg-1 K2O (the US $1= 6.8 RMB).
Statistical Analysis
All statistical analyses were performed with SAS for Windows (SAS 9.0). Data were subjected to a one-way analysis of variance (ANOVA). Significant differences in fresh fruit yield, AEN, REN, and PFPN between FP and NE treatments were determined by Duncan’s new multiple range test at the 0.05 level of significance.
Results
Soil Indigenous Nutrient Supply
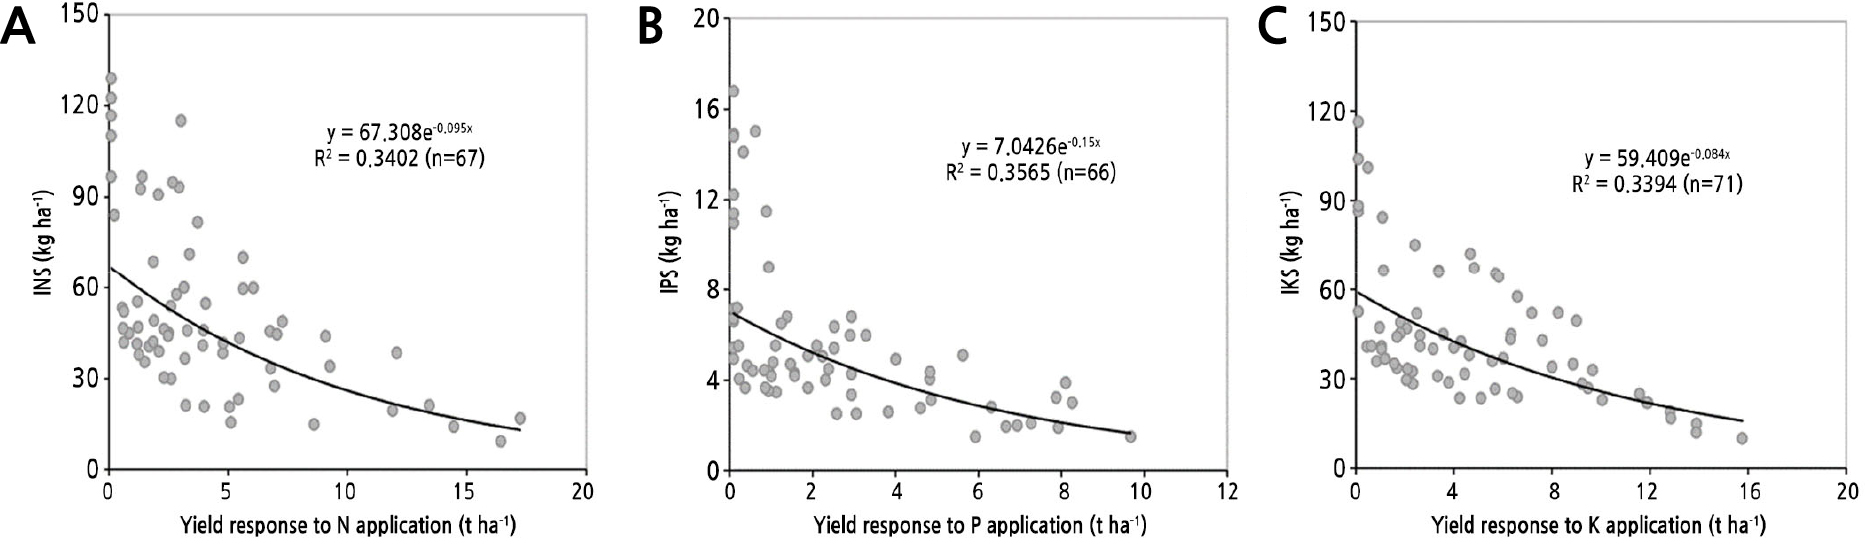
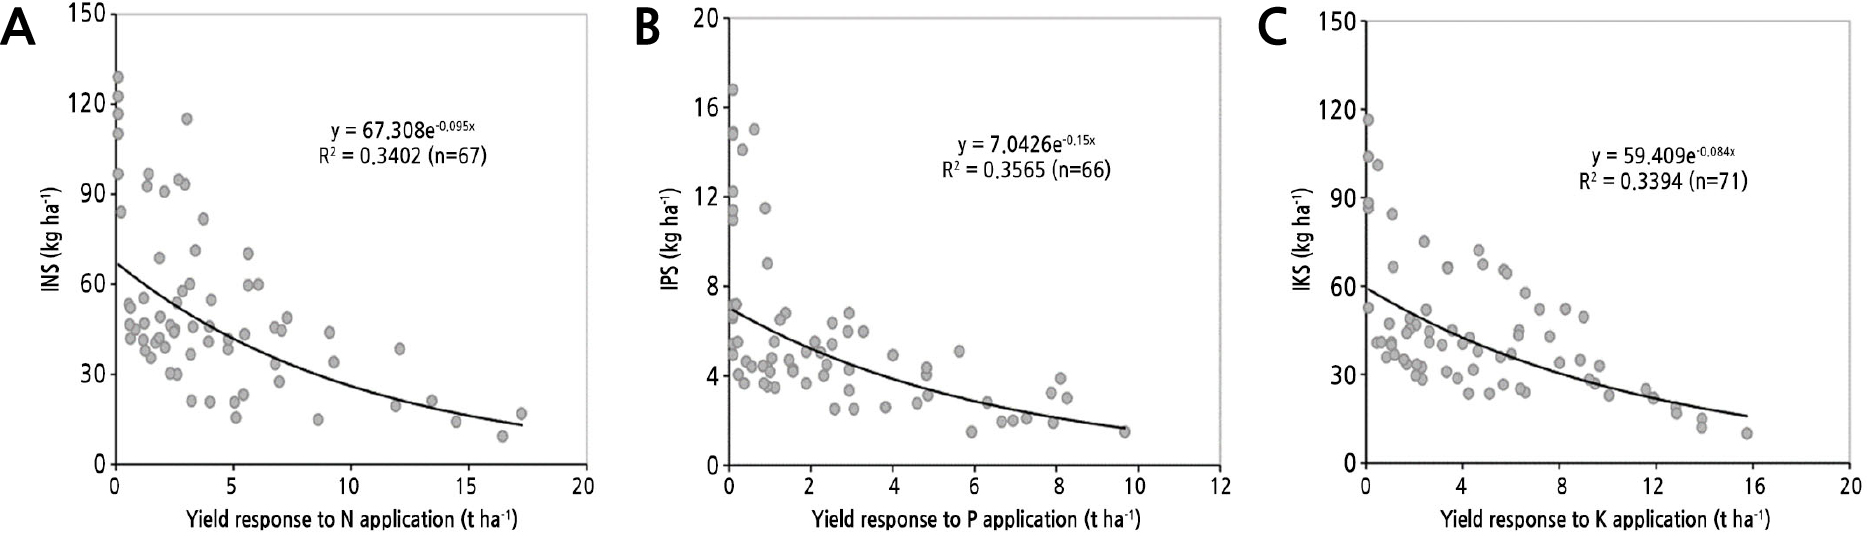
Soil indigenous nutrient supply is the capacity of the soil to supply a certain nutrient with an adequate supply of other nutrients. The indigenous supply of N, P, and K is expressed as INS, IPS, and IKS, respectively. In this study, the indigenous nutrient supply represented nutrients that were brought into the soil from the external environment, rather than from fertilizers. The indigenous supply was determined by measuring nutrient contents in fresh lychee fruit and pruned leaves and branches from trees in plots without specific nutrient treatments.
Generally, the higher the indigenous nutrient supply value, the stronger the nutrient supply capacity, and the lower the YR after applying this nutrient. The average INS, IPS, and IKS of lychee orchards were 52.4 kg N ha-1 (n = 67), 5.7 kg P ha-1 (n = 66) and 44.2 K kg ha-1 (n = 71), respectively (data not shown).
Yield Response and Relative Yield
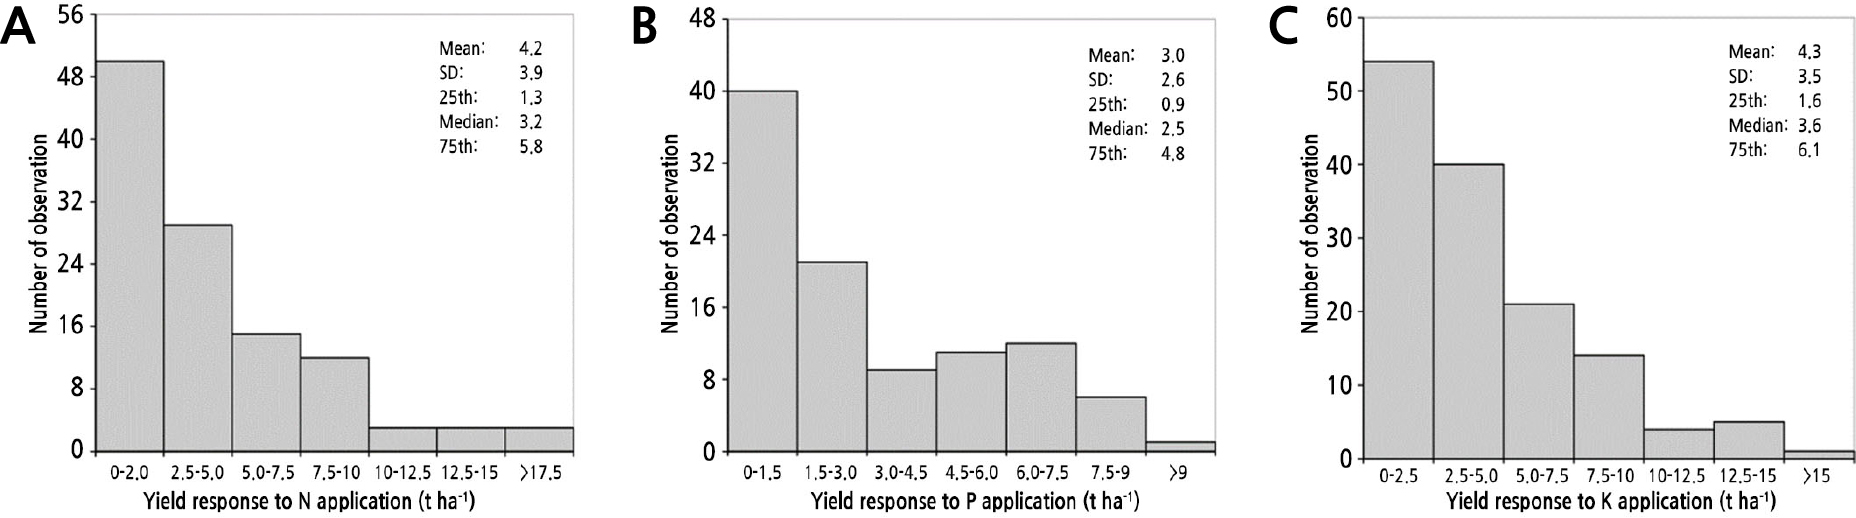
The YR is the yield difference between nutrient-omission plots and full-nutrient plots. The YR is the yield increase in response to fertilization and it is the most important parameter for achieving balanced fertilization. The YR of lychee to N, P, and K were analyzed (Fig. 2). There were some differences in the YR to N, P, and K: the YR to N and K was greater than the YR to P, indicating that N and K were the main limiting factors in lychee production. The average YRs to N, P, and K were 4.2 t ha-1, 3.0 t ha-1, and 4.3 t ha-1, respectively. The YR to N was mainly distributed in the range of 0 to 2.5 t ha-1, accounting for 43.5%. The YR of P is mainly distributed in the range of 0–1.5 t ha-1, accounting for 40.0%, while the distribution of YR of K was mainly distributed in the range of 0–2.5 t ha-1, accounting for 38.8%.
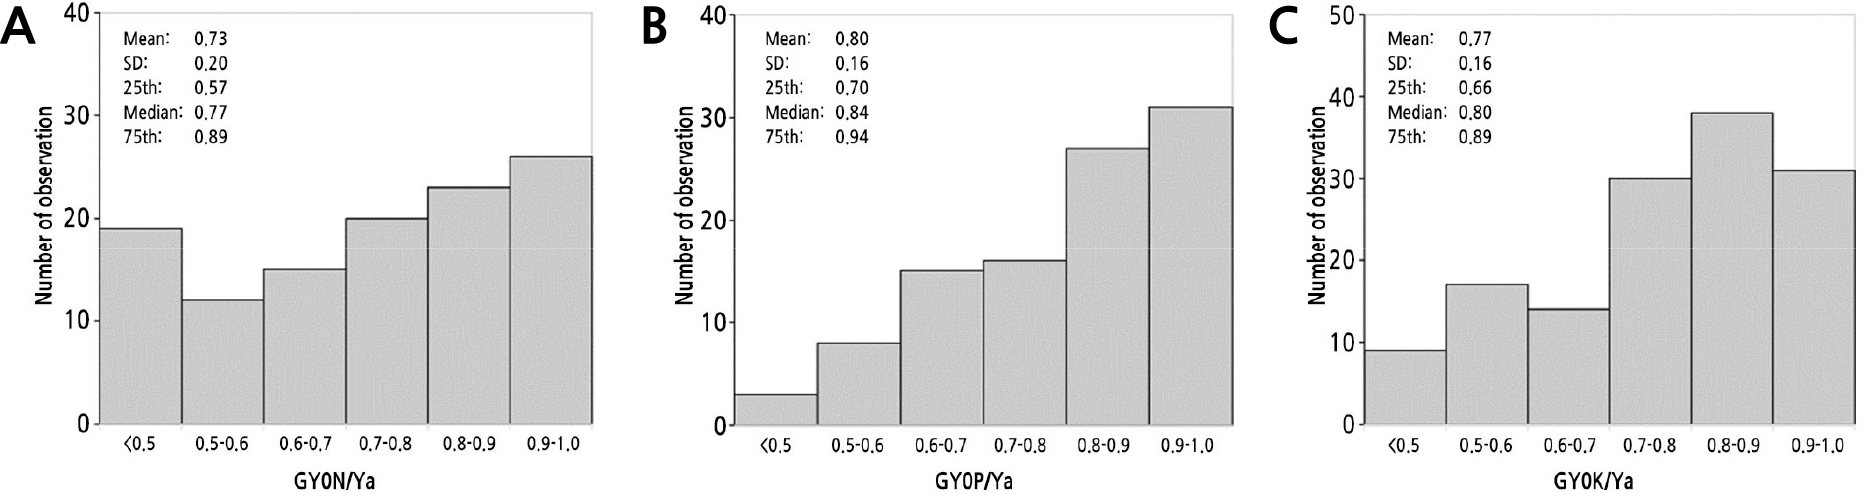
Relative yield is defined as the ratio of fresh lychee yield in the nutrient-omission treatment to attainable yield. The RY frequency distribution of N, P, and K showed that the average of RYs of N, P, and K were 0.73 (n = 115), 0.80 (n = 100), and 0.80 (n = 139) (Fig. 3). The proportions of N, P, and K with RY frequency below 0.50 were 16.5%, 3.0%, and 6.5%, respectively, while the proportions of those with RY frequency above 0.80 were 42.6%, 58.0%, and 49.6%, respectively (Fig. 3).
Agronomic Efficiency
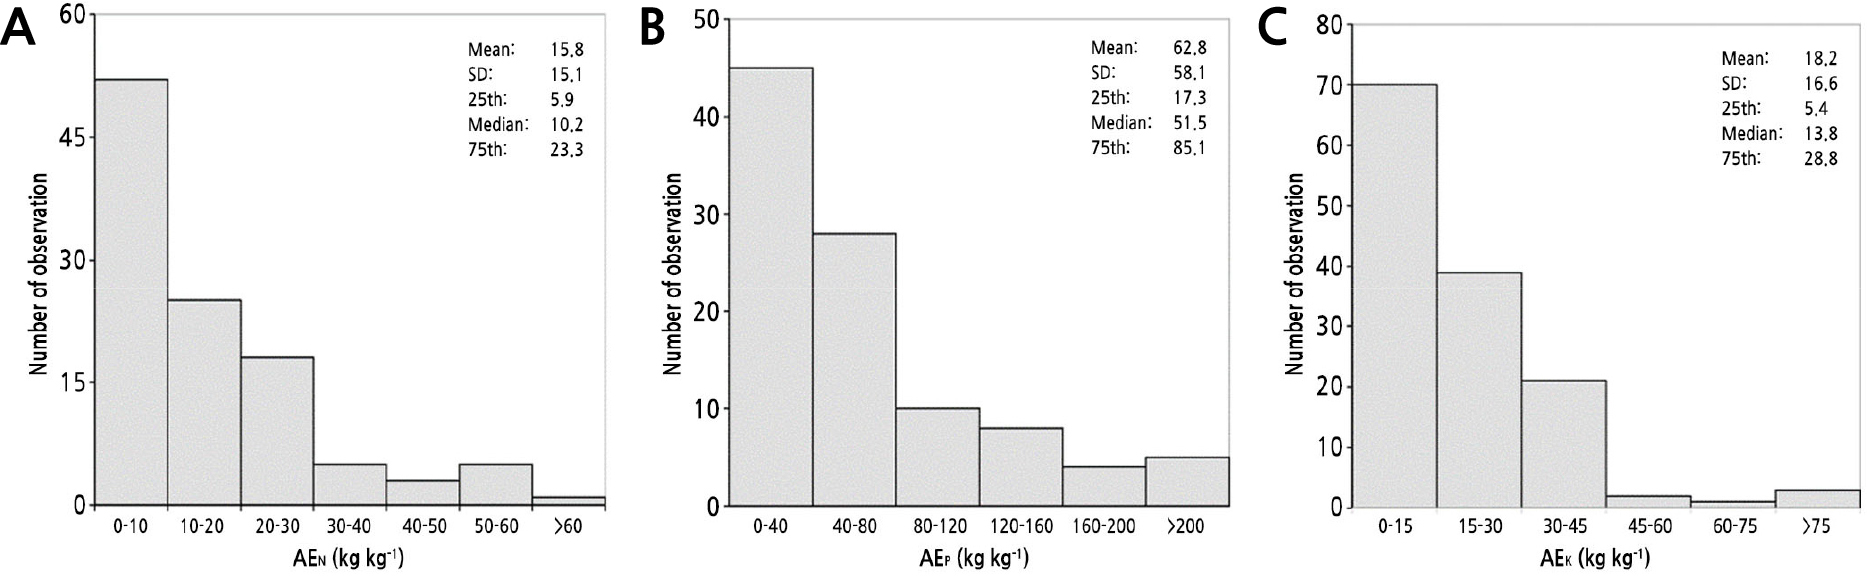
Agronomic efficiency refers to the yield increase after applying a specific nutrient, and it is one of the important indexes in evaluating fertilizer efficiency. The AEs of N, P, and K are expressed by AEN, AEP, and AEK, respectively. Unlike annual food crops, lychee trees accumulate nutrients year after year. Under the premise of nondestructive sampling of the whole tree, AE is an indispensable indicator in the fertilizer recommendation process. Statistical analyses showed that the AEN was mainly distributed in the range of 0 to 10 kg kg-1, accounting for 45.2% of the whole distribution, and the average AEN was 15.8 kg kg-1. The AEP was mainly distributed in the range of 0 to 40 kg kg-1, accounting for 45.0%, and the average AEP was 62.8 kg kg-1. The AEK was mainly distributed in the range of 0 to 15 kg kg-1, accounting for 50.4% of the total value. The average AEK was 18.2 kg kg-1 (Fig. 4).
Relationship between YR and Indigenous Nutrient Supply
The results showed that with the increase in indigenous nutrient supply, the YRs to nutrients gradually decreased (Fig. 5). A significant negative exponential correlation was obtained between YR and the indigenous nutrient supply of N, P and K. The correlation coefficients (r) between YR and the indigenous nutrient supply of N, P, and K were 0. 583, 0.597, and 0.583, respectively.
Relationship between YR and RY
The YR can reflect nutrient abundance/deficiency as well as the fertilizer effect. With increasing fertilizer application, nutrients accumulated in the soil and the YR decreased. The RY directly reflects soil fertility and nutrient status. The lower the RY, the lower soil indigenous nutrient supply and soil productivity, and the more obvious the increase after fertilization. Conversely, the higher the RY, the higher the soil indigenous nutrient supply. A significant negative linear correlation was detected between YR and RY in lychee production. The correlation coefficients (r) between the YR and RY of N, P, and K were 0.700 (n = 115), 0.848 (n = 100), and 0.773 (n = 139), respectively (Fig. 6).
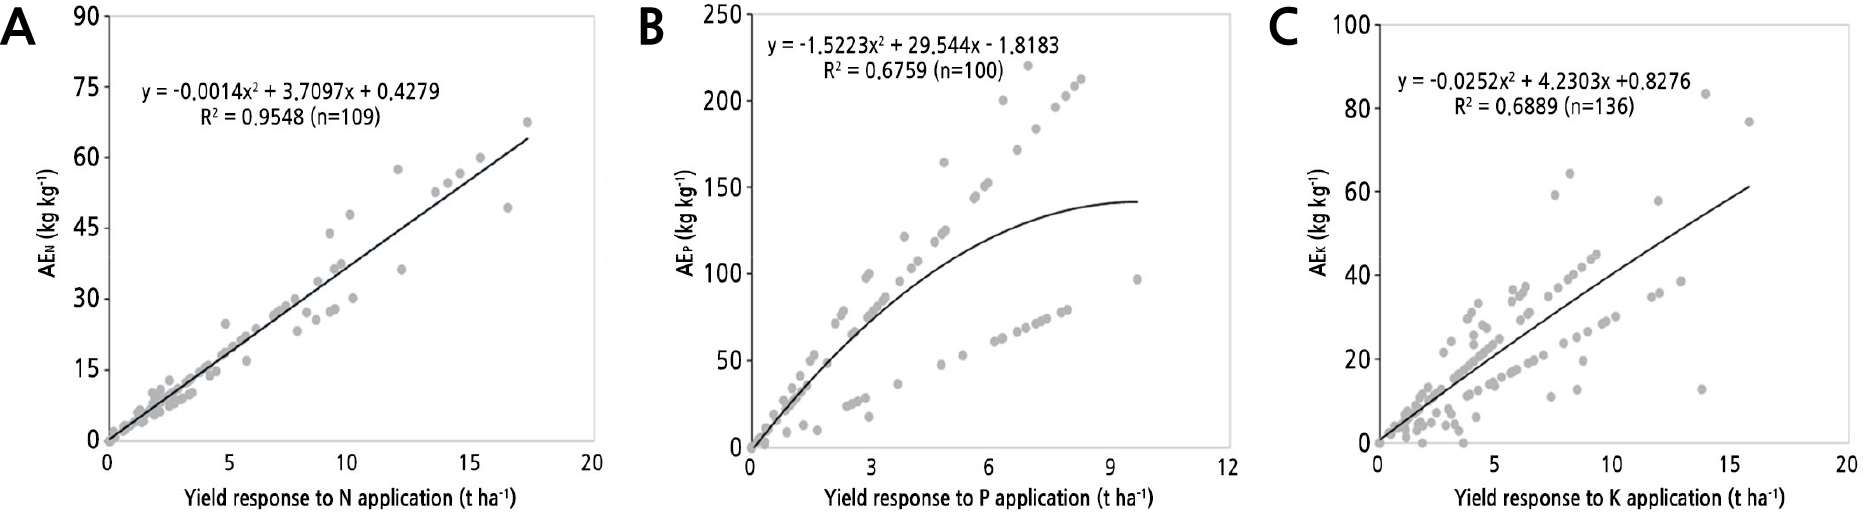
Correlation between YR and AE
The YR and AE reflect the soil indigenous fertility and the fertilizer effect, respectively. There is a close relationship between the amount of fertilizer and YR and AE. As the amount of fertilizer applied increased, the YR and the AE showed a parabolic change. The correlation coefficients (r) between the YR and AE of N, P, and K were 0.977 (n = 109), 0.822 (n = 100), and 0.830 (n = 136), respectively (Fig. 7).
On-farm Validation of the NE Approach for Lychee
To confirm the feasibility of the NE approach, on-farm validation experiments of the lychee NE approach were conducted in four lychee orchards in Guangdong province from 2018 to 2020. Compared with the N applied in the FP treatment, the amount of N applied in the NE treatments at the Zhanjiang 1, Zhanjiang 2, Guangzhou, and Maoming sites was decreased by 206 kg ha-1, 206 kg ha-1, 391 kg ha-1 and 50 kg ha-1, respectively, representing decreases of 44.7%, 44.7%, 67.0%, and 19.5%, respectively. Similarly, compared with the amount of K applied in the FP treatment, the amount applied in the NE treatments was decreased by 56.0%, 56.0%, 73.4%, and 9.8% at the Zhanjiang 1, Zhanjiang 2, Guangzhou, and Maoming sites, respectively. Compared with the amount of P applied in the FP treatment, the amount applied in the NE treatment was decreased by 90.8%, 90.8%, 95.0%, and 80.0% at the Zhanjiang 1, Zhanjiang 2, Guangzhou, and Maoming sites, respectively. As mentioned above, the amount of chemical fertilizer applied in lychee orchards is seriously excessive, especially P fertilizer. This is indicative of the actions of lychee growers to pursue higher yields of lychee regardless of fertilizer costs when there are high economic returns for the fruit. In this study, the fresh lychee yield was averaged for each treatment across 2 years. There was no significant difference in fresh lychee yield between the NE treatment and FP treatment at the two sites in Zhanjiang, while the fresh fruit yield was 7.0% and 17.0% higher in the NE treatment than in the FP treatment at the Guangzhou and Maoming sites, respectively (p < 0.05) (Fig. 8A). In terms of the net return and output-input ratio of different treatments, the difference in the net return of treatments showed the same trend as the output-input ratio at all test sites. Compared with the FP treatment, the NE treatment significantly increased the net return and output-input ratio (Fig. 8B and 8C). The higher the ratio of output to input, the better the economic effect. Thus, the results indicate that the economic benefits were higher in the NE treatment than in the FP treatment at all the test sites.
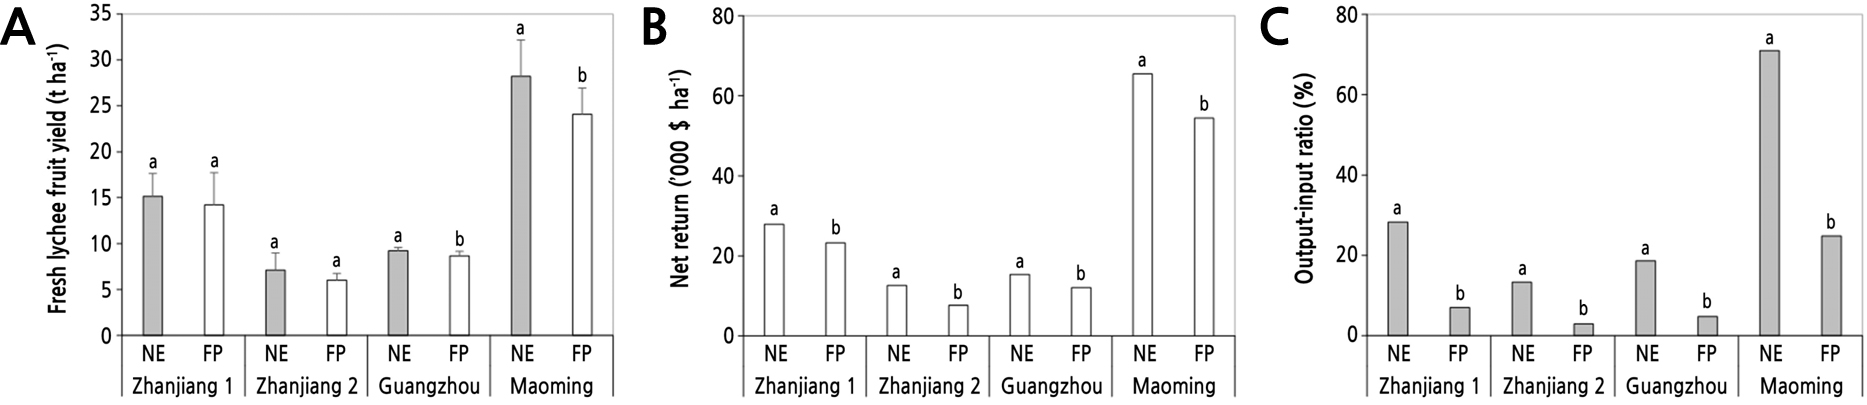
Fig. 8.
Yield, the net return, and the yield-input ratio of lychee fresh fruits at four sites (data from on-farm validation experiments). Net return, gross return above fertilizer cost; NE, Nutrient Expert; FP, farmers’ practices. Price of lychee fruit ranged from $1.76 to $2.35 kg-1 and average prices of fertilizers were $0.70 kg-1 N, $0.98 kg-1 P2O5, and $0.74 kg-1 K2O (US $1= 6.8 RMB). Different lowercase letters above columns indicate significant differences between treatments (p < 0.05).
The REN, AEN, and PFPN of the NE and FP treatments were analyzed comprehensively in four orchards (Fig. 9). The trends in REN, AEN, and PFPN were consistent between the NE and FP treatments. On average, N-use efficiency was significantly greater in NE than in FP in all experiments (Fig. 9). Across all sites, the REN, AEN, and PFPN values of the NE treatment were 10.0% (range, 1.5% to 23.6%), 16.8 kg kg-1 (range, 3.0 kg kg-1 to 36.7 kg kg-1), and 67.8 kg kg-1 (range, 27.9 kg kg-1 to 136.3 kg kg-1), respectively. In contrast, the average REN, AEN and PFPN values in the FP treatment were 3.9% (range, 0.4% to 7.9%), 6.1 kg kg-1 (range, 0.0 kg kg-1 to 13.5 kg kg-1), and 38.2 kg kg-1 (range, 13.1 kg kg-1 to 93.9 kg kg-1). Thus, the REN, AEN, and PFPN values in the NE treatment were increased by 6.1%, 10.7 kg kg-1, and 29.6 kg kg-1 compared with their respective values in the FP treatment.
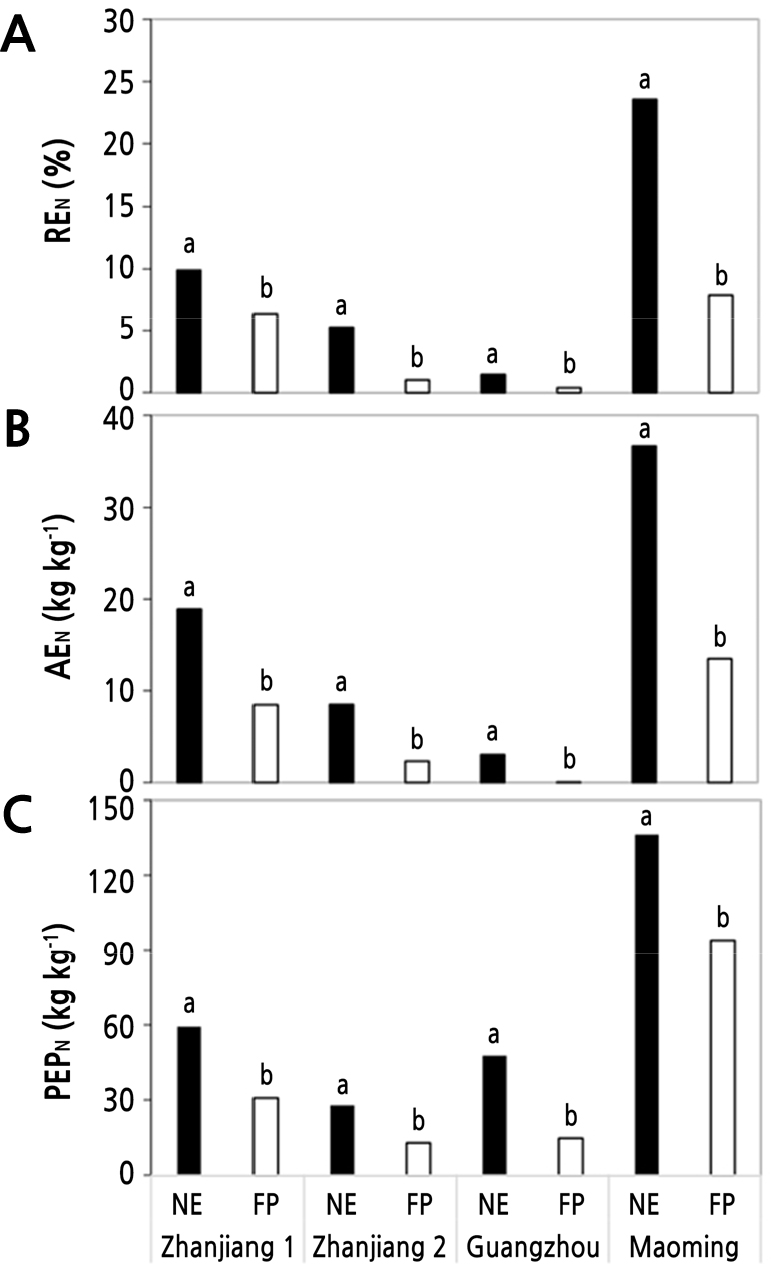
Fig. 9.
Comparisons of REN, AEN, and PFPN between NE and FP treatments in on-farm validation experiments. REN, recovery efficiency of nitrogen; AEN, agronomic efficiency of nitrogen; PFPN, partial factor productivity of nitrogen; NE, Nutrient Expert; FP, farmers’ practices. Different lowercase letters above columns indicate significant differences between treatments (p < 0.05).
Discussion
Soil Indigenous Nutrient Supply
Crop nutrient demand and soil nutrient supply are the two primary parameters to calculate balanced fertilization inputs (Cassman et al., 1996a). Soil indigenous nutrient supply is a useful and important parameter to assess soil fertility and its capacity to supply nutrients without soil testing. Indigenous nutrient supply is determined by the amount of that nutrient taken up from plots without applying that nutrient under favorable growth conditions (Janssen et al., 1990; Dobermann et al., 2003). It includes not only nutrients from the soil itself and nutrients mineralized by organic matter, but also residual nutrients from last season, from the environment, from biological and non-biological fixation, and deposition. The indigenous nutrient supply has become a primary consideration in fertilizer recommendations (Susanto and Sirappa, 2014). Previous studies found that N uptake was the most useful indicator of indigenous nutrient supply because it is easy to measure, is closely related to grain yield, and can provide information about productivity information and nutrient-use efficiency (Cassman et al., 1996b). In the current study, the average INS, IPS, and IKS of lychee were 52.4 kg ha-1, 5.7 kg ha-1, and 44.2 kg ha-1, respectively. These values are lower than those reported for a food crop, maize (average INS, IPS, and IKS of 130.4, 40.7, and 123.7 kg ha-1, respectively), and a vegetable, Chinese cabbage (average INS, IPS, and IKS of 113.0, 35.0, and 213.2 kg ha-1, respectively) (Xu et al., 2014; Chuan et al., 2019). From the perspective of crops, these values demonstrated that the soil fertility and nutrient supply capacity is higher for food crops and vegetables than for lychee orchards, implying that soil fertility is lower in lychee orchards than in farmland. The values also indicated that the nutrient supply capacity significantly differs among nutrients and crops. The indigenous supply of N and K is much higher than that of P in all soils, and the indigenous supply of K is higher than that of N in vegetable fields. Thus, the indigenous supply of N, P, and K should not be ignored when calculating the application amount and the application ratio. It was suggested that the suitable application ratio for K/N for lychee production was 1.2 under these conditions (Yang et al., 2015).
We detected a significantly negative exponential relationship between YR and indigenous nutrient supply (Fig. 5). Therefore, the relationship between YR and indigenous nutrient supply should be considered before making fertilizer recommendations because indigenous nutrient supply is one of the most important indices of soil fertility. The higher the nutrient supply capacity, the higher the yield obtained without adding that nutrient, and the lower the YR and fertilizer effect. The YR is useful for analyzing factors limiting crop production. Thus, YR is a useful parameter for research on how to reduce the yield gap of crops by improving soil fertility management (Van Ittersum et al., 2013). Crop yield is the final result of soil indigenous nutrient supply and fertilizer application. Thus, the yield gap between the plots with and without a certain nutrient provides information about limiting nutrients and the effect of fertilization.
YR and AE
The YR and AE are often used as important indicators of soil fertility and fertilization efficiency. To explicitly evaluate the crop YR for fertilizer application, recent agronomic studies have tended to conduct on-farm experiments using digital tools such as yield monitors for small grains or remote sensing technologies as proposed by Marchant and Bullock (Bullock et al., 2019; Marchant et al., 2019). There are large variations in the YR to N, P, and K fertilizer among different crops (Xu et al., 2017; Xu et al., 2019), especially for lychee, which has high coefficients of variation for YR values. The multiple quadratic relationships between AE and YR in this study might be related to soil properties and tree age (Fig. 7). The YR and AE of fertilizer are affected by many factors, such as soil type, crop variety, nutrient management, and environmental conditions (Sileshi et al., 2019). Yan et al. (2021) considered that nutrient application should be tailored to the variety, followed by soil fertility. A meta-analysis showed that the average AEs of N, P, and K fertilizer in China’s fruit crops were 29.1, 32.4, and 20.2 kg kg-1, respectively (Li et al., 2020). Compared with those values, we obtained lower AEN, higher AEP, and similar AEK values for lychee production in this study, implying that the yield increase per unit fertilizer N was relatively low among cultivated fruits. Admittedly, the values collected in this study have a degree of uncertainty as they were obtained in experiments with a wide range of purposes. In addition, these indicators may have been affected by tree age. Increased application of chemical fertilizers to fruit crops decreases the agronomic responses of fruit yield to fertilization. Thus, a better understanding of the characteristics of these responses is crucial for developing nutrient recommendations and fertilizer management for these crops.
Evaluation of NE Approach for Lychee Production
Fertilizer recommendation based on soil testing has been widely advocated for crop nutrient management. However, this method has not been widely used because of its heavy workload, complicated test methods, and the time-lag problem. Thus, it is unsuitable for small household production models, especially orchards (He et al., 2022). At present, the fertilization of lychee is usually based on the experience of successful growers, aiming to achieve a high yield. There is spatial heterogeneity in soil fertility in lychee orchards, and there are many different varieties of lychee with certain geographical distributions (Lin et al., 1998; Kumari et al., 2013). Thus, the results of individual experiments would not meet the current needs of nutrient management and recommended fertilization. The NE approach used in this study was based on the YR and AE of lychee, obtained using the nutrient absorption characteristic parameters predicted by QUEFTS model, data for YR, AE, soil indigenous nutrients supply, and yield gaps, and field experiments (Pampolino et al., 2012). The results of the NE approach for three major food crops showed that the recommended fertilization approach based on YR and AE is feasible, but the long-term effect of this approach on lychee production needs to be validated by further on-farm experiments. We note that the recommended fertilization approach for lychee in this study considered only the nutrients removed via harvested fruit and pruned leaves and branches; the nutrients required for the normal growth of the tree were not considered. In this context, the nutrient demands of annual crops are quite different from those of fruit trees, which grow and accumulate nutrients over many years. The pruned branches and leaves include the new shoots of woody plants, and the new shoots and fruits are priority sinks during tree growth (Hieke et al., 2002). Another study showed that, as the yield increased, the nutrient requirements per unit of new shoots decreased, and more nutrients were distributed into fruit tissues (Fan et al., 2020). Thus, it should be emphasized that the fertilization rate recommended by the NE approach was the lower limiting value for lychee production. This may a limitation of this model-based simulation, in that the recommended fertilization amount for lychee might not be the economically optimal application rate, although the NE treatments always outperformed the FP treatments in the validation experiments. Besides, this approach only refers to chemical fertilizers. The integration of organic materials with inorganic nutrients should be considered for better quality and sustainable development of lychee.
This study introduced a useful nutrient decision support tool, which was employed to help lychee planting farmers to obtain greater productivity and economic efficiency. The key parameters of NE system were well analyzed with all data and we observed significant negative correlations between YR and the indigenous nutrient supply, and between YR and RY. The relationship between YR and AE was well fitted by a quadratic equation. These results helped to develop fertilizer recommendation for lychee, which was established based on yield response and agronomic efficiency. This NE approach is tailored to ecological conditions and influence factors such as history crop yield and fertilizer application, crop residue management and so on. A two-year on-farm validation experiments were implemented in four lychee orchards. Compared with FP treatment, the input of fertilizer rate of NE was significantly saved and the output-input ratio and N use efficiency of NE was effectively increased without sacrificing lychee fruit yield. The NE approach proved it to be an effective, acceptable and feasible tool in production practice for lychee smallholder producers and agricultural technicians.
