

Introduction
Materials and Methods
Plant material and growth conditions
Growth analysis
Total Se and organic Se contents
SeCys, Se(IV), SeMet, MeSeCys, and Se(VI) contents
Se metabolic enzyme content
Statistical analysis
Results
Plant morphology, fresh weight and shoot water content
Total Se and different organic Se contents
Se metabolic enzyme contents
Correlations between indicators
Discussion
Conclusion
Introduction
Selenium (Se) is an essential micronutrient for human health and a beneficial element participating in multiple biological functions in plants (Francini et al. 2023). The WHO recommends a daily Se intake of 55–200 µg for adults (Zou et al. 2022). However, approximately 1 billion people worldwide worldwide are at risk of Se deficiency, particularly in low-Se soil regions including China, New Zealand, Russia, and parts of Europe (Kipp et al. 2015; Wang et al. 2020). Inadequate Se intake may lead to Keshan disease, Kashin-Beck disease, and thyroid dysfunction, whereas excessive Se consumption (>400 µg/day) can induce adverse effects such as alopecia and neurotoxicity (Winkel et al. 2015). Besides, compared to organic Se, inorganic Se (selenate and selenite) compounds are associated with a high risk of surpassing the safety threshold as well as with a low bioavailability in humans (Whanger 2002). Plants can actively absorb inorganic Se through roots and enzymatically convert it into organic forms (e.g., SeCys, SeMet, and MeSeCys) within chloroplasts and other organelles, thereby significantly enhancing Se safety and bioavailability (Genchi et al. 2023; Fu et al. 2025). Therefore, Se-enriched edible plants (e.g., vegetables, etc.) are becoming increasingly popular among health-conscious consumers.
Microgreens, which are very specific types of vegetables that are harvested with two fully developed cotyledon leaves, constitute a vital component of human diets, and offer superior nutritional profiles compared to mature vegetables. They have short growth cycles but high productivity, making them ideal candidates for Se biofortification in plant factory with artificial lighting (PFAL) (Truzzi et al. 2021). PFAL provide precisely controlled nutrient solutions, customizable light environment, multi-tier vertical cultivation, and year round production capabilities (Chen and Liu 2024), enabling optimization growth and targeted quality in microgreens. These technological advantages have laid a foundation for large scale production of Se-enriched microgreens. However, most research on Se application in PFAL was conducted on Se accumulation in leafy vegetables. For example, Francini et al. (2023) used nutrient solution containing Se to cultivate four baby leafy vegetables, and found wild rocket had the highest Se accumulation ability, containing a Se concentration of 11 µg·g-1 (fresh weight) when grown with nutrient solution enriched with 5.2 µM Se. Gui et al. (2022) found that the addition of sodium selenite (0.1–1.6 mM) increased the total Se and thioglucoside content, but inhibited plant growth in broccoli florets. As most microgreens are sensitive to Se treatment (Márton et al. 2010; Pannico et al. 2020), it is essential to investigate the how exogenous Se concentration affect growth and Se concentration in PFAL-grown microgreens, along with the underlying regulatory mechanisms. Plants are categorized into Se-accumulating and non-Se-accumulating types according to their capacity to accumulate Se. Among various plant families, cruciferous species are generally recognized as efficient Se accumulators, followed by legumes (Dhillon and Dhillon 2009). Radishes and pea microgreens are commonly consumed vegetables, making the investigation of organic Se accumulation and transformation in these crops particularly valuable. Moreover, elucidating the mechanisms of organic Se accumulation through changes in enzyme expression remains underexplored, yet this approach offers a promising direction for future research.
Se and S are congeners in the oxygen group, and share similar chemical properties (Kamboj et al. 2025). Both SeO42-, SeO32- and SO42- are absorbed via sulfate transporters (SULTRs) and assimilated through common pathways (Rao et al. 2021). In plants, inorganic Se undergoes sequential reduction to selenides (Se2-), followed by conversion into organic forms such as SeCys and MeSeCys, ultimately forming volatile dimethylselenide (DMSe) (Zhou et al. 2025). These processes are regulated by key enzymes including reduced glutathione (GSH), ATP sulfurylase (ATPS), cysteine synthase (CS), and selenocysteine methyltransferase (SMT) (Schiavon and Pilon-Smits 2017). These enzymes activity and expression levels may differ among plant species and are regulated by Se concentration. However, the regulatory mechanisms on how concentration of inorganic Se in the nutrient solution affects Se conversion in plants remain incompletely characterized, which need further investigations.
In this study, we selected radish (Cruciferae) and pea (Leguminosae), which are potential Se-enriching plant species, as the subjects to investigate the effects of exogenous sodium selenite (0–55 µM) application on the growth and Se metabolisms. Besides, the differences between the two microgreens were analyzed. We aimed to optimize the Se concentration for biofortification of microgreens grown in PFAL thereby providing a theoretical basis to produce functional Se enriched microgreens.
Materials and Methods
Plant material and growth conditions
Seeds of radish (Raphanus sativus L. Red-skin Radish) and pea (Pisum sativum L. Zhongwan No. 6) were washed in tap water to remove dust and impurities, and then immersed in deionized water at 25°C for 12 h and 24 h, respectively. Afterwards, seeds were sowed on moistened gauze in mesh trays (L18 cm × W8 cm × H1.5 cm) imbedded into a cultivation tray (L18 cm × W8 cm × H5 cm) and sprayed with half strength of Hoagland nutrient solution to maintain humidity. 24 h after sowing, pre-germinated seeds were grown in a PFAL with a photoperiod of 16/8 h (day/night) and ambient CO2 partial pressure. The temperature was 25 ± 2°C and relative humidity was 50–70%. Plants were subjected to 360 µmol·m-2·s-1 photosynthetic photon flux density (PPFD) measured at the top of mesh tray. PPFD was provided by a mixture of red (660 nm) and blue (460 nm) LED lights (Huazhaohong Optoelectronics Co., Ltd., Wuxi, China) with a red: blue ratio of 4:1.
Five days after sowing, plants were divided into six groups and placed under six sets of red-blue light panels, which were accolated to 0 (control), 15, 25, 35, 45, and 55 µM sodium selenite treatment, respectively. Different dosage of sodium selenite (Shanghai Shan Pu Chemical Co., Shanghai, China) was added to the half strength of Hoagland nutrient solution. The nutrient solution was adjusted to a pH 5.9 and an electrical conductivity (EC) of 1.0 mS/cm. The nutrient solution was maintained below the mesh tray without direct contact to the shoots. The solution was renewed every two days to maintain stable dissolved oxygen (DO) levels and prevent depletion of Se concentration, thereby ensuring efficient Se uptake and bioconversion by the microgreens. Treatment was repeated in four trays, which were swapped positions at the same time each day to prevent location-induced variations in light exposure from affecting plant growth. The harvest was conducted after 12 days of treatment. Shoots and roots were collected, immediately plunged into liquid nitrogen, and stored at ‒80°C.
Growth analysis
Shoot height, shoot and root fresh weight (FW) were measured immediately after harvest. Shoots and roots were dried at 105°C for 15 min and then 75°C for 3 days. Dry weight (DW) was measured, and water content was calculated as (FW-DW)/FW.
Total Se and organic Se contents
As for total Se content, frozen samples (~0.2 g) were digested in a mixture of 68% HNO3 (10 mL) and H2O2 (2 mL) in a microwave digestion instrument (Multiwave GO Plus, Anton Paar GmbH, Austria). The digestate was heated on a hotplate with 5 mL 6 M HCl until near dryness, then was fixed to 10 mL with ultrapure water for testing. Total Se content in samples was determined by a hydride generation atomic fluorescence spectrometry (HG-AFS, AFS-933, Beijing Jitian Instrument Co., Ltd., China). As for inorganic Se extraction, frozen samples (~0.2 g) were mixed with 10 mL 50% HCl, and then were ultrasonicated for 30 min, followed by thermal extraction in a water bath at 100°C for 30 min. After cooling, the resulting extracts were filtered through 0.45 µm aqueous phase membrane filters. Inorganic Se content in samples was determined as the same as for total Se. The organic Se content is the total Se content minus the inorganic Se content (Rao et al. 2021). Se transport and partitioning in microgreens were expressed as translocation factors (TF), i.e., the ratio of the shoot Se concentration to the root Se concentration (Zhang et al. 2013; Hurtado et al. 2017).
SeCys, Se(IV), SeMet, MeSeCys, and Se(VI) contents
The dried samples (~0.1 g) were homogenized with 3 mL ultrapure water containing 5 mg protease K and 5 mg pronase E (Biotopped Life Sciences Co., Shanghai, China), followed by enzymatic hydrolysis at 37°C for 30 min. The homogenate was centrifuged at 10,000 rpm for 20 min, and the supernatant was filtered through 0.22 µm organic membrane filters for analysis. A mixed standard solution containing SeCys, MeSeCys, SeMet, Se(IV) and Se(VI) (National Institute of Metrology, Beijing, China) was prepared at concentrations of 10, 20, 40, 80, 100, and 200 µg/L. SeCys, Se(IV), SeMet, MeSeCys, and Se(VI) in samples were quantified using hyphenated liquid chromatography-atomic fluorescence spectrometry (LC-AFS system, Beijing Jitian Instrument Co., Ltd., China) (Cheng et al. 2023).
Se metabolic enzyme content
Commercial assay kit was used to quantify reduced glutathione (GSH) content (BC1175, Beijing Solarbio Science & Technology Co., Ltd., Beijing, China) and ATP sulfurylase (ATPS), cysteine synthase (CS), and selenocysteine methyltransferase (SMT) contents (F50185-A, F0149-PAL and F0152-PAL, respectively, Shanghai Kexing Trading Co., Ltd., Shanghai, China).
Statistical analysis
Treatment effects (Se concentration) in each microgreen species were analyzed using one-way ANOVA in SPSS (v. 2024, SPSS, Inc., Chicago, USA). Two-way ANOVA tested the interaction between microgreen varieties and Se concentration treatment. Multiple comparisons of significant differences at P = 0.05 were performed with Duncan's test, and the results were plotted using Origin (v. 2024).
Results
Plant morphology, fresh weight and shoot water content
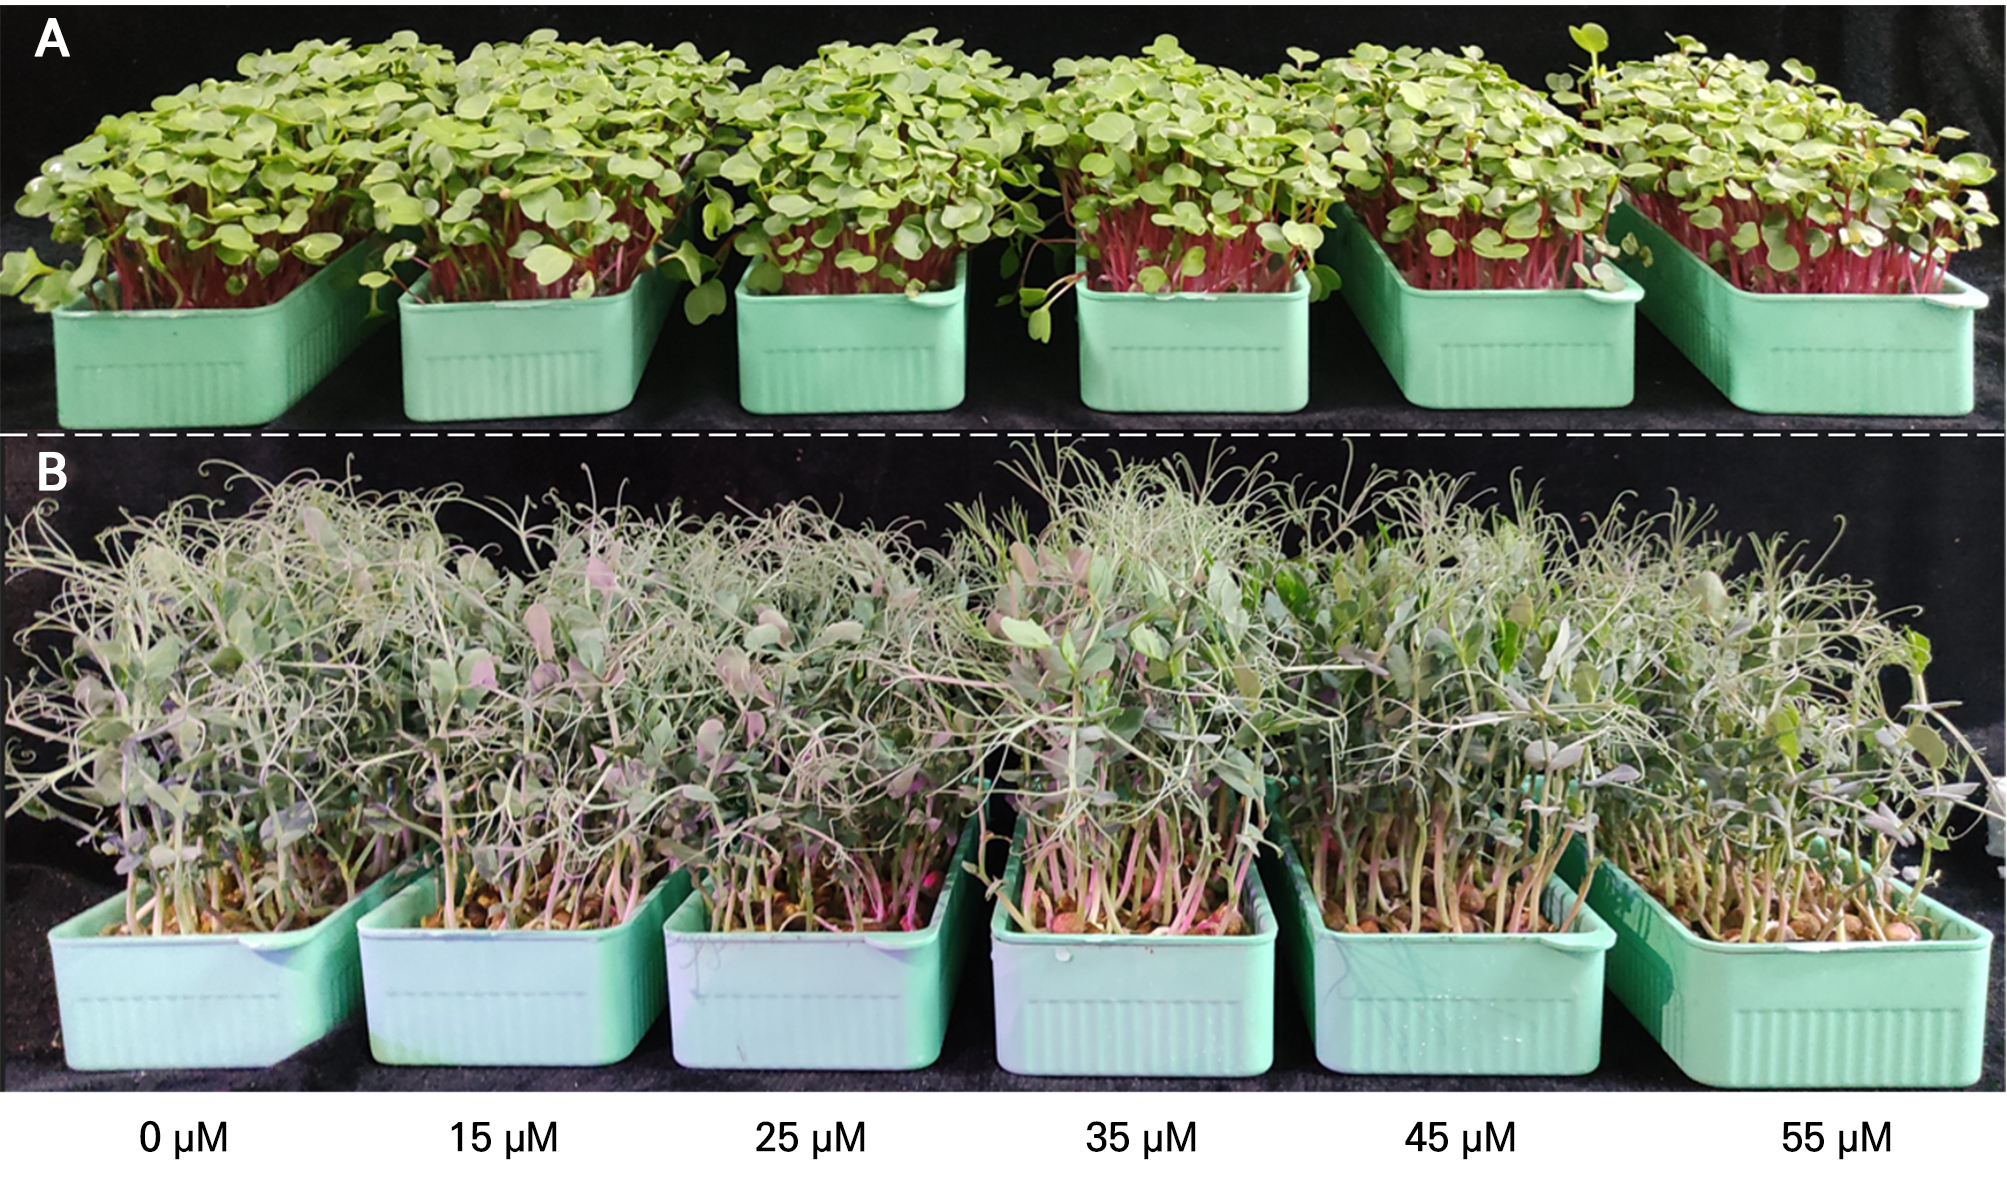
The interaction between microgreen species and Se application concentration significantly influenced plant height, fresh weight, and shoot water content (PV×C < 0.05). Sodium selenite concentration below 35 µM in nutrient solution maintained the growth of radish and pea microgreens, suggested by keeping the fresh weight (Table 1) compared to control (0 µM). Compared with the control group, the 45 µM and 55 µM sodium selenite treatment groups exhibited a 12–18% reduction in plant height and a 14–20% reduction in fresh weight in microgreens, accompanied by visible symptoms of Se toxicity (leaf chlorosis) (Fig. 1). Notably, the water content of radish and pea microgreens both peaked at 35 µM selenite (Table 1).
Table 1.
Effects of sodium selenite concentrations in nutrient solution on growth of radish and pea microgreens
Total Se and different organic Se contents
Sodium selenite treatment resulted in a significantly different level of Se accumulation between the two types of microgreens (PV×C < 0.001). (Fig. 2). The total Se content and organic Se content in the Se-treated radish shoots were 7–10 times than that of pea shoots (Fig. 2A and 2B) and the total Se and organic Se contents in the Se-treated radish roots were 2–3.5 times than that of pea roots (Fig. 2D and 2E). Radish microgreens grown at 35 µM selenite had the maximal total Se and organic Se concentrations in both shoots and roots (Fig. 2A, 2B, 2D and 2E). Pea microgreens grown at 25 µM selenite had the maximal total Se and organic Se concentrations in shoots, while those grown at 45 µM selenite had maximum total Se and organic Se in roots (Fig. 2A, 2B, 2D and 2E). However, compared to lower concentrations (15 µM), higher selenite concentrations (45 µM and 55 µM) decreased the proportion of organic Se in radish shoots by 27.2% and 32.1%, and in pea shoots by 27.2% and 32.1%, respectively, with similar trends observed in roots (Fig. 2C and 2F). The total and organic Se levels in radish microgreen roots were 5.4 to 11.4 times higher than in shoots. In pea microgreens, root Se levels were 15.3 to 40.1 times greater than shoot levels (Fig. 2). For pea microgreens, only 15–25 µM selenite treatment increased TF compared to control (Fig. 3). For radish microgreens, additional selenite treatment rarely affected TF (Fig. 3). Both SeCys, MeSeCys, SeMet, Se(VI) and Se(IV) were detected in radish microgreens under selenite treatments (15–55 µM), with the highest contents in 35 µM and 55 µM treatments compared to other treatments (Table 2). In pea microgreens, only SeCys and Se(IV) were detected, with peak values at a concentration of 35 µM selenite (Table 2).
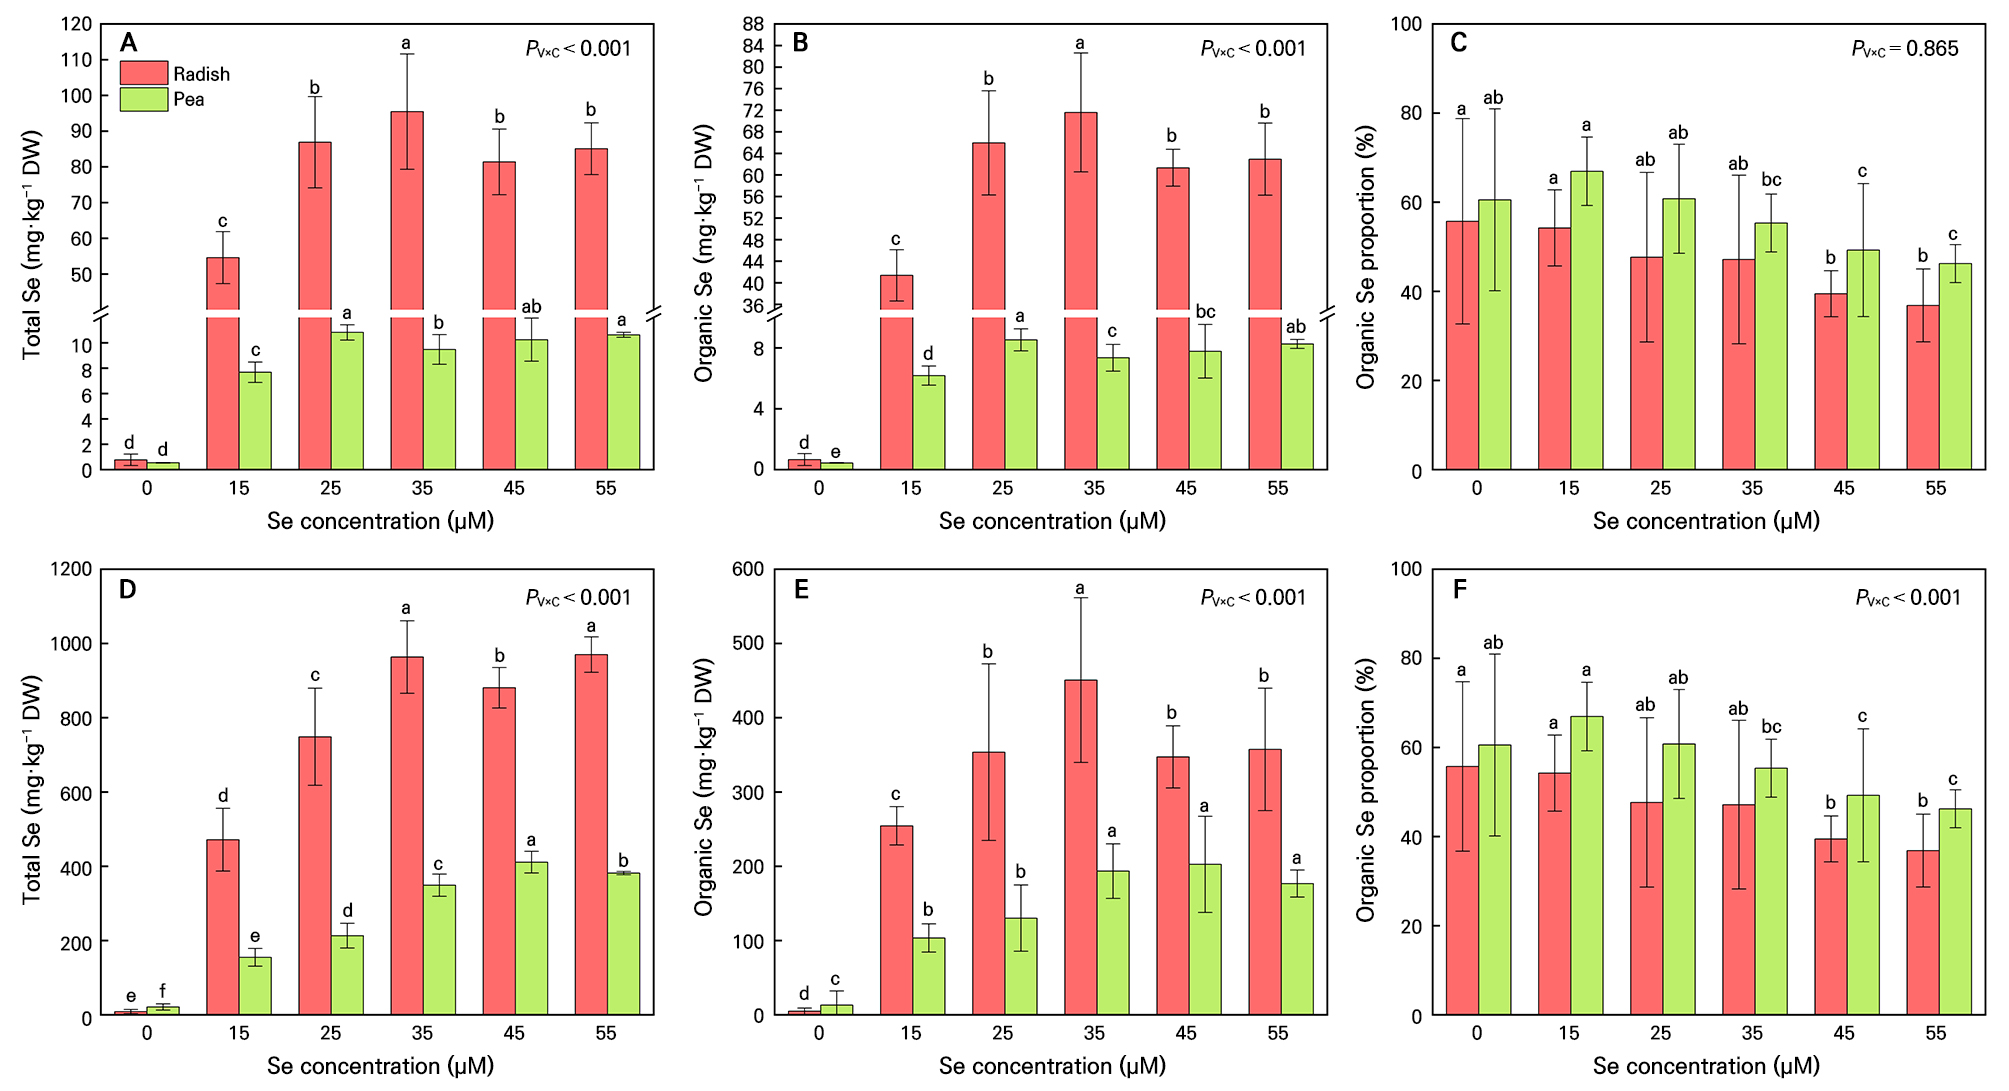
Fig. 2.
Total and organic selenium (Se) contents as well as organic Se proportion in radish and pea microgreens. Microgreens were grown under five treatments: 0, 15, 25, 35, 45 and 55 µM sodium selenite. The solid lines of the bar chart represent the 95% confidence interval. n = 4. Different letters indicate significant differences at P = 0.05. Two-way ANOVA was performed for each parameter. The table presents the P-values for the interaction effect between microgreen varieties (PV) and Se concentration treatment (PC) (PV×C).
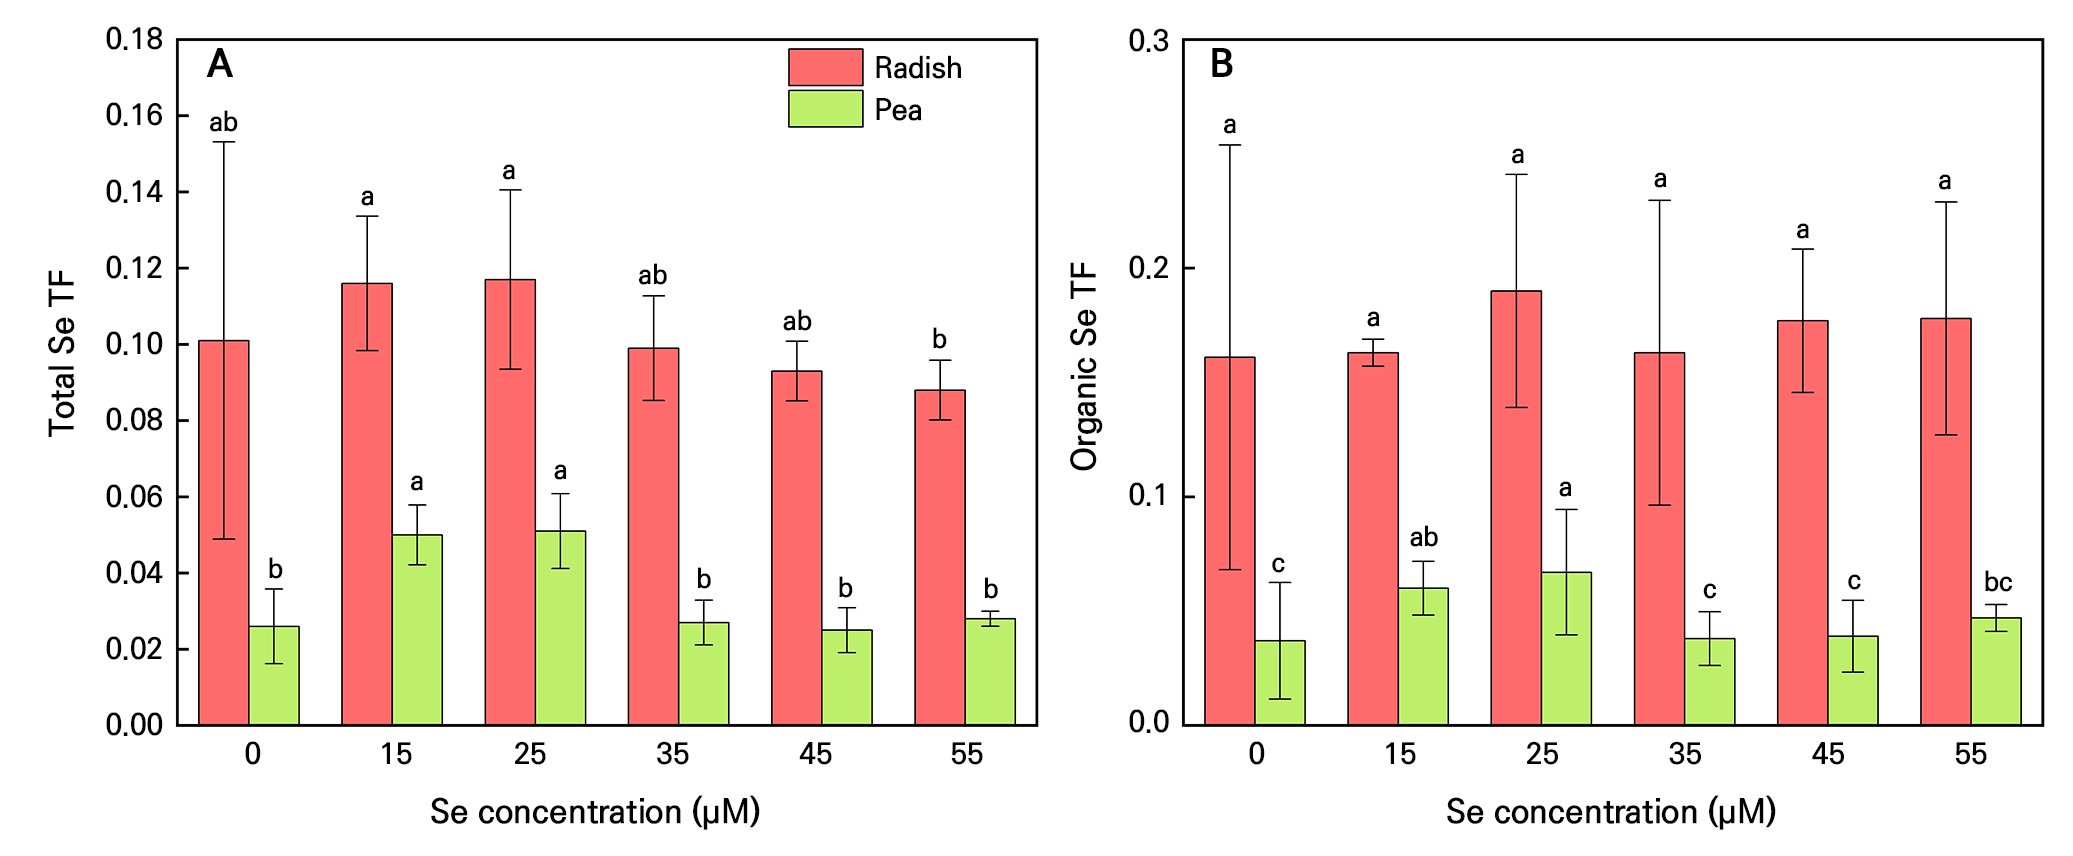
Fig. 3.
Transporter factors of total and organic selenium (Se) in radish and pea microgreens. Microgreens were grown under five treatments: 0, 15, 25, 35, 45 and 55 µM sodium selenite. The solid lines of the bar chart represent the 95% confidence interval. n = 4. Different letters indicate significant differences at P = 0.05.
Table 2.
Effects of sodium selenite concentration on SeCys, MeSeCys, SeMet, Se(IV) and Se(VI) contents in dried radish and pea microgreens shoot samples
xData are means ± SE; n = 4. Error bars with different letters for the same plant indicate significant differences (P = 0.05). n.d.: not detected. Two-way ANOVA was performed for each parameter. The table presents the P-values for the interaction effect between microgreen varieties (PV) and Se concentration treatment (PC) (PV×C).
Se metabolic enzyme contents
Following inorganic Se absorption from roots, Se will be converted to organic forms via GSH, ATPS, CS, and SMT (Somagattu et al. 2024). The interaction between microgreen species and Se application concentration significantly influenced only the expression levels of ATPS and CS (PV×C < 0.05). At selenite concentrations of 25–35 µM, the levels of GSH, ATPS, CS and SMT were higher than other treatments (Fig. 4).
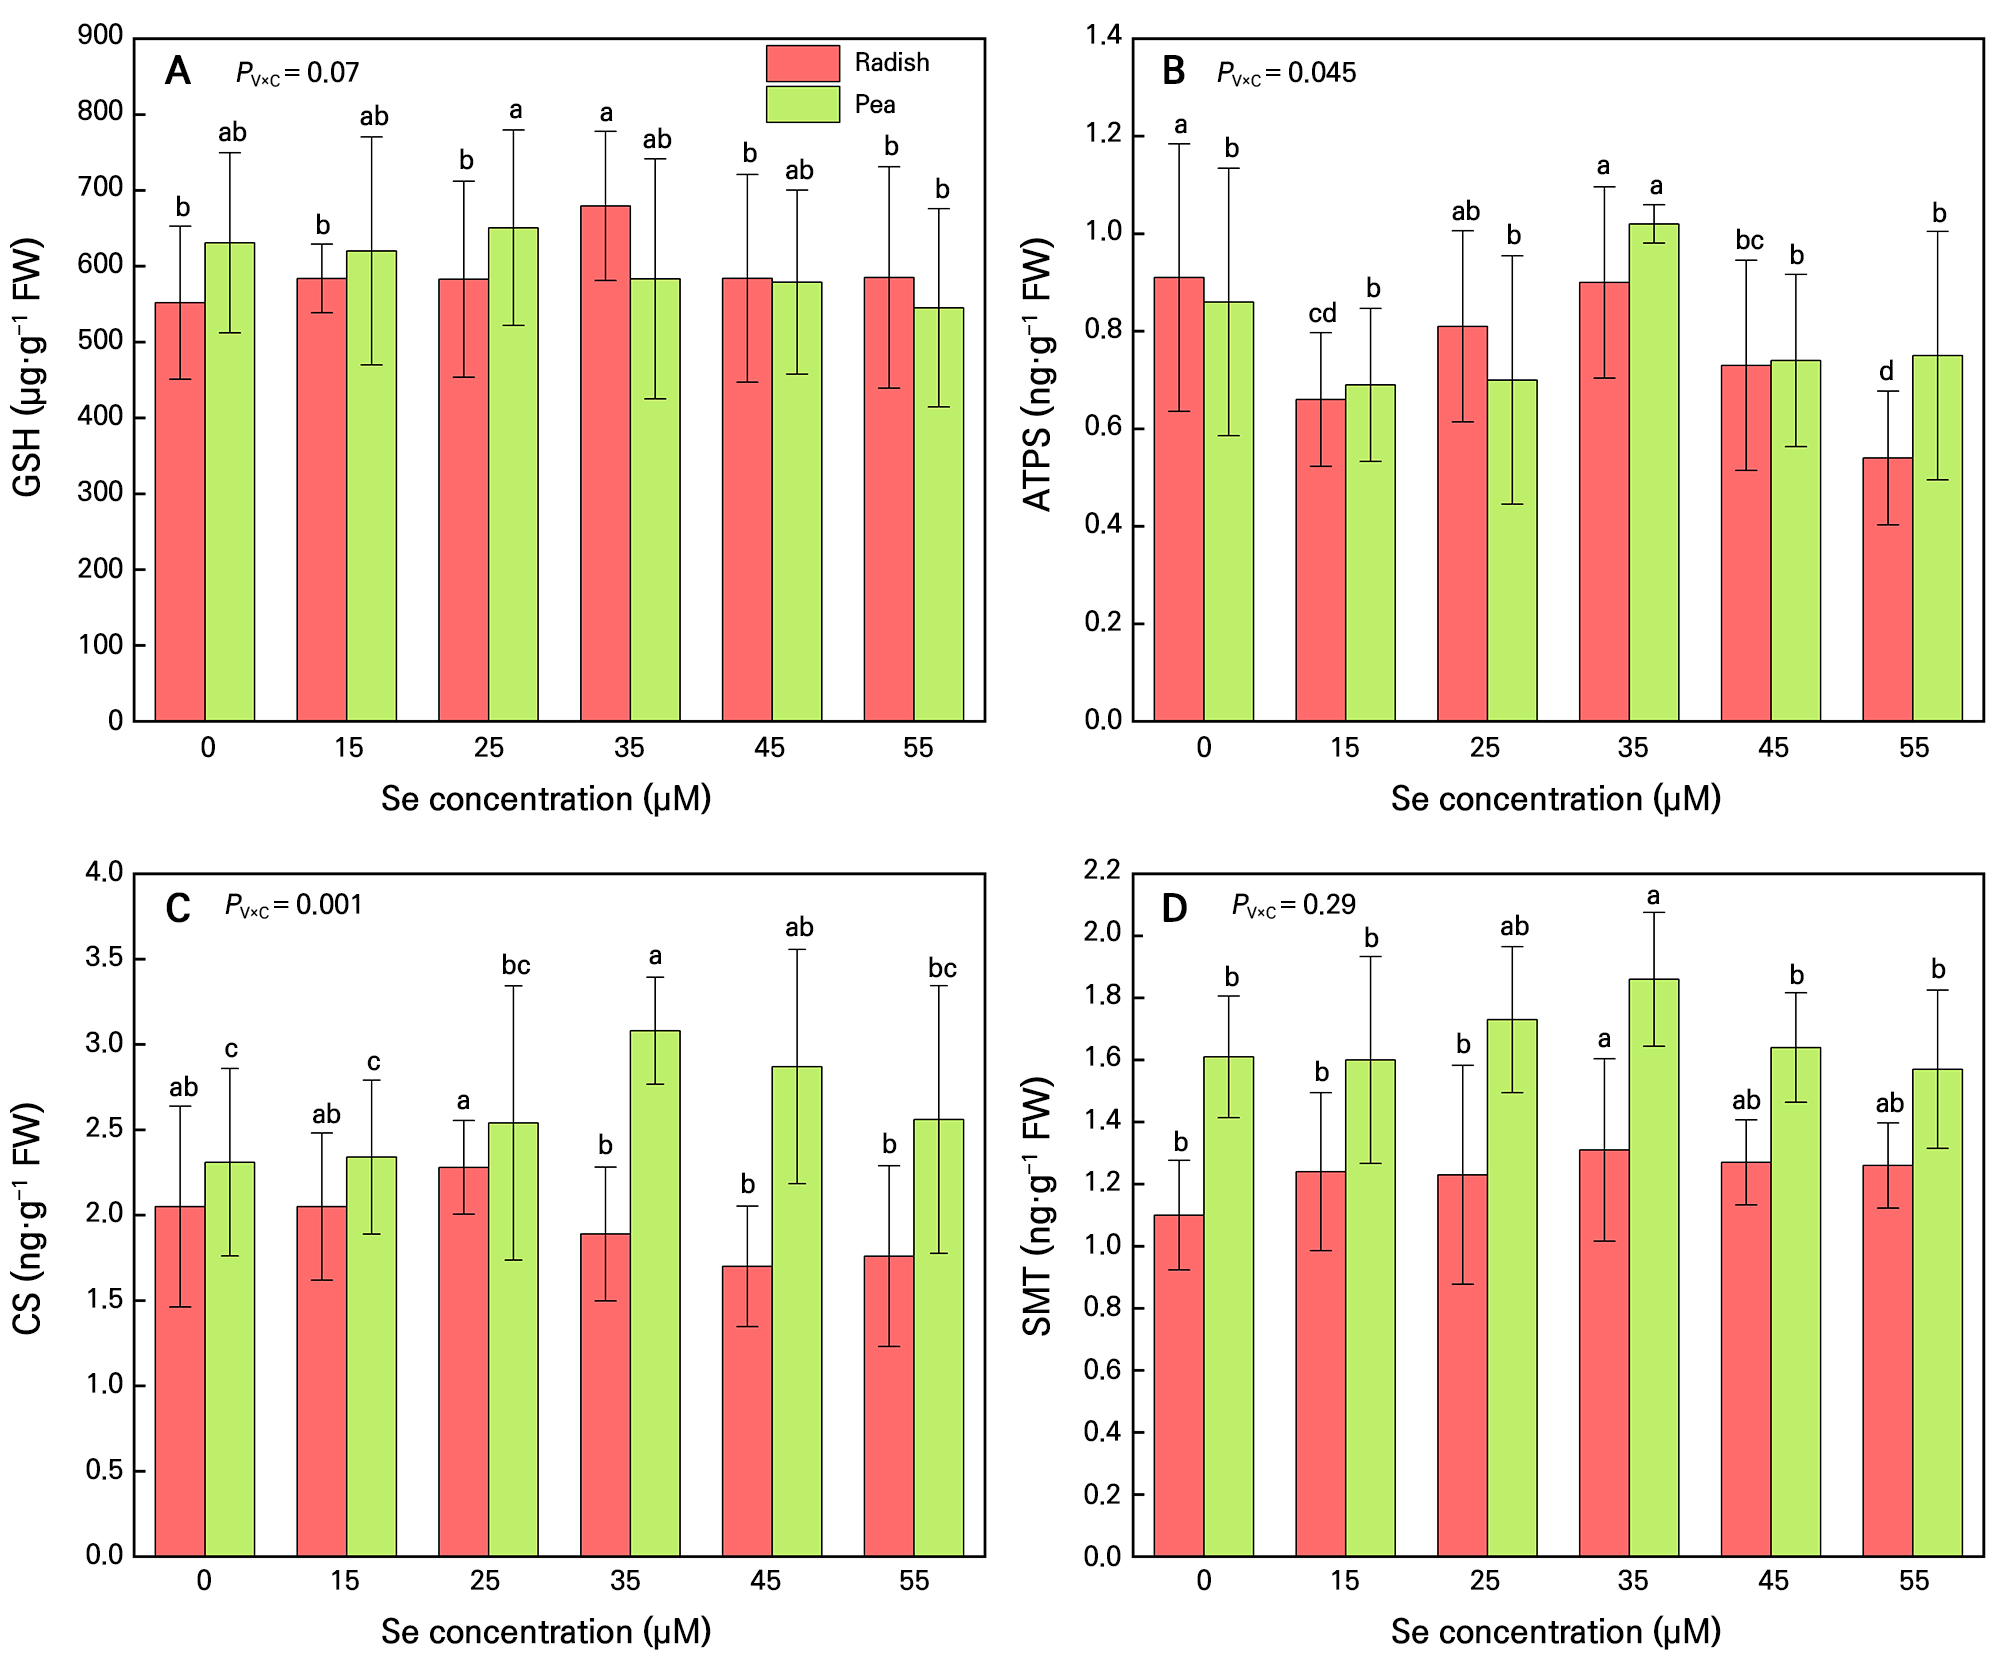
Fig. 4.
Se metabolic enzyme contents in radish and pea microgreens. (A) Reduced glutathione (GSH) content, (B)ATP sulfatase (ATPS) content, (C) Cysteine synthase (CS) content, (D)Selenocysteine methyltransferase (SMT) content. Microgreens were grown under five treatments: 0, 15, 25, 35, 45 and 55 µM sodium selenite. The solid lines of the bar chart represent the 95% confidence interval. n = 4. Different letters indicate significant differences at P = 0.05. Two-way ANOVA was performed for each parameter. The table presents the P-values for the interaction effect between microgreen varieties (PV) and Se concentration treatment (PC) (PV×C).
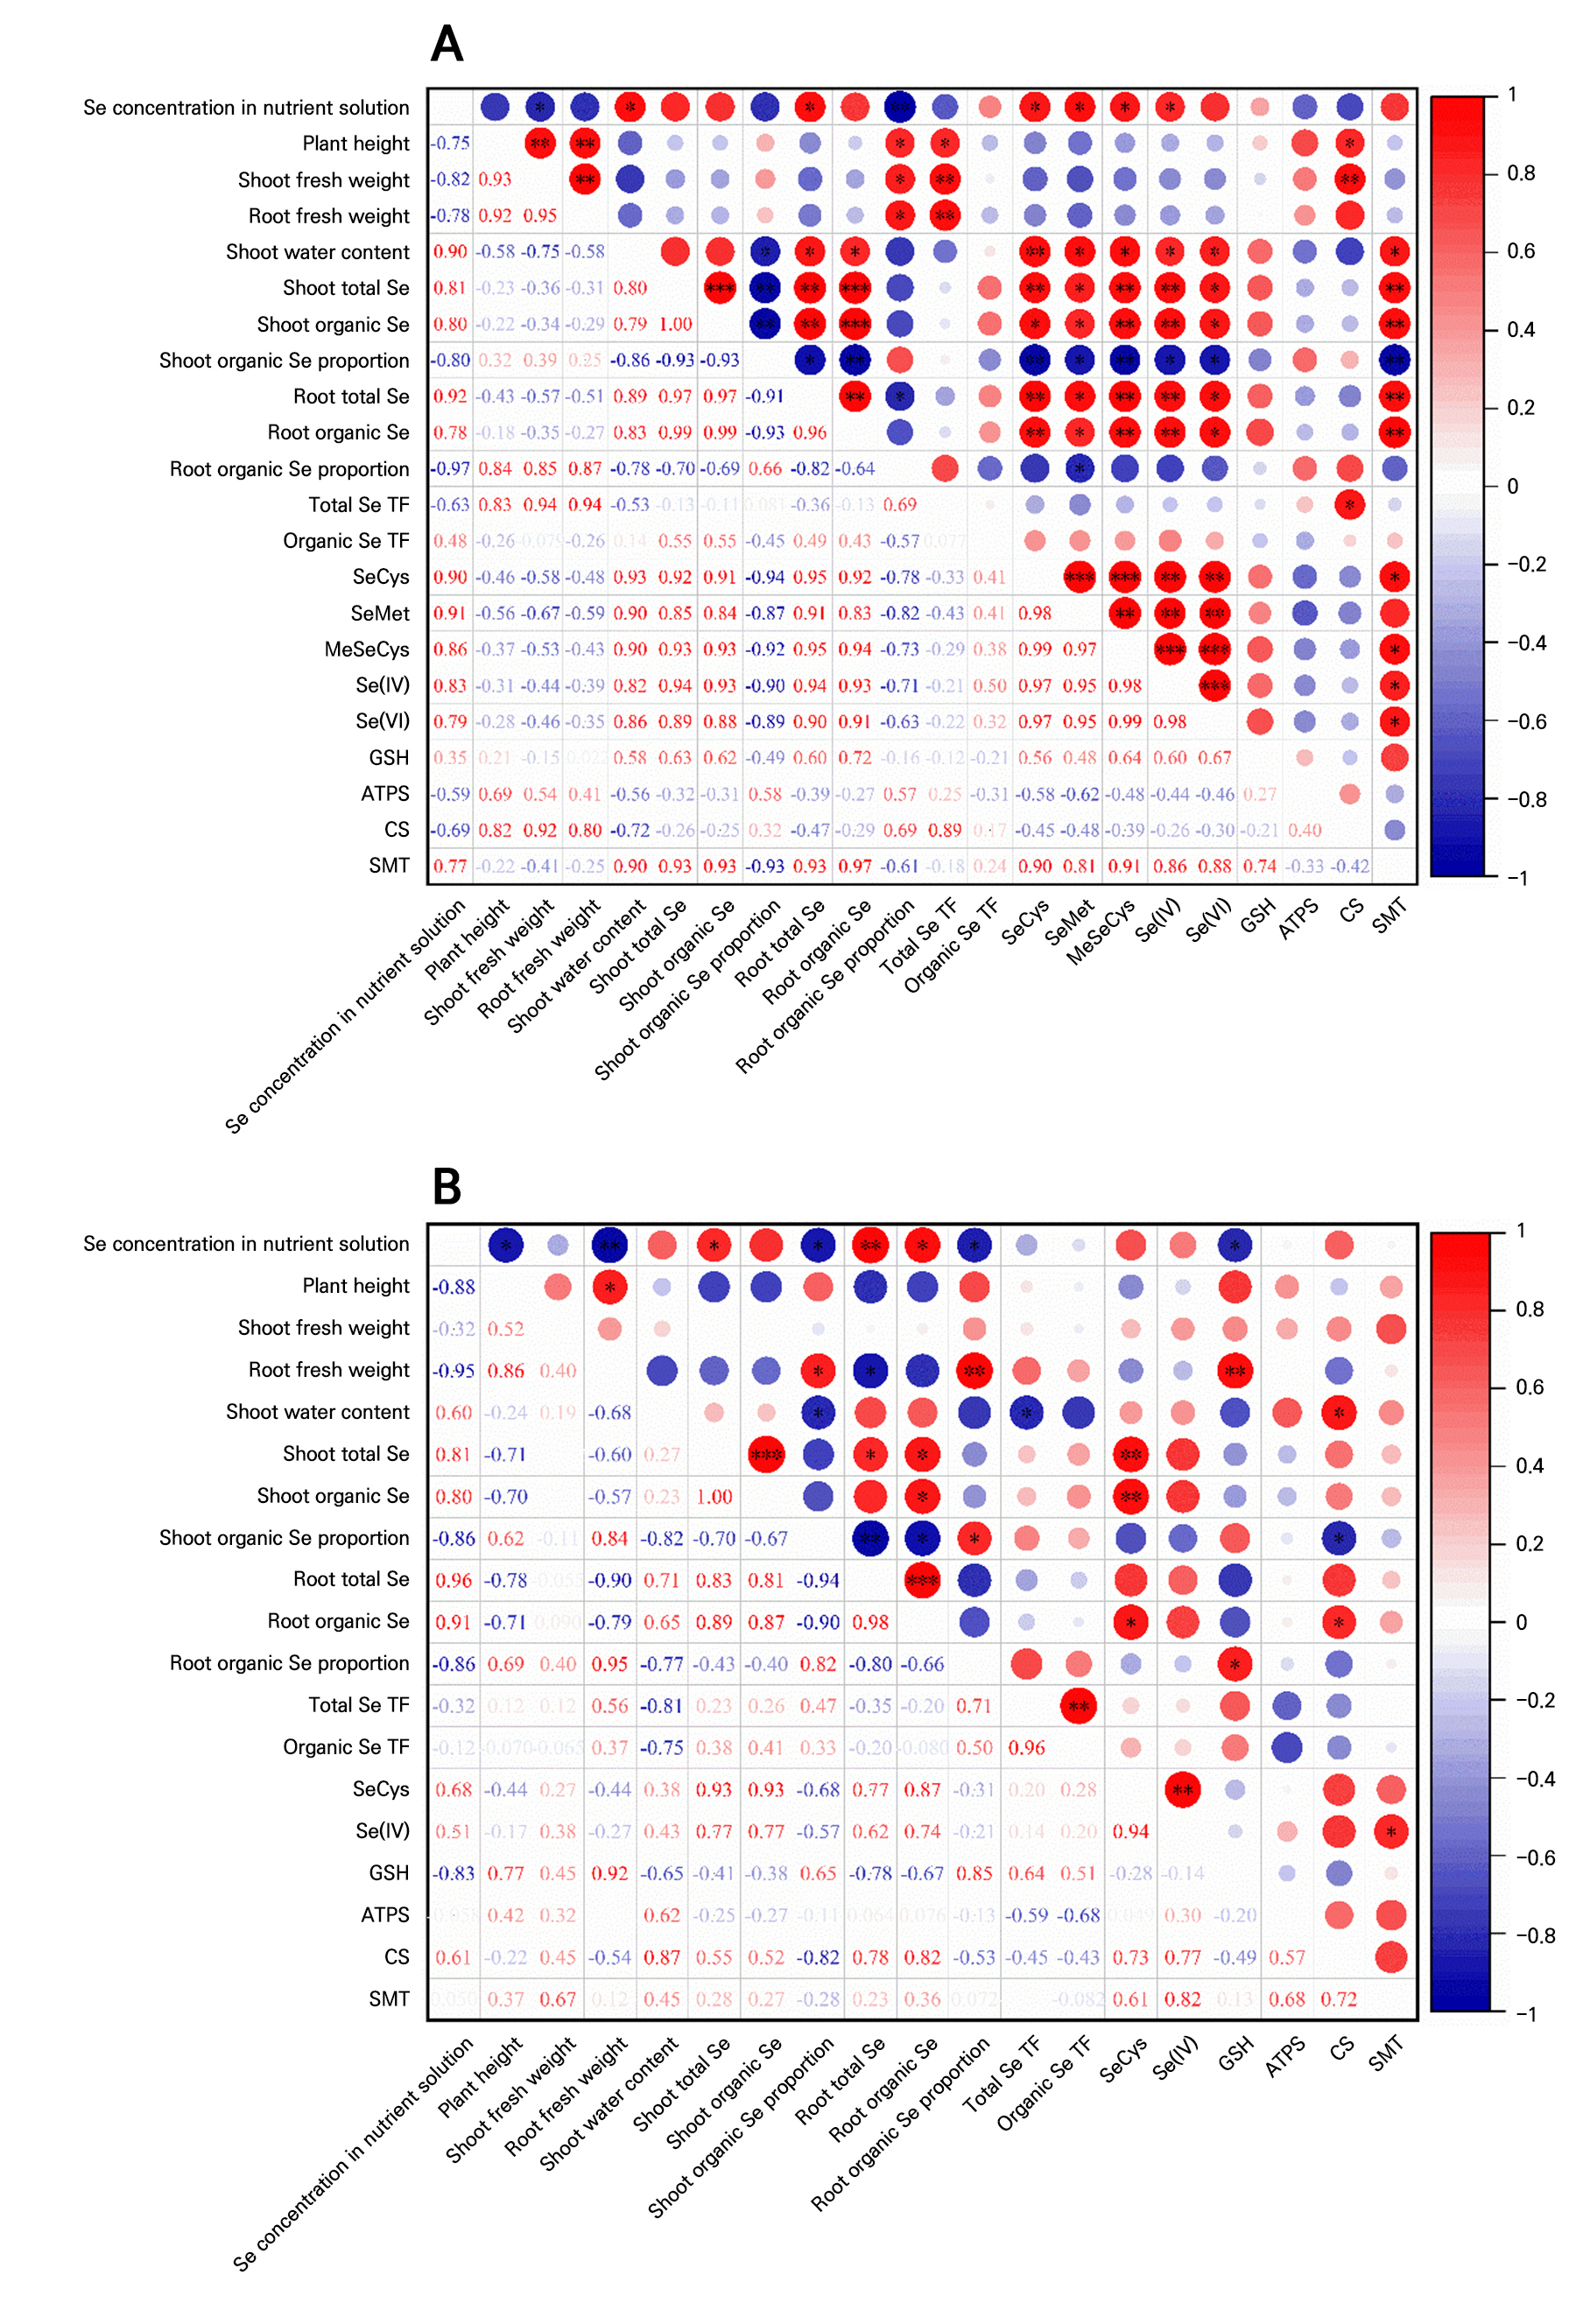
Correlations between indicators
In both species, total Se content in roots correlated positively with that in shoots. However, the proportion of organic Se in shoots correlated negatively with both the total and organic Se contents in roots (Fig. 5). The SeCys, SeMet, and MeSeCys contents in radish microgreens were positively correlated with the total Se and organic Se contents in both roots and shoots. In radish microgreens, the expression of CS was positively correlated with the total Se TF, while the expression of SMT was positively correlated with MeSeCys content and total Se and organic Se content in both roots and shoots (Fig. 5A). In pea microgreens, the concentration of SeCys was positively correlated with the organic Se content in both roots and shoots as well as the total Se content in shoots. Moreover, GSH content was positively correlated with root fresh weight and the proportion of organic Se in pea microgreens (Fig. 5B).
Discussion
In this study, we investigated the effects of 0–55 µM sodium selenite in nutrient solutions on the growth and Se metabolisms in radish and pea microgreens. We found that Se accumulation in microgreens displays a non-monotonic dose-response relationship under varying Se concentrations. However, many studies showed that Se contents in plants increased with the increased selenite application (Bañuelos et al. 2025; Šlosár et al. 2025). This might be because a relative low selenite concentration setup in those studies, for example, 0–5.2 µM selenite application in Francini et al. (2023) and 0–40 µM in Puccinelli et al. (2019). If the selenite concentration continued to increase, it could lead to Se poisoning or even death of microgreens (Gupta and Gupta 2017; Grudzińska et al. 2023), also reflected by a largely reduced fresh weight in microgreens under 55 µM selenite application (Table 1).
The metabolism of selenite in plants requires S assimilation pathway, through which selenite is sequentially reduced to selenides (Se2-), then converted to SeCys or MeSeCys (Zhou et al. 2025). Our study showed that Se transport and metabolism in radish and pea microgreens are tightly regulated by selenite concentration in nutrient solutions. Appropriate concentrations of Se can enhance the expression of enzymes involved in Se metabolism in microgreens, and those enzymes can mediate the reduction and biotransformation of inorganic Se into organic species (Schiavon and Pilon-Smits 2017). This may occur because Se treatment enhances the expression of ribosomal protein genes in microgreen cells, and these proteins play crucial roles in DNA replication, transcription, DNA damage repair, and cell growth regulation (Cheng et al. 2023). Those enzymatic upregulations could promote Se uptake and detoxification, support efficient Se accumulation and conversion while mitigating oxidative stress (Diao et al. 2014; White 2016; Chao et al. 2022). This may lead to the upregulation in organic Se, such as SeCys in pea and SeCys, SeMet and MeSeCys in radish (Table 2). However, in pea microgreens, a higher Se application (45–55 µM) could reduce the catalytic efficiency of GSH, ATPS, CS and SMT, possibly through thiol oxidation and conformational changes, thus downregulating of the expression of S transporters and the above enzymes (Schiavon et al. 2015; Lazard et al. 2017). This showed that Se metabolic homeostasis disruption is one of the symptoms when Se reaching toxic level.
Exogenous Se application can also affect shoot-root distribution of Se. Roots of Se treated plants contained elevated transcript levels of sulfate transporters (Sultr) and ATPS, a key enzyme of S/Se assimilation (Schiavon et al. 2016). Our study demonstrated that at low Se (15–25 µM) concentrations in the nutrient solution, Se could be efficiently absorbed by roots and partially translocated to shoots via the xylem, where active metabolism promotes the synthesis of beneficial selenocompounds (Puccinelli et al. 2017; Li et al. 2020). Schiavon et al. (2016)'s study yielded similar results, demonstrating a significant upregulation of the high-affinity sulfite transporter genes Sultr1;1 and Sultr1;2 in radish roots following treatment with 40 µM Se. This increased transcript abundance accounts for the enhanced Se accumulation in leaf tissues under hydroponic conditions and explains the markedly higher [Se]leaf/[Se]root ratio. In contrast, higher Se levels (≥45 µM) reduced Se translocation efficiency, possibly triggered vacuolar sequestration and chelation of Se. These responses demonstrated that excess Se could be compartmentalized to avoid toxicity, albeit at the cost of decreasing Se metabolic efficiency. Notably, similar trend observed in both radish and pea microgreens suggests a conserved mechanism of Se uptake, transport and detoxification among these two species. Collectively, these findings highlight the effects of exogenous Se in regulating Se uptake, enzymatic metabolism and shoot-root distribution, thereby providing a mechanistic foundation for optimizing Se-enriched cultivation in controlled environments.
Generally, the effect of Se on plant growth primarily depends on its concentration. Low concentrations promote growth, whereas high concentrations inhibit it (Hossain et al. 2021). These contrasting effects of Se may be associated with alterations in primary metabolism and nutrient status (Wen 2021). An appropriate concentration of Se could help maintain chloroplast structure and plasma membrane fluidity, thereby enhancing photosynthetic efficiency and promoting the accumulation of photosynthates that support plant growth (Filek et al. 2010; Cao et al. 2022). Additionally, Cheng et al. (2023) reported that low-dose Se (≤26 µM) treatment can upregulate genes involved in starch/sucrose metabolism and ribosomal protein biosynthesis in legume seedlings, which may contribute to accelerated growth. These results indicate that the appropriate exogenous application of Se can enhance plant growth.
This study revealed that the Se accumulation in the shoots and roots of radish microgreens was much higher than that in pea microgreens. Although both Brassicaceae and Leguminosae plants are classified as Se accumulating species, Brassicaceae species are generally with higher Se accumulation capacity compared to Leguminosae species (Dhillon and Dhillon 2009; Huang et al. 2022; Đulović et al. 2023). Pannico et al. (2020) reported that Se accumulation in cruciferous green basil and purple basil microgreens was significantly greater than in coriander and tatsoi microgreens. A similar trend was observed in the study by Viltres-Portales et al. (2024), where total Se concentrations in Se-enriched cruciferous kale and kohlrabi microgreens were markedly higher compared to cereal wheat microgreens. Radish microgreens, a member of the Brassicaceae family was reported to rich in glucosinolates (Rao et al. 2021). This characteristic is attributed to the presence of numerous sulfur transporters (Sultr1 and Sultr2) that facilitate the uptake of S from the external environment. Moreover, Sulfate transporter proteins exhibit strong affinity for Se, a chemical congener of sulfur, which can promote root Se absorption (Schiavon et al. 2016). Metabolic enzymes in radish microgreens (e.g., ATPS and CS) demonstrate high catalytic efficiency for Se, facilitating its conversion into glucosinolate degradation products or selenoproteins (Schiavon and Pilon-Smits 2017). This metabolic pathway can reduce the formation of toxic selenides (e.g., hydrogen selenide) while enhancing Se accumulation capacity. Future studies could employ transcriptomics or CRISPR technology to elucidate the differentiation mechanisms of Se metabolic pathways in Cruciferae and Leguminosae, thereby revealing the genetic basis for radish microgreens' higher capacity (7–10 times) to accumulate total Se and organic Se compared to pea microgreens.
Finally, we admit that the 12-day growth cycle of microgreens in this study may limit its applicability for elucidating long-term Se metabolism in vegetables, highlighting the need for further research on Se enrichment in mature vegetable crops. Leveraging the controlled nutrient supply and environmental conditions inherent to PFAL offers a promising and scalable strategy for the mass production of Se-enriched vegetables. Daily consumption of such vegetables could serve as a convenient and effective means of Se supplementation for humans. According to World Health Organization (WHO) guidelines, the recommended daily Se intake for adults is 55 µg, with a tolerable upper intake level of 400 µg. In this context, consuming 10–50 g of radish microgreens or 55–400 g of pea microgreens produced under the conditions of this study can meet the daily Se requirements without exceeding safety thresholds. In fact, application Se is a double-edged sword: an increase in Se concentration generally leads to a corresponding rise in the levels of inorganic Se in plants. However, boiling, frying and fermentation could be used to reduce the inorganic Se concentrations in our food (Alzate et al. 2008; Zhou et al. 2021).
Conclusion
When adding different concentrations of sodium selenite (0–55 µM) in nutrient solution, total and organic Se contents in plants reached maximum at 35 µM Se treatment in radish microgreens and reached a plateau at 25–55 Se µM treatment in pea microgreens. However, 45–55 µM Se significantly reduced fresh weight and plant height compared to lower Se concentrations. 35 µM Se increased contents of GSH and SMT in radish and contents of ATPS, CS and SMT in Pea, compared to other Se concentrations, which upregulated the level of a series of organic Se in microgreens. Furthermore, radish microgreen had higher total Se and organic Se concentrations compared to pea microgreen, making radish a more suitable microgreen for Se-enriched production. In conclusion, the biofortification of PFAL-grown microgreens with appropriate Se concentrations is feasible for producing edible Se-enriched microgreens.
