

Introduction
Temperature is an environmental factor that affects plant growth and development and for these biological processes minimum (base), optimal, and maximum temperatures can be determined experimentally (Yan and Hunt, 1999; Jami AIAhmadi and Kafi, 2007). The minimum temperature is defined as the lowest temperature at which plant growth starts and the maximum temperature is the highest possible temperature for plant cultivation.
The germination rate increases from the minimum to the optimal temperature but decreases from the optimal to the maximum temperature. Germination is completely inhibited below the minimum and above the maximum temperatures. Therefore, these cardinal temperatures provide important information for successful management of the environment in a greenhouse or plant factory (Montieth, 1981; Seefeldt et al., 2002; Jami AI-Ahmad and Kafi, 2007). In addition, cardinal temperatures can be used to predict the response of the plant to climate change and to estimate the growth, maturity, and yield of the plant. These cardinal temperatures can be estimated from data on plant development, which is primarily a temperature-dependent process, and from germination experiments in experimental conditions with different constant temperatures (Roché et al., 1997).
To estimate cardinal temperatures, several studies have been conducted that use model equations (Del Monte and Tarquis, 1997; Roche et al., 1997; Aflakpui et al., 1998; Seefeldt et al., 2002; Hardegree, 2006; Jami AI-Ahmadi and Kafi, 2007; Cho et al., 2012). Models that can be used to estimate the cardinal temperatures include a linear model (Aflakpui et al., 1998), a parabolic model (Yin et al., 1995; Roche et al., 1997; Yan and Hunt, 1999; Seefeldt et al., 2002; Hardegree, 2006; Cho et al., 2012), and a beta distribution model (Yin et al., 1995; Yan and Hunt, 1999).
Seeds of the common ice plant generally germinate under light conditions after 30-90 days; however, the seed can germinate immediately depending on the seed size (Adams et al, 1998). The base and optimal temperatures to cultivate the plants are 0-5°C and 20-25°C, respectively (Monteith, 1981) but we lack information on the cardinal temperatures for germination of seed from the common ice plant.
The aim of this study was to estimate the cardinal temperatures for the germination of seed from the common ice plant using bilinear, parabolic, and beta distribution functions, and to find a model that reflects the response of germination to temperature.
Materials and Methods
In this study, home-produced seeds from the common ice plant were used. The seeds were germinated in a growth chamber at 24°C to determine the light requirements for the germination process. In addition, seeds were germinated in growth chambers at constant temperatures of 16, 20, 24, and 28°C under dark conditions. To select an accurate model, seeds of the common ice plant were germinated at constant temperatures of 6, 12, 32, and 36°C under dark conditions. At each temperature, four replicates of 100 seeds were placed on two layers of filter paper (Whatman No. 2) in 9-cm petri dishes and watered with 5 mL of distilled water. The emergence of a radicle of 0.1 mm in length was defined as germination. Germinated seeds were counted and removed daily. Germination was fitted using a logistic function (Lopez et al., 2008). The germination time (time to 50% germination) and final germination (7 days after sowing) were calculated using Eq. 1.
Y = M × [1 + exp (-k × (t-L))]-1 Eq. 1
where Y is the cumulative germination percentage at time t, M is the maximum potential germination, L is the time scale constant, and k is the rate of increase (Roché et al., 1997). The minimum, optimal, and maximum temperatures were estimated by regressing the inverse of the time to 50% germination against the temperature gradient. The bilinear model (Cha et al., 2014), parabolic model (Cho et al., 2012; Cha et al., 2014), and beta distribution model (Cha et al., 2014) were used to predict the cardinal temperatures.
A completely randomized design was used as the experimental design with four replications. The parameters were estimated using the Gauss-Newton algorithm, a nonlinear least squares technique. Statistical computations were carried out using SigmaPlot (SPSS Inc., USA) and SAS (SAS Institute Inc., USA) software. The experimental results were subjected to analysis of variance (ANOVA). When significant differences were observed, the means were separated using Duncan’s multiple range test at the 5% level.
Results and Discussion
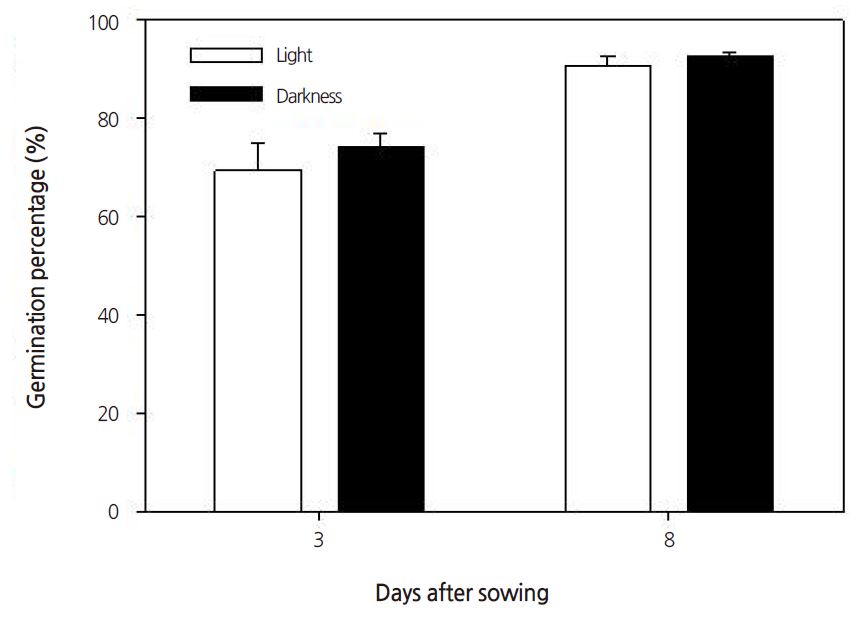
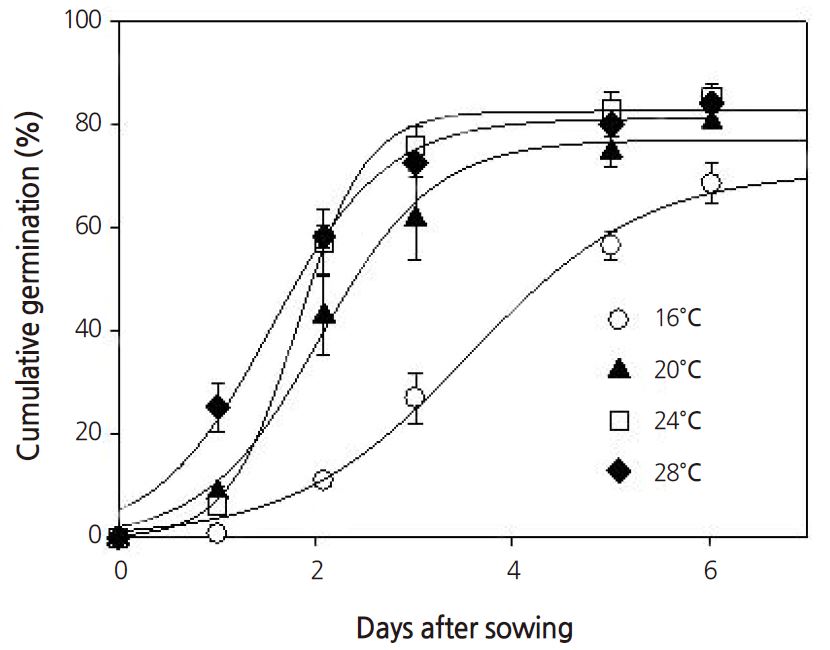
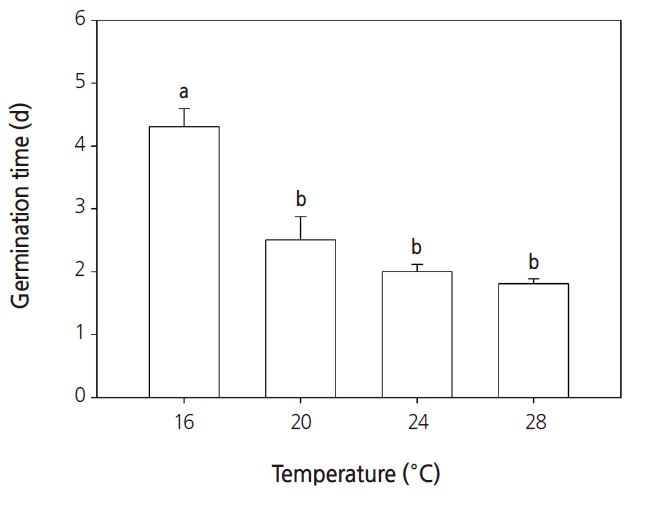
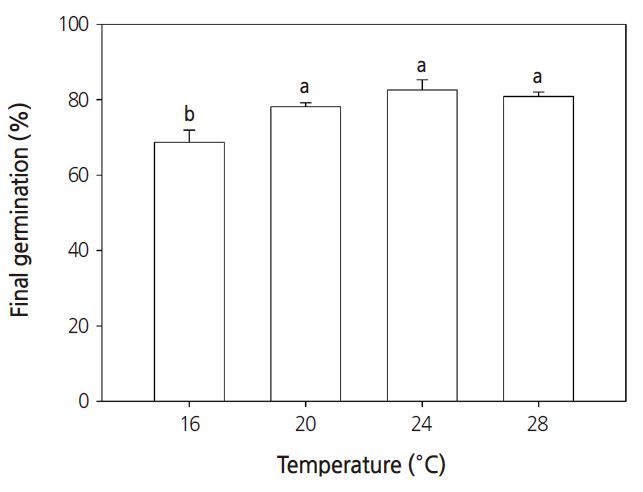
Seeds require the proper light, temperature, moisture, and humidity to germinate; for example, some seeds require light to germinate, some seeds require dark conditions. Seeds of the common ice plant generally require light to germinate, but in this study, no significant differences in germination percentages were observed between light or dark conditions (Fig. 1). Under constant temperature conditions between 16°C and 28°C, the germination percentage increased when the temperature increased to above 20°C (Fig. 2). Under all temperature conditions, the first germination was observed after 1 day. The germination percentage was lowest at 16°C (Fig. 3). At 16, 20, 24, and 28°C, the number of days to 50% germination were 4.3, 2.5, 2.0, and 1.8, respectively. The number of days to germination decreased with increasing temperature and thus the germination percentages increased at higher temperatures. Consistent with this, the common ice plant prefers dry conditions, full sun, and a warm climate. The final germination percentage was lowest at 16°C, but there were no significant differences between 20 and 28°C (Fig. 4).
| |
Fig. 1. Germination percentages of seed from the common ice plant in dark and light conditions. Data are means ± SE of four replications. | |
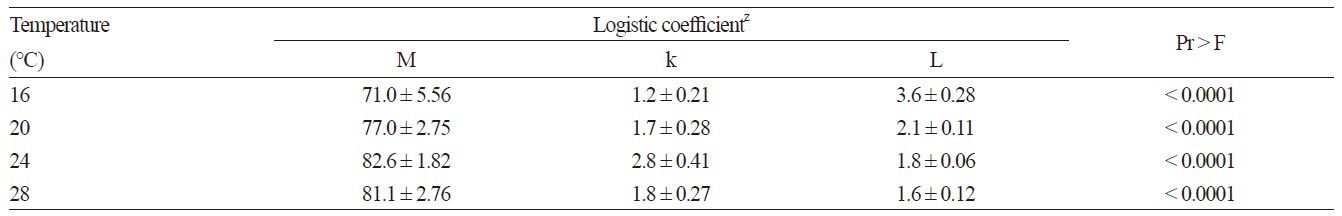
The germination curves followed a sigmoidal pattern and can therefore be fitted using a logistic function (Lopez et al., 2008). Table 1 lists the coefficients of the logistic function at the different constant temperatures. The maximum potential germination and rate of increase were highest at 24°C and lowest at 16°C. The time scale constant was highest at 16°C.
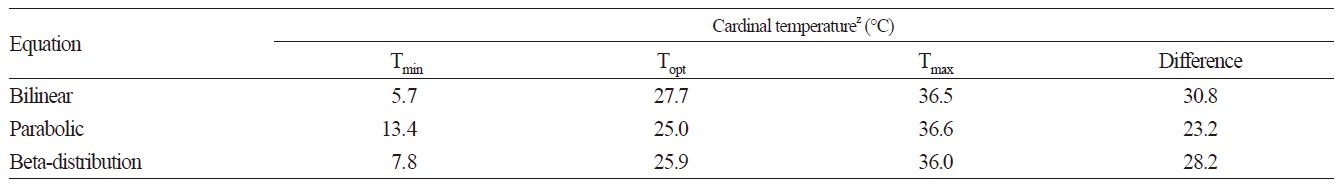
Next, the minimum, optimal and maximum temperatures were estimated from the inverse of the time to 50% germination, using bilinear, parabolic, and beta distribution functions. The inverse of the time to 50% germination was estimated using Eq. 1 (Fig. 5). The estimated minimum, optimal and maximum temperatures were 5.7, 27.7, and 36.5°C, respectively, for the bilinear function, 13.4, 25.0, and 36.6°C for the parabolic function, and 7.8, 25.9, and 36.0°C for the beta distribution function (Table 2). The models estimated an inverse of time to a 50% germination rate of 0 at 6 and 36°C. The observed final germination rates at 12 and 32°C were 62 and 97%, respectively. Therefore, the beta distribution function provides a useful model for estimating the cardinal temperatures of the common ice plant.
| |
Fig. 5. Three models of the germination rate, 1/GR50 (the inverse of time to 50% germination) for seeds from the common ice plant. Data are means ± SE of four replications. | |
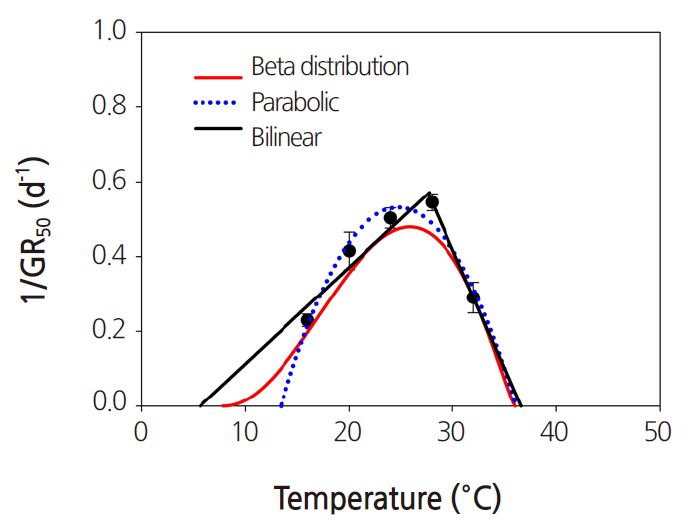
Table 2. The cardinal temperature for 50% germination of seed from the common ice plant using a parabolic function.
| |
zTmin, Topt, and Tmax were minimum, optimum, and maximum temperatures, respectively. | |
Temperature regulates the timing of biological processes (McMaster and Wilhelm, 1997). An estimation of the cardinal temperatures provides important information for predicting the development, growth, and harvesting time of plants. Determination of the cardinal temperatures using a bilinear function often over-estimates the minimum or maximum temperature (Craufurd et al., 1998). Because the parabolic function is symmetrical around the optimal temperature, it also often estimates a minimum temperature that is too low and a maximum temperature that is too high (Yin et al., 1995). The beta distribution function is based on the temperature response of enzymatic activity and crop development (Yan and Hunt, 1999).
In conclusion, this study determined the cardinal temperatures for the germination of seeds from the common ice plant using the bilinear, parabolic, and beta distribution functions. The minimum, optimal and maximum temperatures estimated by the beta distribution function were 7.8, 25.9, and 36.0°C respectively, consistent with the fact that the common ice plant is a warm-season crop. These cardinal temperatures can be applied to growth models of the common ice plant in greenhouse or plant factory systems to achieve optimal plant growth while minimizing energy usage in plant factory conditions.
