

Introduction
Pepper (Capsicum sp.) is used internationally as a food source and for seasonings, dyes, and medicines. Because of its various flavors and colors, it is an integral part of many world cuisines. Because of its high palatability, commercial value, and adaptability (these plants tolerate nearly every climate), the species has become one of world’s staple vegetables fruit. Approximately 22% of the total vegetable fruit cultivation area in Korea is given to chili peppers (Statistics Korea, 2015). The annual commercial value of peppers in Korea has reached nearly $2 billion dollars, and continues to grow. However, virus infection of peppers has caused heavy losses in the rural economy. According to Choi et al. (2015), chili peppers were infected at the highest level (51.6%) of all vegetablesfruit cultivated in outfield systems in Korea. Several studies have reported that over 60 species of viruses can infect peppers (Kenyon et al., 2014). The major viruses found in peppers are Cucumber mosaic virus (CMV), Pepper mild mottle virus (PMMoV), Broad bean wilt virus 2 (BBWV2), Tomato spotted wilt virus (TSWV), and Impatiens necrotic spot virus (INSV) (Kaper et al., 1981).
CMV, the most frequently occurring virus in peppers, belongs to the genus Cucumovirus in the plant virus family Bromoviridae, and it infects over 1000 plant species in 85 families (El-Borollosy and Oraby, 2012). Since it was discovered as the causal disease agent of cucurbit hosts in 1916 (Doolittle, 1916; Jagger, 1916), CMV has been reported to infect cucumber, melon, zucchini, soybean, and tobacco (Baskaran et al., 2016; Mochizuki et al., 2014; Roossinck et al., 1990; Thompson et al., 2015). In Korea, the virus is associated with over 33% of chili pepper infections, and causes losses valued at approximately $200 million dollars each year. Many studies have sought to develop virus-resistant plants to prevent plant viral diseases.
One technique used to create disease resistance involves insertion of the viral coat proteins (CP) of a specific virus into the plant genome. CP-mediated protection shows a common phenomenon similarities with viral cross-protection (Ivanov and Makinen, 2012). The mechanism is not clearly understood, but it may involve interference with viral uncoating, or in virus replication. Several studies have shown that plants expressing viral coat protein genes are protected against viral infection; these genetically modified (GM) plants include tomato (Zrachya et al., 2007), tobacco (Nida et al., 1992), orange (Iwanami et al., 2004), sugarcane (Jain et al., 2007), and papaya (Krubphachaya et al., 2007). Insertion of CMV-CP genes in numerous pepper plants has successfully created CMV and tomato mosaic virus (ToMV)-resistant hot peppers (Shin et al., 2002), CMV-resistant sweet peppers (Chen et al., 2003), and CMV and tobacco mosaic virus (TMV)-resistant chili peppers (Cai et al., 2003).
However, driven by consumer demand for GM crops to be controlled and discriminated from other natural crops, the need for safety assessment and labeling information is increasing. Reliable analysis to qualify and quantify inserted and expressed proteins are forming a greater part of the safety assessment and management of GMOs. In the same way, optimization of qualification and quantification methods for viral CPs in the wild-type virus is required to assess the safety of these crops. In this study, we applied recently established analytical methods to detect viral CPs in virus-resistant GM crops using a peptide polyclonal antibody (Choi et al., 2015). An enzyme-linked immunosorbent assay (ELISA) was used to quantify the inserted protein in GM crops. In addition, we also confirmed variation in CP protein levels in GM peppers of different cultivation areas, harvest times, generations, or in different plant tissues.
Materials and Methods
Capsicum species
Virus-resistant pepper plants were developed by Agrobacterium tumefaciens-mediated transformation. The pCambia vector 2300 (CambiaLabs, Canberra, Australia) contains expression cassettes of CMV-CP and neomycin phosphotransferase II (NPT II) genes, each of which is flanked by the Cauliflower mosaic virus 35S promoter and the kanamycin selection cassette with a 2 × 35S promoter and 35S poly A terminator (Fig. 1). Seeds of GM pepper (Capsicum annuum var. Longum) cultivar ‘H15’ and its control line ‘P2377’, provided by the Biotechnology Institute of Nongwoo Bio Company Ltd., Korea, were cultivated at Chun-Ang University (Anseong, Gyeonggi-do, Korea), Korea University (Namyangju, Gyeonggi-do, Korea), and the Korea Research Institute of Bioscience and Biotechnology (KRIBB; Cheongju, Chungchung-do, Korea). Pepper samples were maintained at ?70ºC until required for analysis.
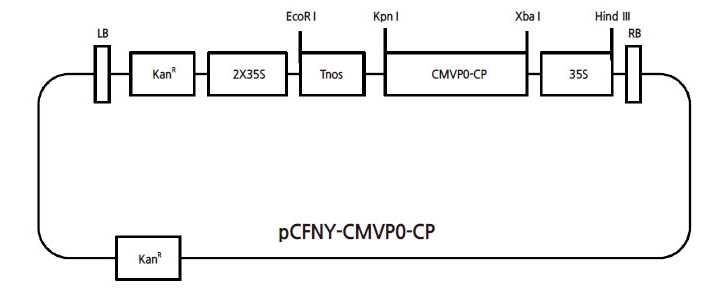
Fig. 1
Vector used for genetic transformation nR; the coat protein-encoding gene was cloned from the cucumber mosaic virus (CMV)-P0 pathogen and subcloned into a pCAMBIA 2300 vector. (KanR: Kanamycin resistant gene; 2X35S and 35S: Promoter; Tnos: Nos terminator; CMVP0-CP: Cucumber mosaic virus resistant coat protein gene; pCFNY: The binary vector pCAMBIA2300; LB and RB: The left and right borders)
Expression and purification of rCMV-CP from E. coli
The expression plasmid was constructed using the pET-22(+) vector to express recombinant CMV-CP (rCMV-CP) in bacteria (Sørensen et al., 2005). CMV-CP was positioned downstream of the bacteriophage T7 promoter in a medium copy number plasmid. Polymerase chain reaction (PCR) was performed using CMV-CP-pCAMBIA-2300 .
For expression, E. coli BL21 strain was grown overnight at 37ºC on lysogeny broth (LB medium) containing 0.1% ampicillin, and was then used as a seed culture to inoculate fresh cultures. When the optical density reached 0.5 at 600 nm, the cells were induced with isopropyl β-D-1-thiogalactopyranoside (IPTG; 1 mM final concentration) and cultivated for 4 h at 25ºC at 200 rotations per minute (rpm). Induced E. coli culture was centrifuged at 8000 rpm for 20 min at 4ºC, and the precipitate was suspended in imidazole (20 mM) with 0.1% protease inhibitor cocktail (Sigma?Aldrich, St. Louis, MO, USA). A French pressure cell press (SLM Aminco, Waltham, MA, USA) was used for cell lysis. Cell debris was separated by centrifugation at 10 000 rpm for 30 min at 4ºC. The resultant protein was purified using a nickel-nitrilotriacetic acid (Ni-NTA) column (Qiagen, Valencia, CA,USA) pre-equilibrated with lysis buffer (50 mM NaH2PO4, 10 mM imidazole, 300 mM NaCl, 0.05% Tween 20, pH 8.0). After loading 10 mL of cell-free extract, the column was washed once (5 mL matrix volume) with five bed volumes of washing buffer (50 mM NaH2PO4, 20 mM imidazole, 300 mM NaCl, 0.05% Tween 20, pH 8.0). Elution buffer (50 mM NaH2PO4, 250 mM imidazole, 300 mM NaCl, 0.05% Tween 20, pH 8.0) was used to elute bound proteins from the column.
Preparation of the immunoaffinity column for CMV-CP purification
In previous studies, Choi et al. (2015) developed antibodies that were designed from the peptide sequence of CMV-CP. Using peptide polyclonal antibodies, an immunoaffinity column was produced to purify CMV-CP. Ten milligrams of peptide polyclonal antibody was coupled to the AminoLink Plus column according to the manufacturer’s instructions (Thermo Scientific, Rockford, IL, USA).
Expression and purification of CMV-CP in GM peppers
GM pepper fruit (100 g) was ground in 200 mL chilled phosphate-buffered saline (PB; 0.1 M phosphate, 0.15 M sodium chloride, pH 7.2, 1 mM phenylmethylsulfonyl fluoride (PMSF), 1 mM ethylenediaminetetraacetic acid (EDTA), 0.1% protease inhibitor) and the slurry was centrifuged at 10 000 rpm for 20 min. Protein pellets were precipitated by adding 70% saturated ammonium sulfate solution and dissolved in a minimal volume of PBS. The suspended solution was centrifuged at 10 000 rpm for 20 min, and the supernatant was concentrated using a Centriprep (Millipore, Bedford, MA, USA). To remove salts, the concentrated protein was dialyzed overnight; all procedures were proceeded carried out at 4ºC.
The affinity column was equilibrated at room temperature. Six milliliters of PBS and 2 mL of dialyzed protein sample were poured into the column, which was then rocked for 60 min at room temperature. Subsequently, 2 mL of wash buffer was passed through the column four times, and 2 mL of elution buffer (0.1 M Glycine?HCl, pH 2.5) was passed through the column three times. All fractions were collected and used as protein samples directly for sodium dodecyl sulfate polyacrylamide gel electrophoresis (SDS-PAGE) and immunoblot analysis.
Determination of protein concentration
Protein was quantified using the Coomassie protein assay (Thermo Scientific, Rockford, IL, USA) with bovine serum albumin (BSA) as the protein standard. BSA concentrations were 0.2, 0.4, 0.6, 0.8 mg·mL-1. Protein (10 μL) was mixed with 90 μL of Bradford reagent, and the mixture was measured at 595 nm using a microplate reader (Molecular Devices, Uppsala/Stockholm, Sweden).
SDS-PAGE and immunoblot analysis
Protein samples were heated for 5 min in 5× loading buffer (1 M Tris?HCl at pH 6.8, 50% glycerol, 10% SDS, 0.5% 2-mercaptoethanol, 1% bromophenol blue) and separated using a 12% acrylamide gel with a molecular weight standard marker (Bio-Rad, CA, USA). Proteins were visualized using Coomassie brilliant blue R250. Protein blots were transferred onto polyvinylidene fluoride (PVDF) membranes (Merck Millipore) at 100 V for 2 h. After blocking the PVDF membrane with 5% skim milk/Tris-buffered saline (TBS) for 2 h, it was then incubated with peptide polyclonal antibody for 2 h at room temperature. The anti-immunoglobulin G (IgG) alkaline phosphatase conjugate (Sigma?Aldrich, St. Louis, MO, USA) was used as a secondaryantibody. Nitroblue tetrazolium (Promega, Madison, WI, USA) was used to stain the membrane and 5-bromo-4-chloro-3-indoyl phosphate (Promega) was used as a substrate in alkaline phosphatase buffer (100 mM Tris?HCl, pH 9.5). The reaction was stopped when a desirable color density was achieved.
Matrix-assisted laser desorption/ionization?time of flight (MALDI-TOF) analysis
Following SDS-PAGE, the protein was separated and the gel was stained with Coomassie blue. Protein spots in the gel of interest were analyzed at the E-mass Institute Protein Mass Spectrometry Facility. Briefly, sequencing-grade modified trypsin was used to excise the protein of interest for in-gel trypsin digestion and the proteins were alkylated with iodoacetamide (Sigma?Aldrich) as part of the digestion protocol. The digestion was performed overnight at 37ºC. The peptide solution was desalted using ZipTip C18 (Pierce). The solution was re-suspended in 2 μL of liquid chromatography (LC) water (0.2% trifluoroacetic acid (TFA)) and loaded onto the MALDI-TOF plate (Agilent).
The resulting database file was loaded to the databases of a locally installed (University of Liverpool, UK) Mascot search engine (Matrix Science; http://www.maxtrixscience.com). The identified CMV-CP sequences were submitted to the National Center for Biotechnology Information (NCBI) nr protein database using Protein BLAST (http://www.ncbi.nlm.nih.gov/blast) (Millares et al., 2012; Zolla et al., 2008).
Edman sequencing of CMV-CP expressed in GM pepper and E. coli BL21
Purified protein was separated using SDS-PAGE, and transferred to PVDF membranes at 100 V for 2 h. The membrane was stained using Coomassie blue for 2 min and destained with 50% methanol. N-terminal sequencing analysis used phenylisothiocyanate (PTH; Edman’s reagent). This solution, in conjunction with the N-terminal peptide of PTH, formed phenylthiohydantoin. The peptide bond was broken because the structure was unstable. Amino acids were then detected by mass spectrometry.
Glycosylation analysis
A Glycoprotein Detection Kit (Sigma-Aldrich) was applied to the gel containing separated proteins and treated with the oxidation reagent according to the manufacturer’s instructions. This treatment induced the oxidization of cis-diol sugar groups in the glycoproteins. The resulting aldehyde groups reacted with the Sigma Stain Reagent to form Schiff-base bonds that developed magenta bands. This detection system was a modification of the periodate-acid-Schiff (PAS) reagent method.
Quantification of inserted proteins in plant tissues using ELISA
Production of standard protein
rCMV-CP purified from E. coli BL21 was used as the standard substrate for ELISA analysis. The standard protein was loaded on to the same plate with protein concentrations of 0.5, 5, 15, 25, and 50 ng·mL-1. PBS was used as the dilution buffer (4.3 mM Na2HPO4, 137 mM NaCl, 2.7 mM KCl, 1.4 mM KH2PO4).
Limit of detection (LOD) and limit of quantification (LOQ)
The ELISA limit of detection (LOD) and limit of quantification (LOQ) were determined according to the ICH Harmonized Tripartite Guideline (1994). Absorbances of the three most dilute standards were measured using ELISA, and a calibration curvewas calculated. The middle concentration (5 ng·mL-1) was detected seven times, and the standard deviation was calculated. The ICH Harmonized Tripartite Guideline provided the formula to calculate LOD and LOQ values as follows:
LOD = 3.3 x σ/S;
LOQ = 10 x σ/S (σ: standard deviation, S: slope of calibration curve.)
Sources of plants for evaluation of expression
To confirm the variation of CMV-CP expression in GM pepper, all portions of the GM pepper were analyzed. Cultivation areas were Chun-Ang University (Anseong, Korea), Korea University (Namyangju, Korea), and KRIBB (Cheongju, Korea). Peppers of the same cultivar were planted in three cultivation areas. Sampling times were at the whorl (root, stem, and leaf) and maturation stage (root, stem, leaf, fruit, and pollen). Samples were weigehd and stored at ?70°C until required for extraction and analyiss.
Plant tissue processing
Each sample was mixed with PBS (0.1 M Phosphate, 0.15 M sodium chloride, pH 7.2, 1 mM PMSF, 1 mM EDTA, 0.1% protease inhibitor), and centrifuged at 10 000 rpm for 20 minT. he supernatant was then filtered usingW hatman filter paper No. 4 and subjected to ELISA analysis. The percentage dry-weight of each sample was determined by recording the weight of the sample before and after drying.
Indirect ELISA
Optimum conditions for the detection of CMV-CP are shown in Table 1. A 96-well microplate (Nunc, Roskilde, Denmark) was coated with 200 μL of the extracts per well. The plate was incubated overnight at 4ºC. Next, the plate was washed and 3% BSA dissolved in PBS supplemented with Tween 20 (PBST) was added to block the uncoated surfaces in the well. Plates were incubated for 2 h at 37ºC. As the primary antibody, polyclonal antibody was diluted in 1% BSA in PBST and incubated with the samples for 3 h at 37ºC. After washing, goat anti-rabbit IgG alkaline phosphatase conjugate (Sigma?Aldrich) was diluted with 1% BSA in PBST, and added to all wells. Plates were incubated at 37ºC for 2 . hAfter unbound antibody was removed by washing, color wa s developed using 4-nitrophenyl phosphate (Sigma?Aldrich, 1 mg/ml) as a substrate in PBS. The substrate changed color by reacting with the enzyme. The color change was measured at 405 nm using a microplate reader (Molecular Devices), and the optical density of the sample was compared to the standard curve for quantificaiotn (Choi, 2011).
Table 1. Optimal ELISA conditions.
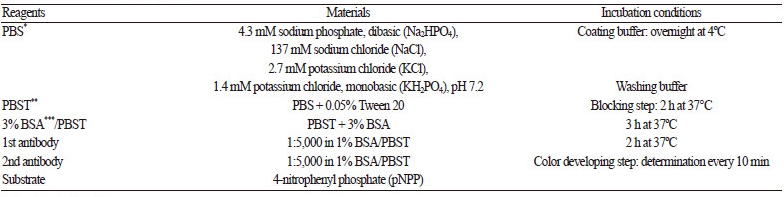 | |
| * Phosphate buffer saline ** Phosphate buffer saline tween-20 *** Bovine serum albumin | |
Calculation and explanation of ELISA data
All ELISA data were analyzed using Microplate Analysis Software. The mean absorbance per sample was read and plotted against the standard curve to give a value for the concentration of the protein of interest (POI) per mL of extract, without accounting for the dilution factor. The POI concentration (μg·mL-1) in plant tissue was calculated as follows:
ng POI·mL-1= diluted ng POI·mL-1 × dilution factor;
μg POI·g-1 FW= ng POI·mL-1 × extraction buffer / amount extracted (g) / 1000;
μg POI·g-1 DW = μg POI·g-1 FW / % dry weight.
Statistical methods to compare the CMV-CP levels
SPSS software version 21 (IBM Corp., USA) was used for statistical analyses to compare group means. The statistical significance was determined using the Duncan model.
Results and Discussion
Expression of rCMV-CP in E. coli BL21
E. coli BL21 was incubated on an LB plate containing 0.1% ampicillin, and ampicillin resistant colonies were selected. After harvesting the cells, protein was extracted using a French pressure cell press. Extracted proteins were purified using a Ni-NTA chromatography column. The His-tagged CMV-CP was eluted with elution buffer containing a high concentration of imidazole. In all steps, the fractions were loaded onto an acrylamide gel and an immunoblot assay was performed. The purified CMV-CP produced a single band by SDS-PAGE, and this was further confirmed by immunoblotting using a peptide polyclonal antibody. As shown in Fig. 2, the presence of CMV-CP was confirmed as a single band at 25 kDa through SDS-PAGE and immunoblot analysis.
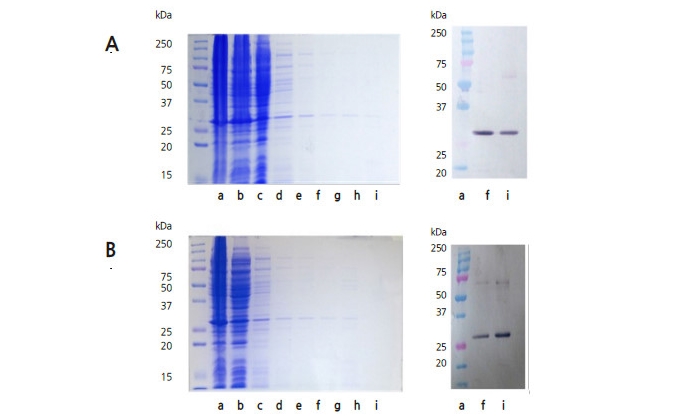
Fig. 2
Sodium dodecyl sulfate polyacrylamide gel electrophoresis (SDS-PAGE) (left) and immunoblot (right) of purified expressed cucumber mosaic virus coat protein (CMV-CP) from (A) genetically modified pepper and (B) Escherichia coli BL21, purified with a nickel-nitrilotriacetic acid (Ni-NTA) affinity chromatography column. a: size marker, b: fraction extracted before passing through the column, c–e: washing fractions 1–3, f–i: elution fractions 1–4.
According to Pina et al. (2014), the hexapeptide 6 × His was genetically fused to the N-terminus of proteins produced in E. coli and purified by immobilized metal affinity chromatography (IMAC) using a Ni-NTA column. Subsequently, protein elution was attempted using a pH gradient in the presence of denaturing agents. Janknecht et al. (1991) reported that SRFHis6- tagged protein was found in a broad range of imidazole concentrations. Normally, elution of SRT-His6-tagged protein with 0.8?40 mM imidazole leads to high contamination. Thus, elution with 80 mM imidazole was used for the majority of tagged proteins.
Expression of CMV-CP in GM peppers
Extraction of GM pepper proteins was investigated after precipitating soluble protein in 70% ammonium sulfate. Extracts were purified using an immunoaffinity chromatography column. During purification, all fractions were analyzed using SDS-PAGE; a single band was present in eluted fractions. The single protein band was confirmed by immunoblot analysis. This band exhibited the same molecular weight (approximately 25 kDa) of CMV-CP in E. coli according to SDS-PAGE and immunoblotting (Fig. 2). Choi et al. (2015) observed that, in immunoblot analysis, the expression of CMV-CP in GM peppers appeared as a major band at 26 kDa. Also in immunoblot analysis, Zein et al. (2009) used specific monoclonal antibodies (mAbs) for Pepo- and M2-CMV to detect CMV-CP in infected tobacco plants, and revealed the presence of 26and 52 kDa viral proteins. The 26 kDa protein band closely matches the molecular weight of CMV-CP, whereas the other band could be a dimer of the 26 kDa protein.
Identification of CMV-CP expressed in E.coli BL21 and GM peppers
MALDI-TOF analysis
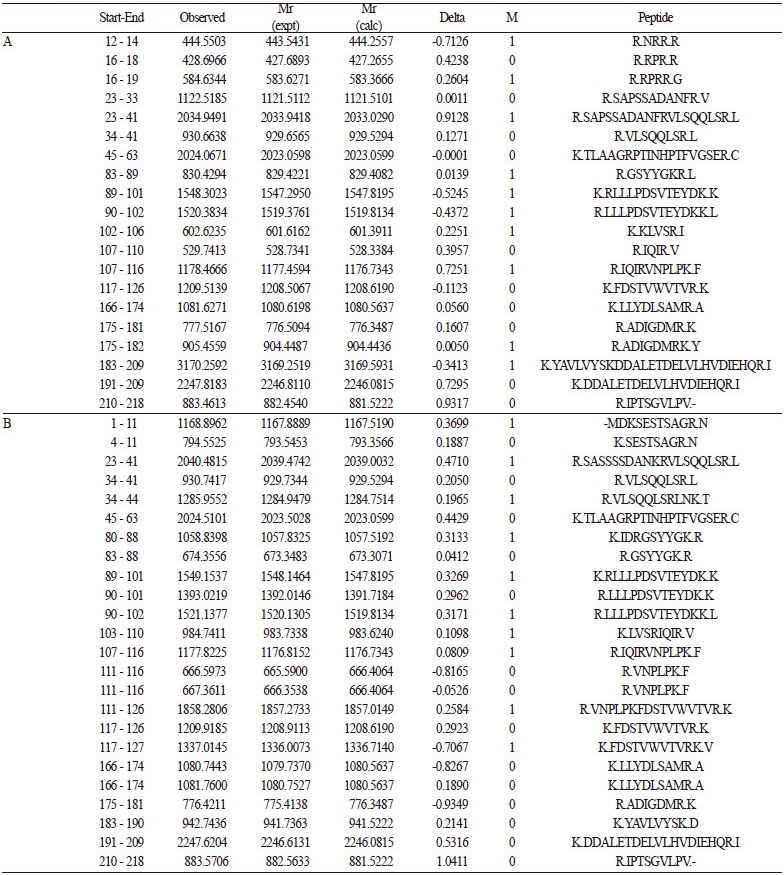
After hydrolysis with trypsin, the internal peptide fragments of CMV-CP from E. coli BL21 and GM pepper were sequenced by MALDI-TOF (Fig. 3). A mass chromatogram is presented in Table 2. For CMV-CP expressed in E. coli BL21, the intensity coverage was 98.8%. The peptide sequence list is shown in Fig. 4. Of these sequences, 65.1% were found to have significant identity to CMV-CP. For CMV-CP expressed in GM pepper, the intensity coverage was 52.7%. Of these sequences, 69% were found to have significant identity to CMV-CP.
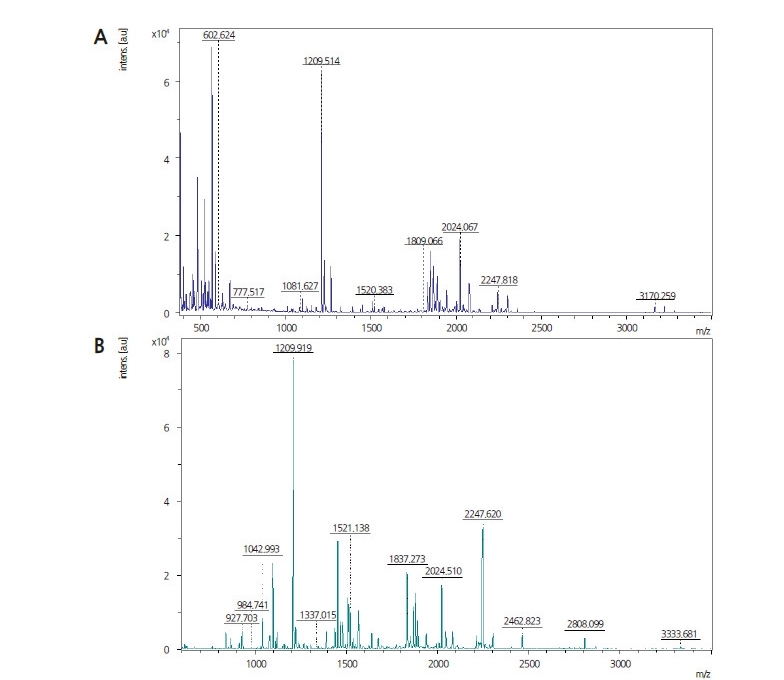
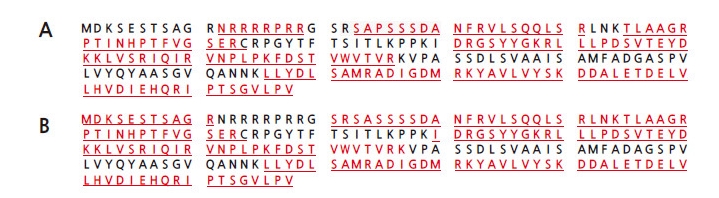
Table 2. Tryptic digested peptides of cucumber mosaic virus coat protein (CMV-CP) from (A) Escherichia coli BL21 and (B) genetically modified
pepper.
 |
Using MALDI-TOF, Corpillo et al. (2004) reported differences in protein expression between wild-type and transgenic tomatoes. ATP synthase, RuBisCO, and oxygen-evolving enhancer protein were respectively found to comprise 24.5, 43.2, and 63.6% of sequence coverage. Food Standards (2008) reported that the Vip3Aa20 proteins isolated from MIR162 and recombinant E. coli were digested with trypsin. Mass spectrometry analysis was then performed using a quadrupole timeof- flight mass spectrometer. To identify a protein using this method, it was essential to match a sufficient number of observed tryptic mass fragments to expected mass fragments. Generally, if the measured coverage of the sequence is 15% or higher with a minimum of five matching peptides, it is considered to be reliable for protein identification (Lim et al., 2003;Jensen et al., 1997). The tryptic mass fragments identified from plant and bacterially derived Vip3Aa20 matched the expected tryptic peptides generated in silico, with coverage of 40% and 45%, respectively.
In this study, we obtained more than 40% sequence coverage; therefore, we could confirm the proteins identified in both E. coli and GM pepper (Fig. 4).
Edman sequencing of CMV-CP expressed in GM pepper and E. coli BL21
After modification to a more stable phenylthiohydantoin (PTH) derivative, the derivatized amino acid was subjected to chromatography. The PTH amino acid was identified by its unique intensity in the chromatogram. This process was repeated iteratively for each subsequent terminal amino acid of the protein (Thoma et al., 2009). In a study by Food Standards Australia New Zealand (2008), technical difficulties meant that the N-terminal sequence of plant-derived proteinscould not be determined. However, we were able to successfully sequence the N-terminal of CMV-CP from E. coli BL21 and GM pepper, and the results showed that two N-terminal sequences were the same. Smith et al. (2000) reported theN-terminal region of CMV from strain Fny as having a sequence alignment of M-D-K-S-E-S-T-S-A-G, which is identical to that of CMV-CP from E. coli BL21 in our study. Similar results were also reported by Maneechoat et al. (2015), where the N-terminal sequence of CMV strain Z1 segment RNA-3 from South Korea was M-D-K-S-E-S-T-S-A-G.
Glycosylation analysis
According to Albert (2003), deglycosylation of glycoproteins with trifluoromethanesulphonic acid (TFMS) is a powerful technique that can be used to determine the size of the peptide portion of a glycoprotein, and to reduce all glycosylation variants to a single parent molecule. However, a previous study using TFMS (Jung, 2011) did not provide an accurate basis for glycosylation. In SDS-PAGE, the bands of purified CMV-CP and TFMS-treated CMV-CP were not clear. The periodic/ Schiff (PAS) method, another glycosylation detection method, was specific for glycoproteins separated by SDS-PAGE (Devine et al., 1990; Egito et al., 2001). The detection limit for carbohydrates was found to be in the range of 25?100 ng depending on the nature and degree of protein glycosylation. Hu et al. (1996) detected the glycosylation of YKL-40, a novel human chondrocyte protein, using the PAS-based Sigma glycoprotein detection kit. Here, staining of the gel for carbohydrates showed that YKL-40-related proteins are not glycoproteins.
The glycosylation of CMV-CP expressed in GM pepper and E. coli was detected using the glycosylation detection kit (Sigma?Aldrich, St. Louis, MO, USA), and the band was detected by SDS-PAGE (Fig. 5). Consequently, CMV-CP was not considered to be glycosylated.
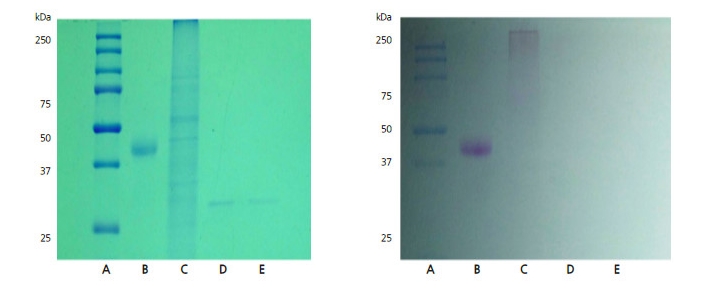
Fig. 5
Confirmation of glycosylation. Left: sodium dodecyl sulfate polyacrylamide gel electrophoresis (SDS-PAGE) stained with Coomasie blue. Right: glycosylation detection after SDS-PAGE. A: molecular weight marker, B: positive control (peroxidase), C: crude extract of GM protein, D: cucumber mosaic virus coat protein (CMV-CP) standard (genetically modified), E: CMV-CP standard (Escherichia coli BL21).
Quantification of CMV-CP in GM peppers
ELISA was used to quantitatively analyze CMV-CP in plant material. CMV-CP in the protein extract of GM peppers was used as the antigen, and protein extract from non-GM peppers was applied as the control antigen. A standard curve was created using serial dilutions of CMV-CP from E. coli BL21.
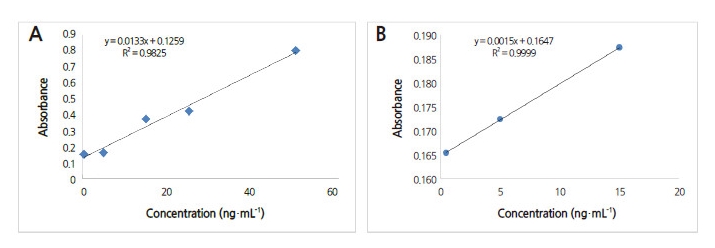
A calibration curve was obtained (Fig. 6), and the absorbance range was measured from 0.1 to 0.8. Then, LOD and LOQ values were calculated using the proposed ICH Harmonized Tripartite Guideline (Fig. 6). LOD and LOQ were determined as 0.022 and 0.0068 μg·mL-1, respectively. Zein and Miyatake (2009) applied triple antibody sandwich (TAS)-ELISA to detect CMV in infected tobacco leaves using MAbs, and detected a concentration of 10 pg per well (10 ng·mL-1) for purified Pepo-CMV, and 1 ng per well (1 μg·mL-1) for M2-CMV.
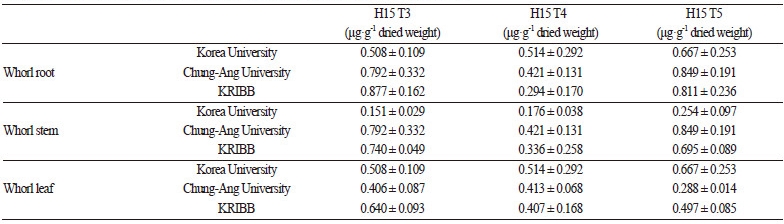
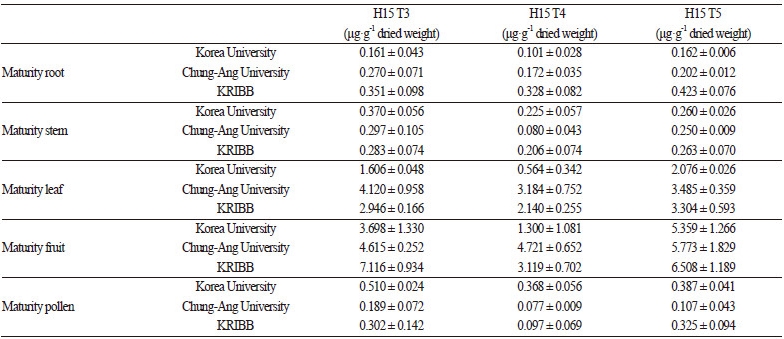
Results for protein amount by cultivation area, harvest time, and tissue type are shown in Table 3 and Table 4. The highestamount of CMV-CP was detected at the seedling stage from plant grown in each region. T3 and T5 showed significantly different levels of CMV-CP from T4 in leaves in the whorl stage. Moreover, the levels of CMV-CP in GM peppers cultivated at Korea University and KRIBB were different in the stem of the whorl, but were not significantly different in other tissue types. No statistical differences were observed among GM peppers at different stages of maturity in any cultivation area. However, the root, fruit, and pollen had significantly different protein concentrations among generations in the maturity stage. Variation in expression was inconsistent according to place, generation, or crop site. Therefore, the variation in expression levels of CMV-CP was determined by the different among the growths of the plantation.
Using ELISA, Roggero and Pennazio (1984) reported the concentrations of tobacco necrosis virus from necrotic lesions in tobacco leaves, and found less than 10% variation among different plates. According to Sun et al. (2001), detection of CMV using electrochemical ELISA with a detection limit of 0.5 ng·mL-1, was ten times more sensitive than the colorimetric ELISA method. FSANZ (2008) analyzed novel protein levels in the corn line MIR162 using ELISA. Protein was extractedfrom samples of leaves, whole plant, kernels, roots, silk, pollen, and silage, from plants cultivated in two fields (Illinois and Nebraska). The plants from each control genotype were sampled at each of four growth stages. Here, it was reported that the average Phosphomannose-isomerase (PMI) level in mature MIR162 corn kernels was 1.93 μg·g-1 dry weight (DW). The amounts of PMI in leaves, roots, and pith were 5.77, 1.99, and 2.75 μg·g-1 DW, respectively.
This study identified CMV-CP extracted from E. coli and GM peppers for food safety assessment for the commercialization of CMV-resistant GM peppers. CMV-CP was purified from E. coli and GM peppers, and its purity was tested by SDSPAGE and immunoblotting. N-terminal sequences of purified CMV-CP expressed in E. coli and GM pepper were analyzed and compared using MALDI-TOF and electrospray ionization tandem mass spectrometry (ESI-MS/MS). Both proteins expressed the same amino acid sequences and the same biochemical characteristics.
An affinity column bound with CMV-CP polyclonal antibody induced by peptide-antigen was prepared, and ELISA conditions were optimized determine CMV-CP content in GM-peppers. The contents of CMV-CP were measured in root, leaves, stem, fruit, and pollen of GM peppers cultivated in three different fields (Korea University, Chung-Ang University,and KRIBB). The highest expression of CMV-CP was 0.849 μg·g-1 in leaves from GM peppers. The cultivation areas, harvest time, generation, and plant tissues did not affect the expression of CMV-CP and there were no statistically significant differences among all tested parameters.
CMV-CP expressed in GM pepper showed same biochemical characteristics compared with the expressed coat protein in E. coli. These results showed that CMV-CP gene was expressed successfully in GM Pepper with the highest expression level. The cultivation areas, harvest time, generation, and plant tissues did not affect the expression of CMV-CP, because there were no statistically significant differences among all tested parameters. This may justify the potential application of new GM pepper with CMV-CP gene in food industry
