

Introduction
Materials and Methods
Study Site
Plant and Growth Environment
Experimental Design and SCB Treatment
Red Pepper Varieties
SCB Analysis
Soil Analysis
Plant Analysis
Calculation of Nutrient use Efficiency
Red Pepper Quality Analysis
Data Analysis
Result and Discussion
Chemical Properties of SCB
Fruit Qualities and Yield
Red Pepper Yield
Plant N Uptake and NUE
Sugar and Capsaicinoids of Red Pepper
Effects of Continuous SCB Treatments on Chemical Properties of Soil
Sugar and Capsaicinoids of Red Pepper
Sugar and Capsaicinoids of Red Pepper
Introduction
Livestock manure can provide essential nutrients for crop production. Swine manure recycling in South Korea has been increasingly emphasized because of the 2012 environmental regulations that prohibited dumping livestock manure into the ocean. Furthermore, the legislation requires a 40% reduction in current total chemical fertilizer use (Kim et al., 2008b; Kang et al., 2011). Increased swine production, coupled with more stringent environmental regulations, has created the need for improved swine manure nutrient management, especially N and P. Therefore, creating a liquid fertilizer by slurry composting bio-filtration (SCB) has been proposed to address these environmental issues.
SCB is a relatively new product developed from liquid swine fertilizers. SCB can be easier to manage than liquid swine manure because it contains less than 1 g·L-1 N and 0.3 g·L-1 P (Rural Development Administration, 2007). In contrast, liquid manure from finishing hogs has from 0.1 to 6.6 g·L-1 P (Barbazán et al., 2009) and from 31 to 408 g·L-1 N or 16 to 45 g·L-1 P (Pagliari and Laboski, 2012). The estimated mineralization of total N available in the first year for swine manure is 90% (Moore et al., 1998 and Eghball et al., 2002). Therefore, the availability of total N in the first year for SCB is more than 90% because SCB is bio-filtered liquid.
Unlike swine manure, SCB is a relatively clear, dark brown liquid with almost no odor. This is the result of fermentation and filtering processes by microorganisms, as the liquid swine manure passes through composted rice (Avena oryzia L.) hulls in a lower floor (120 cm) and sawdust in an upper floor (30 cm) (RDA, 2007). Currently, there is sparse information on the effect of SCB on crop production, so providing information to assist growers with determining optimum SCB application rates is important to ensure this resource is used efficiently, while protecting the environment.
Red pepper, like corn, requires relatively high amounts of N fertilizer. Although there are many N management guidelines available, the effects of long-term SCB application on red pepper growth, yield, quality, and soil responses are unknown. For example, the content of capsaicinoids in red red pepper significantly varied at different times of harvest (Bhandari et al., 2016). Thus, we evaluated the long-term application effects of SCB liquid fertilizer on growth, yield, and nutrient use efficiency of red pepper and soil response.
Materials and Methods
Study Site
This research was conducted at Suwon, in northwestern South Korea, from 2007 to 2011. The longitude and latitude are 127° 01' east and 37° 16' north, respectively, and the dominant soil series is a Hwa dong tong, fine, mixed, mesic family of aquic Hapludalfs. The surface horizon contained approximately 680 g sand, 210 g silt, and 110 g clay per kg (Gee and Bauder, 1986), thus creating a sandy loam texture. The same plots were used each year.
Plant and Growth Environment
Chemical properties for soil pH, organic matter content, nitrate-N, ammonium-N, available phosphorus, and exchangeable K in 2007 were 7.5, 14 g·kg-1, 8.3 mg·kg-1, 11.0 mg·kg-1, 445 mg·kg-1, and 0.45 cmolc·kg-1, respectively. Climate data, such as rainfall and temperature, were collected between 2007 and 2011 from the Suwon Regional Meteorological Office (Korea Meteorological Administration), which is 3 km from the study site. Monthly average precipitation and temperature are presented in Table 1 (KOSIS, 2014). Compared to the 30-year average (average annual precipitation of 131.4 cm and average seasonal precipitation of 109.3 cm), annual and seasonal precipitation during the five-year study was 17 and 21% higher, respectively, in 2011. In 2007, 2008, 2009, 2010, and 2011, precipitation was 132.5, 134.3, 154.1, 147.1, and 197.6 cm, respectively, of which 107.9, 119.3, 129.6, 123.1, and 179.4 cm occurred during the growing season (Table 1) (KOSIS, 2014).

Experimental Design and SCB Treatment
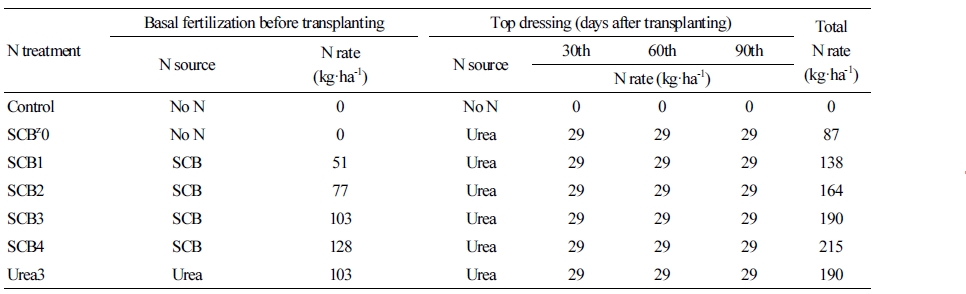
The experiment was conducted using a randomized complete block design with three replications. Plot dimensions were 2.25 m by 5 m. Plant density was 30 plants per 11.25 m2. Plants were grown in rows spaced 75 cm apart, with 50 cm between plants. The recommended N application rate for red pepper production in this region was 190 kg N/ha (103 kg N/ha for basal fertilization and 87 kg N/ha for top dressing) (RDA, 2007). We tested seven N treatments: control (No N), five SCB N rates, and one urea rate. For basal application, five SCB N treatments were applied via drip irrigation after transplanting: 0 kg N/ha (SCB0), 51 kg N/ha (SCB1), 77 kg N/ha (SCB2), 103 kg N/ha (SCB3), and 128 kg N/ha (SCB4). Urea (Urea3) was applied at a rate of 103 kg N/ha, which is similar to SCB3. 29 kg of urea each was applied as a top dressing at the 30th, 60th, and 90th day after transplanting. Detailed information for the N fertilization is summarized in Table 2. Recommended P and K application rates for red pepper production in this region were 49 kg·ha-1 and 124 kg·ha-1, respectively (Rural Development Administration, 2007). The lowest and highest amounts of P from SCB were 4 and 15 kg P/ha, respectively. The differences between recommended and SCB-applied P and K rates were compensated for using superphosphate (0-20-0) and muriate of potash (0-0-60). P was treated before planting and 60% of the recommended K rate was applied before transplanting and the remaining K was top dressed on the 60th day after transplanting. SCB treatments were incorporated into the soil within two days after basal N was applied and the soil was covered with plastic film approximately five days before transplanting.
Table 2. Amount of N applied as basal fertilization before transplanting and top dressing after transplanting
 |
zSCB: slurry composting bio-filtration. |
Red Pepper Varieties
The two red pepper varieties used in this study were ‘Guemtap’ in 2007 and 2008 and ‘Manita’ in 2009, 2010, and 2011. Briefly, seeds were planted annually in March and grown in a greenhouse for at least 6-8 weeks prior to transplanting to the field, where they were grown for 163 to 165 d. The peppers were grown on the same plots each year.
SCB Analysis
SCB was obtained from the predominant swine production facility producing this material in South Korea. Total N in SCB was determined using the Walkley-Black method (Walkley and Black, 1934) and inorganic N (NO3--N and NH4+-N) was determined using a Kjeldahl method (Mulvaney, 2005). K, Fe, Cu, Zn, Mn, and Na were quantified with an inductively coupled plasma spectroscope (ICP-OES MX2, GBC, Australia) (Suarez, 1996).
Soil Analysis
Baseline soil samples (0-30 cm) were collected in spring of 2007 from each block. In the fall of 2011, soil samples were collected from each plot. Each soil sample was composite of 10 individual cores. Soil samples were air-dried (35°C) and passed through 2 mm sieve. The samples were analyzed for soil pH, using a 1:5 soil water solution. Soil organic matter was determined using the Walkley-Black method (Walkley and Black, 1934) and inorganic N (NO3--N and NH4+-N) was determined using a Kjeldahl method (Mulvaney, 2005). The extraction used 2M KCl (Mulvaney, 1996). Exchangeable K, Ca, Mg, and Na were displaced using 1 M ammonium acetate solution (Warncke and Brown, 1998) and quantified with an inductively coupled plasma spectroscope (ICP-OES MX2, GBC, Australia) (Suarez, 1996). Plant available Cu, Fe, Mn, and Zn concentrations were determined by extracting with DTPA-TEA and analyzing the filtrate with the same ICP-OES instrument (Lindsay and Norvell, 1978; Reed and Martens, 1996). Soil P was determined using the Lancaster method (Alban et al., 1964).
Plant Analysis
Fresh red pepper fruit were harvested and air-dried every other week (5 or 6 times) from August to October. Nine red pepper plants were collected from each treatment for total biomass measurements. They were fractionated into leaves, stems, and roots, then dried at 70°C and ground. Plant samples were wet digested and analyzed for total N by the Kjeldahl method (Nelson and Sommers, 1996), P by using the Vanadate method (Gericke and Kurmies, 1952), and K using ICP-OES.
Calculation of Nutrient use Efficiency
Total plant N uptake was determined by summing the N contents times fruit, stem, leaf, and root weights, respectively. Total N use efficiency (NUE) was calculated using equation (1).
NUE = [(Total plant N uptakeNrate – Total plant N uptakecontrol) / Nrate] × 100 (1)
where total plant N uptakeNrate is the total plant N uptake of fruit, stem, leaf, and root from fertilized treatments, total N uptakecontrol is the total N uptake of fruit, stem, leaf, and root from unfertilized plots, and Nrate was the amount of applied N (Kim et al., 2008a). Fruit N use efficiency (FNUE) was calculated using equation (2).
FNUE = [(Fruit N uptakeNrate – Fruit N uptakecontrol) / Nrate] × 100 (2)
where fruit N uptakeNrate is the fruit N uptake in fruit from fertilized treatments, total N uptakecontrol is the fruit N uptake in fruit from unfertilized plots, and Nrate was the amount of applied N (Kim et al., 2008a). A harvest index (HI) was calculated using equation (3).
Harvest index (HI) = fresh fruit (kg) / fresh biomass (kg) (3)
Red Pepper Quality Analysis
Unseeded fruit from the third harvest were freeze-dried and prepared for soluble sugar content and capsaicinoid analyses. For soluble sugar content, 10 mL of 80% ethanol was added to 0.5 g of ground dry red pepper, then shaken and filtered with 0.45 µm membrane filter before purifying the solution with a sep-pak C18 cartridge. The extracted soluble sugar concentrations were determined using HPLC (Agilent Co., Triatholon M730D, YoungLin, Korea) (Lope-Hernandez et al., 1996). For capsaicinoid analysis, 10 mL of acetone was added to 1 g of ground dry red pepper, diluted with 50 mL of methanol, filtered through a 0.45 µm membrane, and analyzed for capsaicin and dihydrocapsaicin using HPLC (Agilent Co.). Total capsaicinoid concentrations were calculated using equation (4).
Total capsaicinoids = capsaicin concentration + dihydrocapsaicin …… (4)
Data Analysis
Statistical analysis was performed using SAS V9.2 software (SAS Institute Inc., Cary, NC, USA). The data were analyzed using analysis of variance (ANOVA) for a randomized complete block design. Treatment means were separated by the least significant difference (LSD) test at a 5 % probability level (p ≤ 0.05).
Results and Discussion
Chemical Properties of SCB
Chemical properties of SCB are summarized in Table 3. Average total N included 0.74 g·L-1 inorganic N and 67 mg·L-1 P, which are lower than liquid swine manure. Some studies reported that swine manure had a wide range of total N and total P: 31 to 408 g N/kg and from 16.3 to 44.9 g P/kg (Pagliari and Laboski, 2012), 3.8 to 8.2 g N/kg and from 0.9 g to 2.7 g P/kg (Woli et al., 2012), and liquid manure for finishing hogs ranged from 0.1 to 6.6 g total P/L (Barbazán et al., 2009). Sharpley and Moyer (2000) reported that the percentage of inorganic P in liquid swine manure can be 90% or more of the total P and the majority of P in swine manure was inorganic, which indicates high P availability (Sharpley and Moyer, 2000; Eghball et al., 2002). Fleming et al. (1998) reported that swine manure application based on P, instead of N, increased delivery costs. Although a mineralization study using SCB was not found in the literature, the mineralization rate from total N in the first year for swine manure was 90% (Moore et al., 1998; Eghball et al., 2002). Therefore, SCB mineralization should be higher or at least similar to 90%. Thus, the use of SCB can be as effective as N in chemical fertilizers. These results show that the concentrations of total N and total P in SCB were lowered through the SCB process and the use of SCB may be beneficial for swine manure management, because of low P concentration in SCB compared to liquid swine manure.
Table 3. Selected chemical characteristics of SCB liquid fertilizer, applied from 2007 to 2011
 |
zNA: not available. |
Average total K and Na in SCB over five years were 1,625 mg K/L and 495 mg Na/L, respectively, while Woli et al. (2012) reported that total K in liquid swine manure ranged from 2,947 mg·L-1 to 4,490 mg K/L and Na ranged from 172 to 439 mg Na/L (Sutton et al., 1984). Ajiboye et al. (2004) reported that Ca, Mg, and Fe concentrations in hog manure collected from an agitated storage lagoon were 25 g·kg-1, 13 g·kg-1, and 2.6 g·kg-1, respectively.
Red Pepper Yield
Average fresh red pepper fruit yields ranged from 13,600 to 18,900 kg FW/ha (Table 4). The highest yield was observed in 2009, while the lowest yield was measured in 2008 (Table 4). Red pepper fruit yields in 2008 and 2011 were lower than other years because of greater precipitation, which may have caused plant diseases that led to reduced yields. For example, there were 98 h of sunshine in July in 2008 and 95 h in 2011, compared to 108 h in 2007, 145 h in 2009, and 129 h in 2010. Rainfall was also a factor in disease incidences, such as Anthracnose. The amount of rainfall in July was 54.1 cm in 2008 and 79.4 cm in 2011, compared to 27 cm in 2007 and 20.7 cm in 2010 (Table 1).

Red pepper yield increased with increased SCB rate to 103 kg N/ha, as basal fertilization. The highest yields were observed for the SCB3 and SCB4 treatments, while the lowest yields were found for SCB0. Applying additional N beyond the SCB3 did not further enhance yields. Fresh fruit yields were 18,500 and 18,900 kg FW/hafor the SCB3 and SCB4 treatments, respectively. Daudén and Quílez (2004) studied corn yield and growth under several N combination sources, pig slurry plus chemical fertilizer over three years and reported that corn yield and growth were the same under pig slurry as with a basal N fertilizer and chemical fertilizer as a top dressing or with chemical fertilizer for both basal and top dressing. Kang et al. (2004) reported that red pepper yield was similar among pig slurry and chemical N fertilizer treatments. In this study, fresh fruit yield for Urea3 was similar SCB3 and SCB4. Yanar et al. (2011) suggested the highest tomato (Lycopersicon esculentum) yields obtained from composted poultry manure (2 ton/ha), composted cattle manure (70 ton/ha), and the control (450 kg N, 350 P2O5, and 600 K2O per ha) were 12,800, 12,300, and 11,500 kg/ha, respectively. They recommended applying composted cattle manure before planting and additional commercial organic fertilizers, as an alternative to the chemical fertilizers was applied every week from planting to last harvest. Also, Park et al. (2015) evaluated the effect of mixed liquid fertilizer (MLF) and chemical fertilizer on cherry tomato yield and reported that the number of fruits was the highest under MLF-1.0 treatment, while the dry weight of shoots and roots was the greatest under chemical fertilizer followed by MLF-1.0. These results suggest that SCB for basal fertilization can be used as one of the N fertilizer sources, replacing chemical N fertilizers. The recommended SCB rate for basal fertilization should be 103 kg N/ha (SCB3) or 128 kg N/ha (SCB4).
HI values were not influenced by N rate and year. The highest HI was measured in 2009, and the lowest HI was measured for the SCB0. Clay et al. (2006) reported that low HI values for corn were associated with high yield loss due to N (Table 4).
Plant N Uptake and NUE
Increased N rate increased the amount of nitrogen uptake (Table 5). For example, the highest total biomass N uptake and fruit N uptake were observed for SCB3, SCB4, and Urea3 treatments. Fruit N uptake in 2008 and 2011 was low because of low yield caused by plant disease and frequent rainfall. The actual utilization rate of nitrogen from SCB liquid fertilizer may not be directly compared among N treatments because SCB was applied as basal N and additional urea was used as a top dressing. Plant N uptake from the control was only from soil N and N from SCB0 was from soil N plus top dressing with urea. That can partially explain N uptake by crops. Biomass and fruit N uptake under the control were 75 and 48 kg N/ha, respectively, while biomass and fruit N uptake under SCB0 were 112 and 83 kg N/ha, respectively. The actual utilization rate of N from urea can be calculated by biomass and fruit N uptake for SCB0 minus biomass and fruit N uptake for control; and the actual utilization rate of N from SCB liquid fertilizer can be calculated by biomass and fruit N uptake for individual SCB rate minus biomass and fruit N uptake for SCB0. The actual utilization rate of N from SCB liquid fertilizer was 0, 17, 25, 35, 36, and 34 kg N/ha for SCB0, SCB1, SCB2, SCB3, SCB4, and Urea3, respectively. SCB NUE can be calculated by the actual utilization rate divided by SCB rate and SCB NUE was 33.3, 32.5, 34.0, 28.1, and 33.0% for SCB1, SCB2, SCB3, SCB4, and Urea3, respectively. Total biomass NUE decreased with increasing N rates, while FNUE increased with increasing N rates. The lowest FNUE was shown for SCB0 (Table 5), while the highest NUE was 43.7% for SCB0 and the highest FNUE was 30.7% for SCB4. FNUE ranged from 19.9% in 2008 to 33.3% in 2009. This is related with yield reduction due to plant disease and rainfall. For example, red pepper yield for SCB0 was 9600 kg FW/hain 2008 and 11,800 kg FW/hain 2011 (data are not shown). FNUE for SCB4 was 30.7%, compared to 30.0% for SCB3, and fresh fruit yields under SCB3 and SCB4 were similar. These results suggest that the efficiency of SCB is similar for SCB3 and SCB4.

Sugar and Capsaicinoids of Red Pepper
Sugar, including sucrose, glucose, and fructose, and capsaicinoid concentrations were not influenced by N rate and N fertilizer sources (Table 6). Average soluble sugar concentration ranged from 144 mg·g-1 dry weight (DW) for SCB2 to 157 mg·g-1 DW for SCB4. Capsaicinoid concentration in red pepper was similar under different SCB treatments. However, Medina-Lara et al. (2008) suggested that crop quality was influenced by N rate. For example, capsaicin content in Habanero pepper (Capsicum chinense Jacq.) ranged from 11 to 14 mg·g-1 DW under no N fertilizer, likely due to N stress, while it ranged from 4.0 to 4.2 mg·g-1 DW under 1 mM N treatment. Other researchers have reported similar crop quality, regardless of N source: vitamin and carotene content in cabbage (Brassica oleracea L.) and carrot (Daucus carota L.) were the same under chemical N fertilizer and composted manure treatments (Warman and Havard, 1997); and yield and vitamin C content of potatoes (Solanum tuberosum L. Superior) and vitamin C and E content of sweet corn (Zea mays L. var. saccharata ‘Sunnyvee’) were similar under chemical N fertilizer and compost treatments (Warman and Havard, 1998). Bhandari et al. (2016) reported that the content of capsaicinoids were significantly influenced by harvesting time. First harvest had the highest content of capsaicinoids compared to 3rd harvesting time.
The lowest free sugar content in red pepper was at first harvesting time and the highest free sugar content in it were found at 2nd harvesting time Bhandari et al. (2016). Kano et al. (2007) suggested that sugar content (glucose and fructose) in cabbage increased under N stress. Citak and Sonmez (2010) also reported that the highest vitamin C concentration of Matador type spinach (Spinacea oleracea L.) was found in the organic applications compared to the chemical N fertilizer. These results suggest that SCB rates are not limiting factors for soluble sugar and capsaicinoid concentrations in red pepper.

Effects of Continuous SCB Treatments on Chemical Properties of Soil
The effects of the long-term SCB treatments on the changes in soil chemical properties were tested and summarized in Table 7. Soil P was not influenced by increasing SCB rates, because the amount of P from SCB was low. Other studies showed that soil P increased with livestock manure application after long-term use (Kim et al., 1999; Kwak et al., 2003; Gagnon et al., 2012), and manure application increased total P and available P in the soil (Patidar and Mali, 2002). These results are attributed to low P content in SCB, resulting in less accumulation of P in soil and suggesting that the use of SCB can lower the accumulation of P in the soil, which reduces any negative environmental impact.

Soil pH, electrical conductivity (EC), and soil organic matter content did not show any changes for all treatments regardless of N fertilizer source. Continuous SCB use for our five-year experiment showed that the concentrations of K and Na in soil increased with SCB rate. The average K application rate over five years was 232 kg K/ha for SCB3 and 290 kg K/ha for SCB4, while the recommended K rate for red pepper is 124 kg K/ha. Thus, the K rates for SCB3 and SCB4 exceeded the recommended rate by 108 kg K/ha and 166 kg K/ha, respectively. Recommended exchangeable K is between 0.7 and 0.80 cmolc·kg-1 (National Academy of Agricultural Science, 2014). Therefore, the accumulation of K was acceptable during our study. Although the observed values of exchangeable K increased steadily during the study period, and there is a possibility to exceed the recommended value within a few years if SCB is continuously applied, increasing exchangeable K may not be a big concern due to high consumption of K by plants (Bartholomew and Janssen, 1929; Brady and Weil, 2010). However, continuous monitoring of soil K is necessary. Consequently, applications of chemical K fertilizer may need to be reduced.
Lim et al. (2009) studied Chinese cabbage (Brassica campestris L.) and reported that applying SCB as a basal fertilizer increased the concentration of Na in soil. Moral et al. (2008) suggested that the use of pig slurry accumulated 91 kg Na ha-1 annually. Although continuous SCB use increased soil Na concentration, the sodium adsorption ratio (SAR) indicates that the increase in Na may not be critical for growing crops (Table 7). Normal soil SAR is less than 13 (Miller and Donahue, 1990).
The concentrations of Fe, Mn, Zn, and Cu did not show any difference among treatments during the five-year study period. One of the reasons was because Cu, Zn, and Mn concentrations in SCB were low. The average concentration of Cu, Zn, and MN was 1.9, 11.2, and 2.0 mg·L-1, respectively. Interestingly, several previous studies on pig slurry application reported that Cu, Zn, and Mn concentrations were heightened gradually. For example, Cu and Zn concentration increased by 0.25 mg Cu/kgand 2 mg Zn/kg annually, with 50 m3·ha-1·yr-1 of pig slurry (Bourrelier and Berthelin, 1998), due to the high Cu and Zn concentrations in pig slurry (Bernal et al., 1993). Also, Lloveras et al. (2004) reported that Cu and Zn concentrations increased in soil with a two-year pig slurry application, which contained 567 mg Cu/kg and 1,200 mg Zn/kg in 50 m3·ha-1·yr-1. Moral et al. (2008) studied pig slurry application, they showed annual accumulations of 4 kg Cu/ha and 15 kg Zn/ha, with the total N of 210 kg N/haas pig slurry. However, continuous SCB use in this study did not elevate Cu, Zn, and Mn accumulation in soil. These results suggest that SCB might be a better N source than pig slurry because some of the micronutrients from pig slurry are absorbed and reduced via bio-filtration and fermentation. Consequently, the concentrations of Cu, Zn, and Mn are lower in SCB than in pig slurry, resulting in minimal soil Cu, Zn, and Mn accumulation during our study.
In conclusion, fresh fruit yield for Urea3 was similar to SCB3 and SCB4. Fruit soluble sugar and capsaicinoid concentrations were the same for all N treatments. The lowest FNUE was shown under SCB0 and the highest FNUE was under SCB4. Five years of SCB treatment had no effect on soil chemical properties. For example, soil pH, EC, and soil organic matter content did not show any changes for all N treatments, regardless of N fertilizer source, and soil P was not influenced by increasing SCB rates. Also, the concentrations of Fe, Mn, Zn, and Cu did not show any difference among treatments with continuous SCB application. Although the concentrations of soil K and Na increased with SCB rate, the concentration of K was still less than the recommended K level from the National Academy of Agricultural Science, and the SAR indicated that the increased Na may not adversely affect growing crops. Therefore, the accumulation of K and Na was not critical during the five-year study. These results suggest that SCB for basal fertilization can be used as one of the N fertilizer sources, replacing chemical N fertilizer sources. The recommended SCB rate for basal fertilization should be 103 kg N/ha (SCB3) or 128 kg N/ha (SCB4). Consequently, use of SCB liquid fertilizer could provide an alternative source of pre-transplant N fertilizer for red pepper production.
