

Introduction
Materials and Methods
Growing conditions
Plants and fish
Treatment
Water quality analysis
Measurement of plant growth parameters
Statistical analysis
Results and Discussion
EC and pH
Nutrients in water
Plant growth parameters
Conclusions
Introduction
Aquaponics is a technology, coupling aquaculture and hydroponics in one system, where plants are cultivated using nutrient-rich water from aquaculture (Baganz et al., 2022). It is more efficient than a conventional system considering its water and nutrient utilization capacity (Barbosa et al., 2015). However, its management is a big challenge (Badiola et al., 2012; Lee et al., 2022). Nowadays, aquaponic systems are also used for interior purposes to create naturalistic and aesthetic indoor spaces by providing both aquarium and planterior facilities and promoting healthy healing for visitors and settlers.
Water quality in an aquaponics system is crucial because it has limited elements. Furthermore, maintaining proper water quality is required to ensure a successful system by providing optimal conditions for plant growth and a healthy environment for fish. In spite of this, plants and fish required different water quality. Particularly, the strength of EC and pH of water are key factors of a potential aquaponic system. They greatly influence physiological and morphological activities of plants as well as their nutrient uptake (Wortman, 2015; Delaide et al., 2016; Kim et al., 2022). Moreover, adjustment of EC and pH is a necessary step in aquaponic systems to promote nitrification and ensure fish health (Tyson et al., 2007).
Geranium (Pelargonium zonale L.) belongs to the Geraniaceae family. It is a decorative flower. It is an herbaceous plant with branches that are almost succulent and usually covered with hairs. Its flowers are distinctly irregular and borne in an umbel-like inflorescence with color ranging from rose-pink to all shades of red as well as pure white. This plant is also used for medicinal purposes (Graca et al., 2020). Nowadays, the popularity of P. zonale is rising as a planterior plant because of its attractive flowering, growth habit, and minimal requirement of care. Considering these factors, it is also possible to introduce this plant in an aquaponic system for interior purposes.
Most of the essential nutrients for plant growth can be supplied from fish feed in an aquaponic system. In addition, the pH of this system acts as a major role in nutrient concentration. Our previous study has observed that pH can influence different nutrient accumulation in aquaponic water (Kim et al., 2023). Usually, the pH level has a decreasing pattern in an aquaponic system. Potassium bicarbonate (KHCO3) is a crystal-white, slightly alkaline substance. It is widely used as a buffering agent in diverse applications to control pH by neutralizing hydrochloric acid (Gupta et al., 2006). KHCO3 can be used to protect aquaponics water from a high acidity.
Iron and potassium are inadequate in fish feed (Graber and Junge, 2009; Stathopoulou et al., 2021) to fill the demand for plant growth in aquaponic system. Iron is necessary for photosynthesis, reproductive organ development, DNA synthesis, and many other cellular functions of plants (Wang et al., 2024). Furthermore, it is an integral element of proteins involved in oxygen transfer and cellular respiration of fish. However, aquaponic system often faces iron deficiency (Lee et al., 2020). The pH of aquaponic water is also a factor affecting iron deficiency. Once iron deficiency is addressed, steps need to take to prevent further issues. Therefore, supplementing Fe in aquaponics water can enhance plant performance. Intensive management is required for this supplementation, despite, the lacking of its adequate information. Ethylenediaminetetraacetic acid (EDTA) is an acid widely used to bind to iron (Fe2+/Fe3+) for forming water-soluble complexes in a solution even at neutral pH (EFSA, 2020). It is used to dissolve Fe and deliver iron ions where its oxides are insoluble. Potassium is involved in most of the biochemical and physiological processes of plants. It helps plants survive against various biotic and abiotic stresses. Stomatal closure of plants is regulated by guard cells into the leaf apoplast by releasing K+ rapidly (Hasan et al., 2022). It would be difficult for stomata to remain open under K-deficient conditions. Thus, due to the scarcity of potassium, additional supplementation is required for aquaponic-grown plants. However, when K supplementation exceeds the optimal limit of plants, it can generate salinity stress and inhibit plants' accumulation and uptake of other nutrients. Phosphorus is another essential nutrient involved in several structure compounds and biochemical reactions in plants. It has a special role in improving flower formation of plants. It also plays a role in capturing and converting energy from light into useful plant compounds (Bichsel et al., 2008). Plants show leaf discoloration when they face phosphorus deficiency (Doncato and Costa, 2023). Potassium dihydrogen phosphate (KH2PO4) is a source of phosphate and potassium for plants (Priya and Shahi, 2009).
Countable research has been conducted on aquaponics systems in recent years (Asciuto et al., 2019; Ghamkhar et al., 2020; Greenfeld et al., 2021) and additional nutrition supplement impact on such systems. However, information about the effect of potassium-based nutrition with iron and buffering agent KHCO3 in a large-scale aquaponic system or small-scale for planterior purposes is still lacking. Therefore, the aim of this study was to determine effects of KHCO3, Fe-EDTA, KH2PO4, and their combinations on growth parameters of geranium and nutrient concentrations in aquaponic water containing goldfish for planterior purposes.
Materials and Methods
Growing conditions
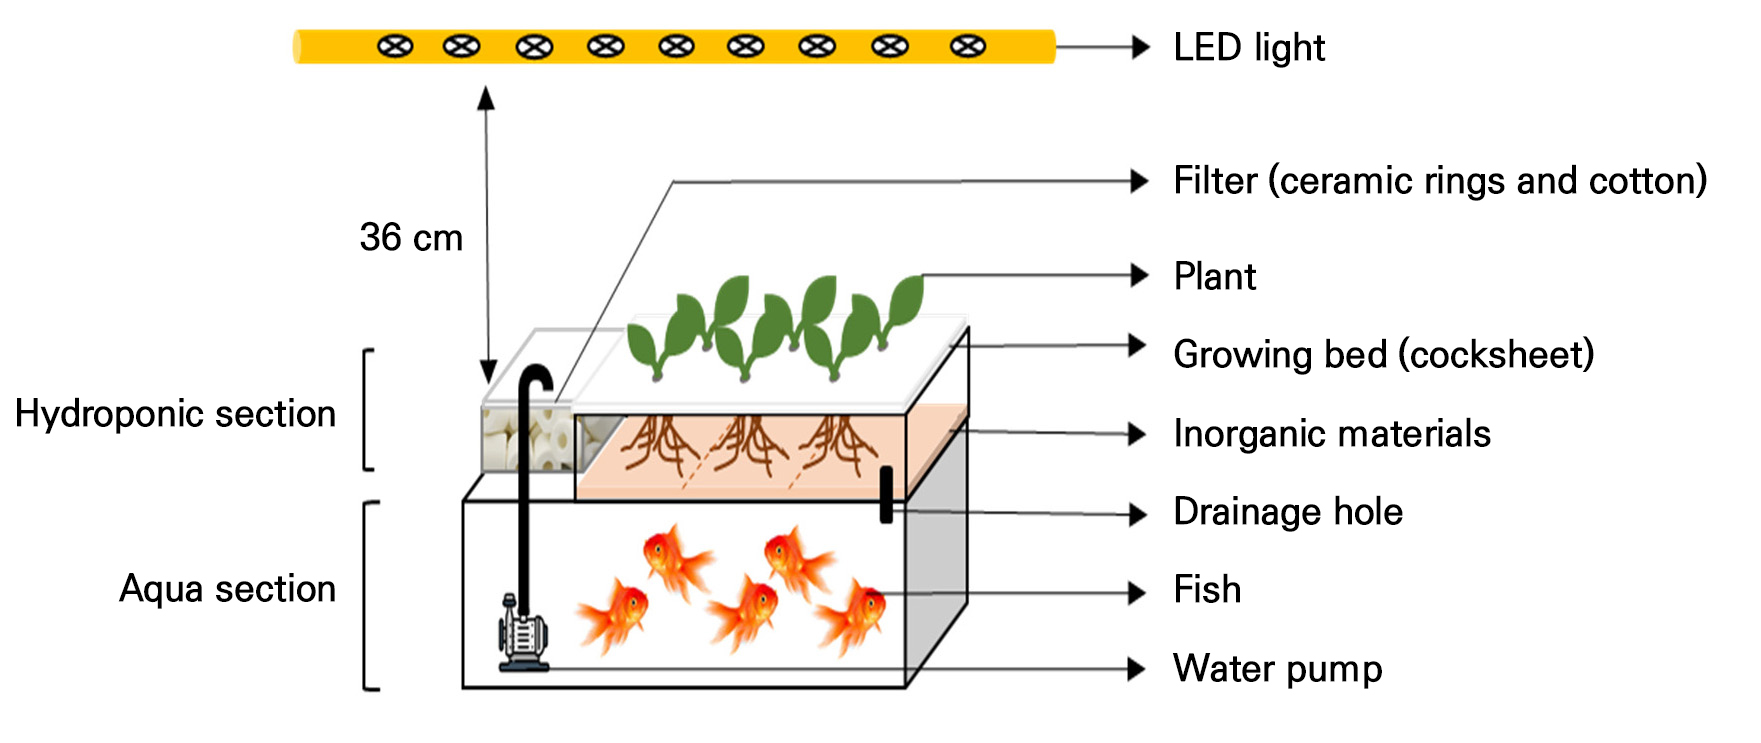
This experiment was undertaken in controlled environment conditions from August 23, 2022 to October 22, 2022. An aquaponic system was set up in a small tank (46 cm × 32 cm × 24 cm; KSP-1000, Gahwa tech, Korea) with 15L water considering the purpose of the home’s interior (Fig. 1). The tank had two sections, namely the bottom section and the upper section. The bottom section was used for fish keeping (aqua) and the upper section was used for plant growing (hydroponic). A recycling deep flow system was used with water circulated by an underwater motor from the bottom section to the upper section and then drained from the upper section to the bottom section. In the upper section of the tank, three different inorganic materials, a hydroball (0.5 cm; Better loess ball, Potted World, Korea), a volcanic rock (1.5 cm; Safflower rock, Bando sangsa, Korea), and a mixed orchid stone (0.3 and 1.5 cm at 1:3 ratio; Hyugato, Hugato, Japan), were used as growing substrates at 1:1:1 ratio. Each material was taken in 2L volume. In addition, filtering cotton (20 cm × 15 cm) and 800 ml of ceramic rings (Siporax, sera co., ltd. USA) were placed in the corner of the upper section. These materials ensured that clean and colorless water could be supplied into the bottom section. Because of evapotranspiration, water was slightly reduced from the tank during the treatment period. For this reason, fresh water was added to adjust water to 15L in the tank every 7 days. Temperature and relative humidity were maintained at 23 ± 3°C and 65 ± 5%, respectively. White light-emitting diodes (LEDs) were used and intensities were fixed at 100 µmolm2s-1 for plants. The light:dark cycle was settled at 14:10.
Plants and fish
Geranium (Pelargonium zonale L.) plants were used. Uniform-sized plants (height was 4.5 cm, around 6 leaves) were selected for treatments. Every tank had six plants. Before transplanting plants into the aquaponic system, fish were grown for 8 weeks in the water to prepare suitable pH and EC for plants. Five goldfish (Carassius auratus auratus) (81.8 ± 1.8 g per fish) were used for each tank. Each tank was supplied 0.4 g fish feed (Grovita, Korea feed co., Korea) per day. Feed ingredients were calcium (0.40%), phosphorus (1.80%), crude fat (4.0%), crude fiber (5.0%), crude flour (13.0%), and crude protein (36.0%).
Treatment
Three different nutrition supplement, potassium bicarbonate (KHCO3), iron (Fe-EDTA), and potassium phosphate (KH2PO4), were added into the aquaponic water as nutrition supplement. These supplements and their combinations acted as a treatment T1 (KHCO3), T2 (KHCO3 + Fe-EDTA), and T3 (KHCO3 + Fe-EDTA + KH2PO4). In every treatment, KHCO3, Fe-EDTA, and KH2PO4 were used at 50 mgL-1, 3.8 mgL-1, and 102 mgL-1, respectively. These were added on two different days during the treatment period, on the initial day and after 35 days. The control (C) was not treated by any nutrition supplement.
Water quality analysis
EC and pH of water were inspected every day using a multipurpose water quality meter (HI9813-6, Hann instruments Inc., Romania). Due to a nitrification process in the aquaponic system and nutrient absorption by plants, the level of pH in this water showed a tendency to decrease. When the pH level was decreased to 4.5 or less, 5 ml 1N KOH was added to avoid becoming more acid. On the other hand, the EC showed a tendency of increasing. Notably, this experiment’s purpose was planterior development. The intention was to keep plants and fish together for two months or more. EC is an important factor. We tried to maintain it below 0.75 dSm-1. Because EC 1 dSm-1 or a little bit higher was not preferable for pisciculture, we replaced treated water in every tank with 5L of fresh water at 23 and 30 days after treatment. To determine the quality of water in different treatments, ion analysis was done at 20, 30, 35, and 60 days after treatment. Two steps of filtration were performed before ion analysis. At first, water was filtrated with a filter paper (Whatman, no. 6, Buckinghamshire, UK). This filtrated water was again filtered (50 mL) through a syringe filter (0.22 µm, PVDF, Rainbow, Korea). After this, samples were used for ion analysis. Major ions in water samples, i.e., K+, PO42-, Mg2+, Ca2+, NO3-, NH4+, Cl-, SO42-, Na+, and Fe2+, were analyzed with an ion chromatograph (940 Professional IC Vario, Metrohm, Switzerland). Fe2+ was analyzed with atomic emission spectrometers (Integra XL DUAL sequential type, GBC scientific equipment, Australia).
Measurement of plant growth parameters
Growth parameters of Pelargonium zonale L. were measured at 30 days and 60 days after treatment. A ruler was used for measuring plant height, leaf length, and leaf width. The number of leaves per plant was counted manually. Chlorophyll concentrations of leaves were measured using a chlorophyll meter (SPAD 502, Minolta, Japan). Three fully opened and healthy upper leaves were selected from each plant and their upper leaf blades were chosen for SPAD reading.
Statistical analysis
The experiment was conducted with a completely randomized design using three replications per treatment. Effects of treatment and significant differences were evaluated using IBM SPSS Statistics (version 24 for windows, IBM Corp., Armonk, NY, USA) and analysis of variance (ANOVA) followed by Duncan’s Multiple Range Test (DMRT) at p < 0.05. OriginLab 10.0 software 176 (OriginLab, Northampton, MA, USA) was used for principal component analysis (PCA).
Results and Discussion
EC and pH
EC in aquaponic water should be less than 1 dSm-1 according to suggestions of different research studies. Wortman (2015) has reported that plants prefer EC less than 1 dSm-1 in an aquaponic system because aquaculture effluent could fertilize by different bio-chemical reaction and it activates at this level of EC. Although Alvarez-Garcia et al. (2019) have shown that EC 1.4 dSm-1 is better than EC 1.6 dSm-1 and 1.2 dSm-1 for geranium plants in a hydroponic system where the growing medium is a mixture of peat moss and perlite (4:1), this EC range is not preferable for aquaponic fish. In addition, their study was performed for planterior purposes. Thus, we tried to maintain the range of EC not exceeding 0.75 dSm-1 to keep plants and fish together in long-term in a small tank (Fig. 2). For this reason, we added 5 L of fresh water at 23 and 29 days of treatment into all aquaponics tanks. As a result, during these days, the EC value in every treatment was sharply decreased. However, after this, EC in every treatment again showed an increasing trend. At 60 days after treatment, the range of EC in the water of all treatments was between 0.62 and 0.68 dSm-1.
Aquaponic water's electrical conductivity (EC) usually shows an increasing trend. In this study, EC of all treated water also showed an increasing trend (Fig. 2A) during the treatment period (except for 23 and 29 days of treatment because of newly added water). The EC value increased in all treatments due to input fish feed and different nutrient accumulation in water with increasing duration of the treatment period. Other researchers have also found that EC in aquaponic (between lettuce and tilapia) water is increased with increasing treatment period (Delaide et al., 2017). They reported that nitrate and calcium accumulated faster than other nutrients, leading to rising EC of the water. Most of the time, EC values of T2 and T3 treated water were higher than those of T1 and control (Fig. 2A). EC of control treatment was always lower than EC values of other treatments. Supplement nutrition is a source of different nutrients that could increase ionic concentrations in aquaponic water and lead to increased EC levels (Song et al., 2019). In control, no supplement was used. For this reason, EC was always lower in the control than in other treatments (Fig. 2A). On the other hand, supplement nutrition used in T2 and T3 treatments resulted in more nutrients than T1, leading to higher EC levels in T2 and T3 groups than in T1. Researchers have noted that EC levels of aquaponic water are influenced by nutrient concentration in the water (Nicoletto et al., 2018; Yang and Kim, 2019).
The pH of aquaponic water plays a crucial role in fish health through oxidation of NO2 and NH4 in this system (Chen and Ma, 2006). The range of pH also affects nutrient uptake of plants (Wortman, 2015). In this study, the pH fluctuated in all treated water with a range of 4.2 to 6.2 (Fig. 2B). Different treatments showed different ranges of fluctuation. It was observed that from 5 days of treatment, the pH showed a tendency of decreasing in all treatments due to nutrient cycle and fish activities. Our previous study also showed that pH of aquaponic water had a decreasing tendency where goldfish and Kalanchoe were kept together (Kim et al., 2023). Schreier et al. (2010) have noted that in an aquaponic system, fish excreta and fish feed could add ammonia in aquaponic water and lead to the release of H+ through nitrification. This phenomenon might be the prime reason for the low pH found in aquaponic water which would acidify the water during treatment (Fig. 2B).
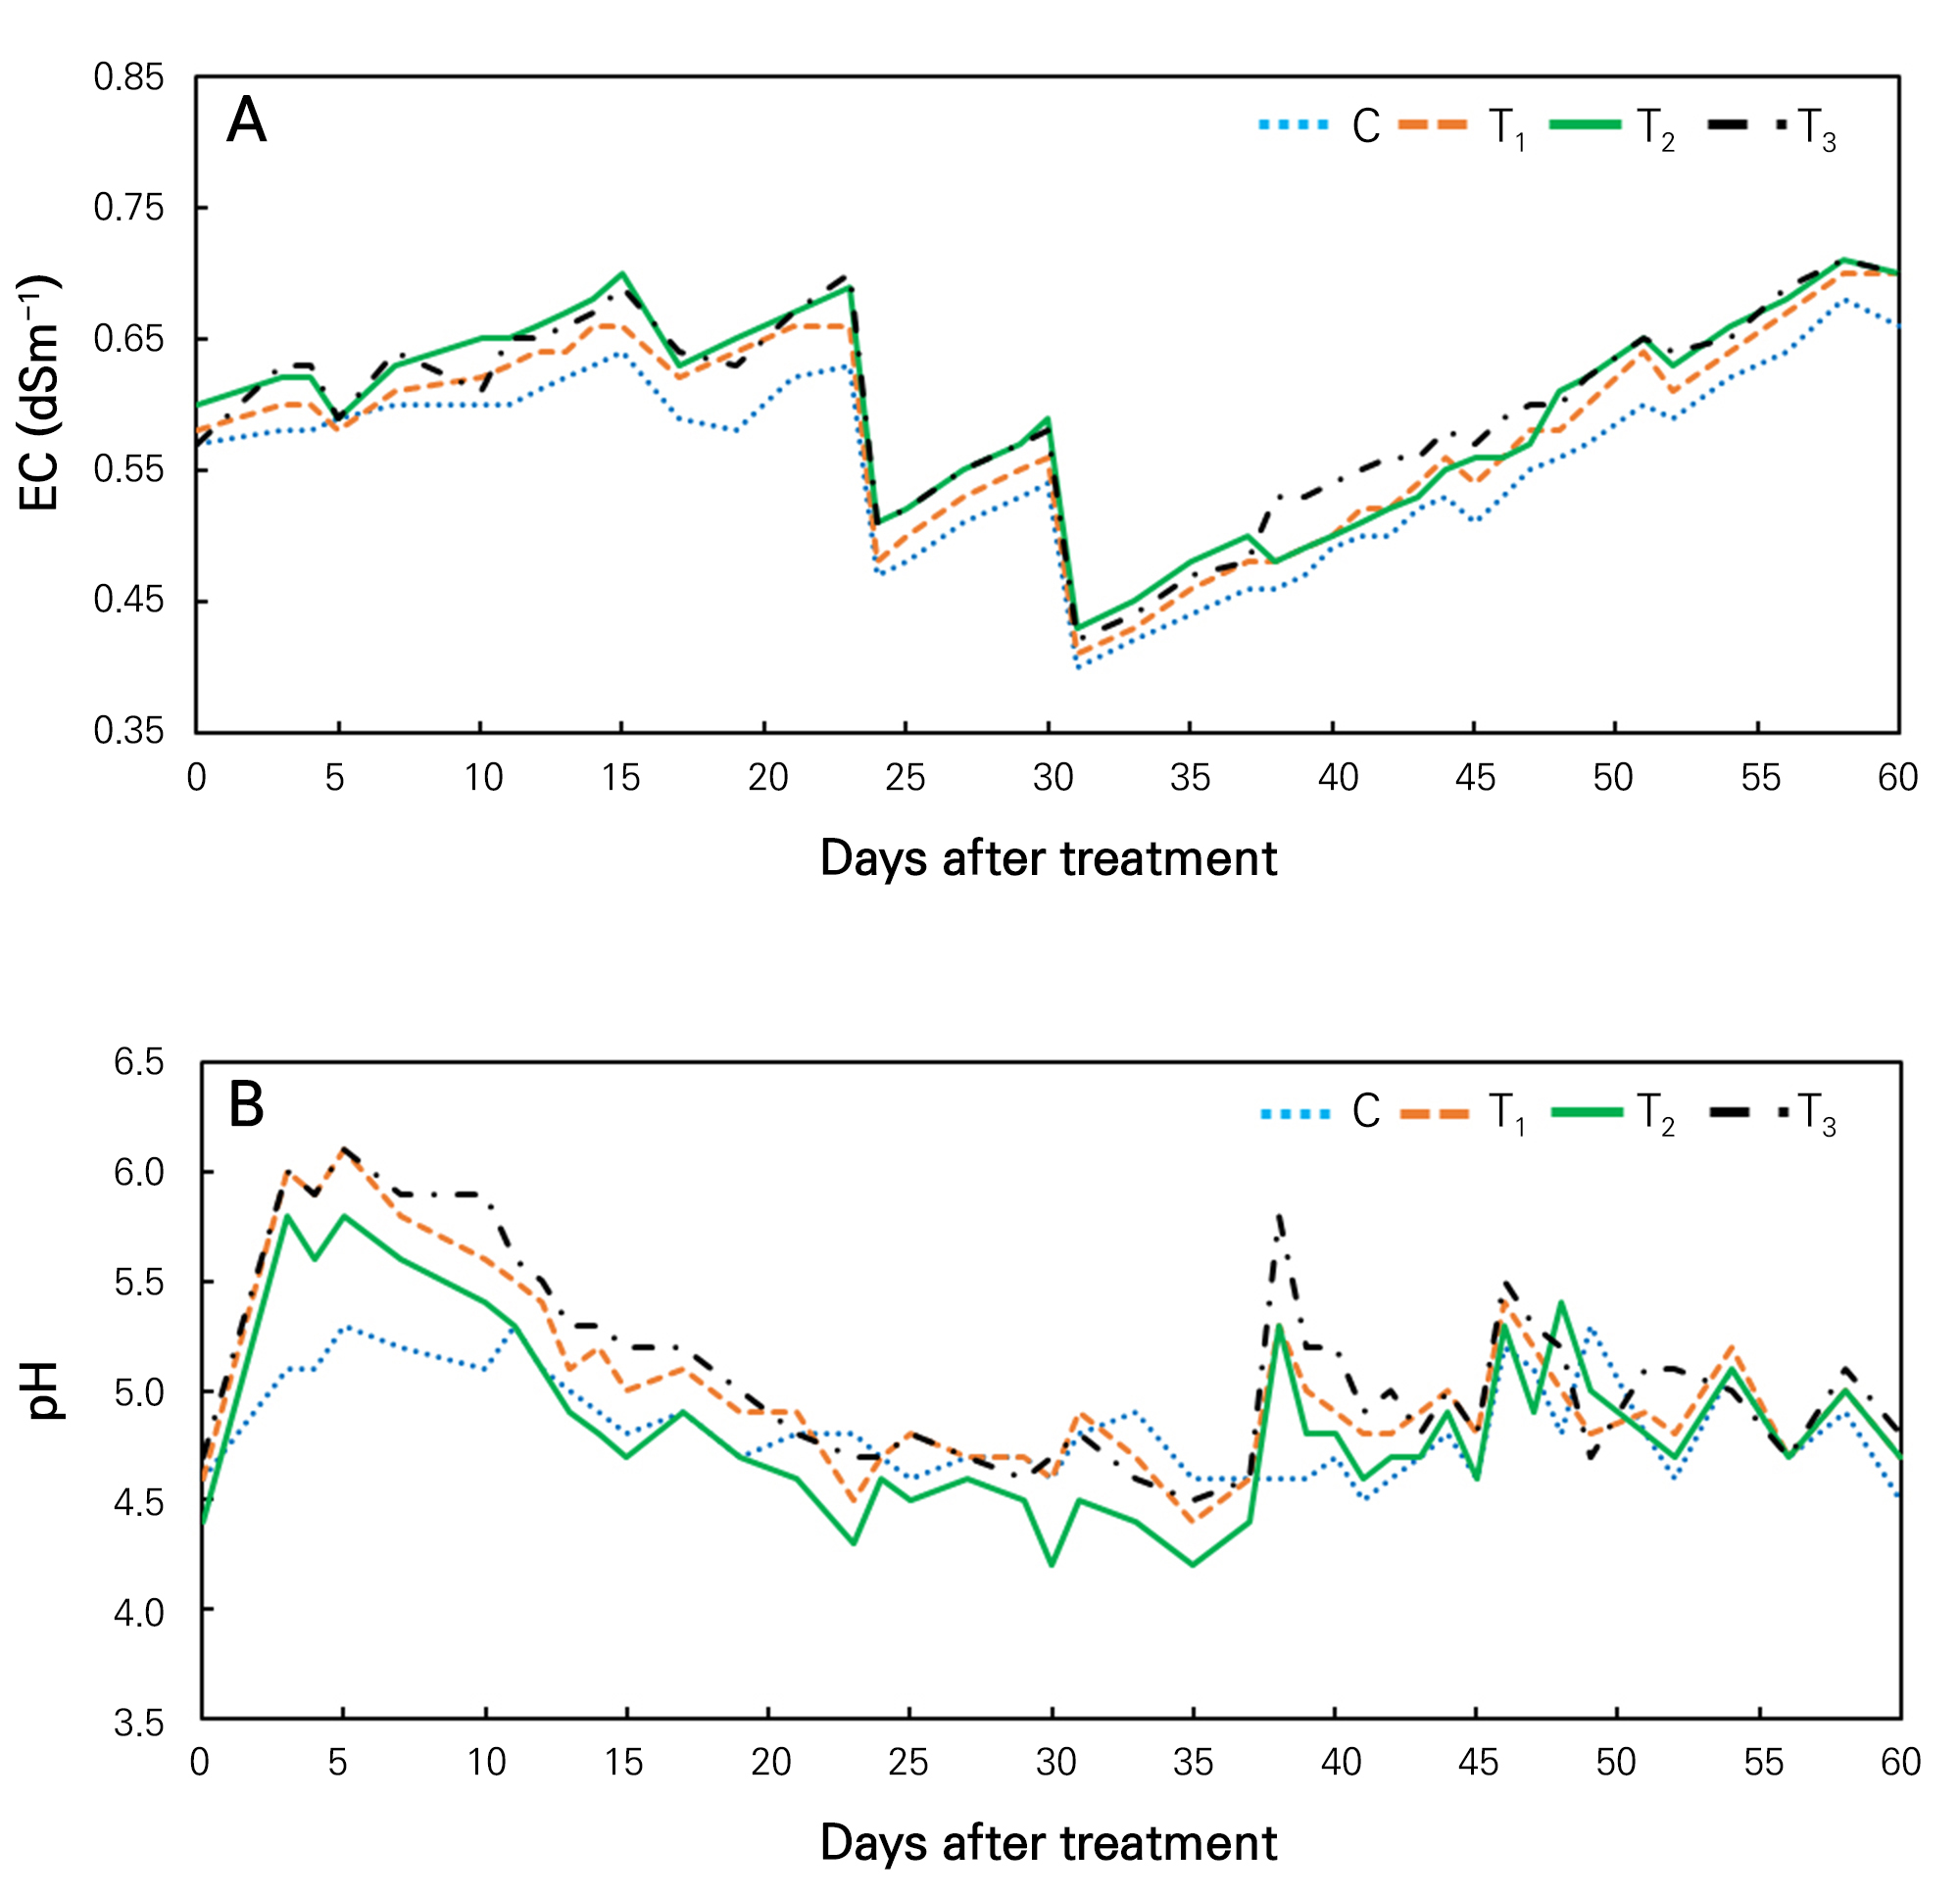
T3 and T1-treated water showed higher pH values (range, 4.5 to 6.2) than control and T2-treated water (Fig. 2B). In T1 treatment, KHCO3 was added. It could act as a buffering agent by neutralizing hydrochloric acid. For this reason, the pH value of T1-treated water was higher than that of the control. Although KHCO3 was added to the T2 treatment, Fe-EDTA was also included in this treatment. Fe-EDTA might be the reason for a lower pH value in T2 treatment than in T1. Furthermore, T3-treated water had higher pH than others because of additional potassium dihydrogen phosphate (KH2PO4) nutrient supplementation, which was absent in other treatments. When KH2PO4 is dissolved in water, it will generate OH- ions (therefore pH is rising) because it is a salt derived from a weak acid (H3PO4) and a strong alkali (KOH) (Al-Sarraf and Abbas, 2020).
Nutrients in water
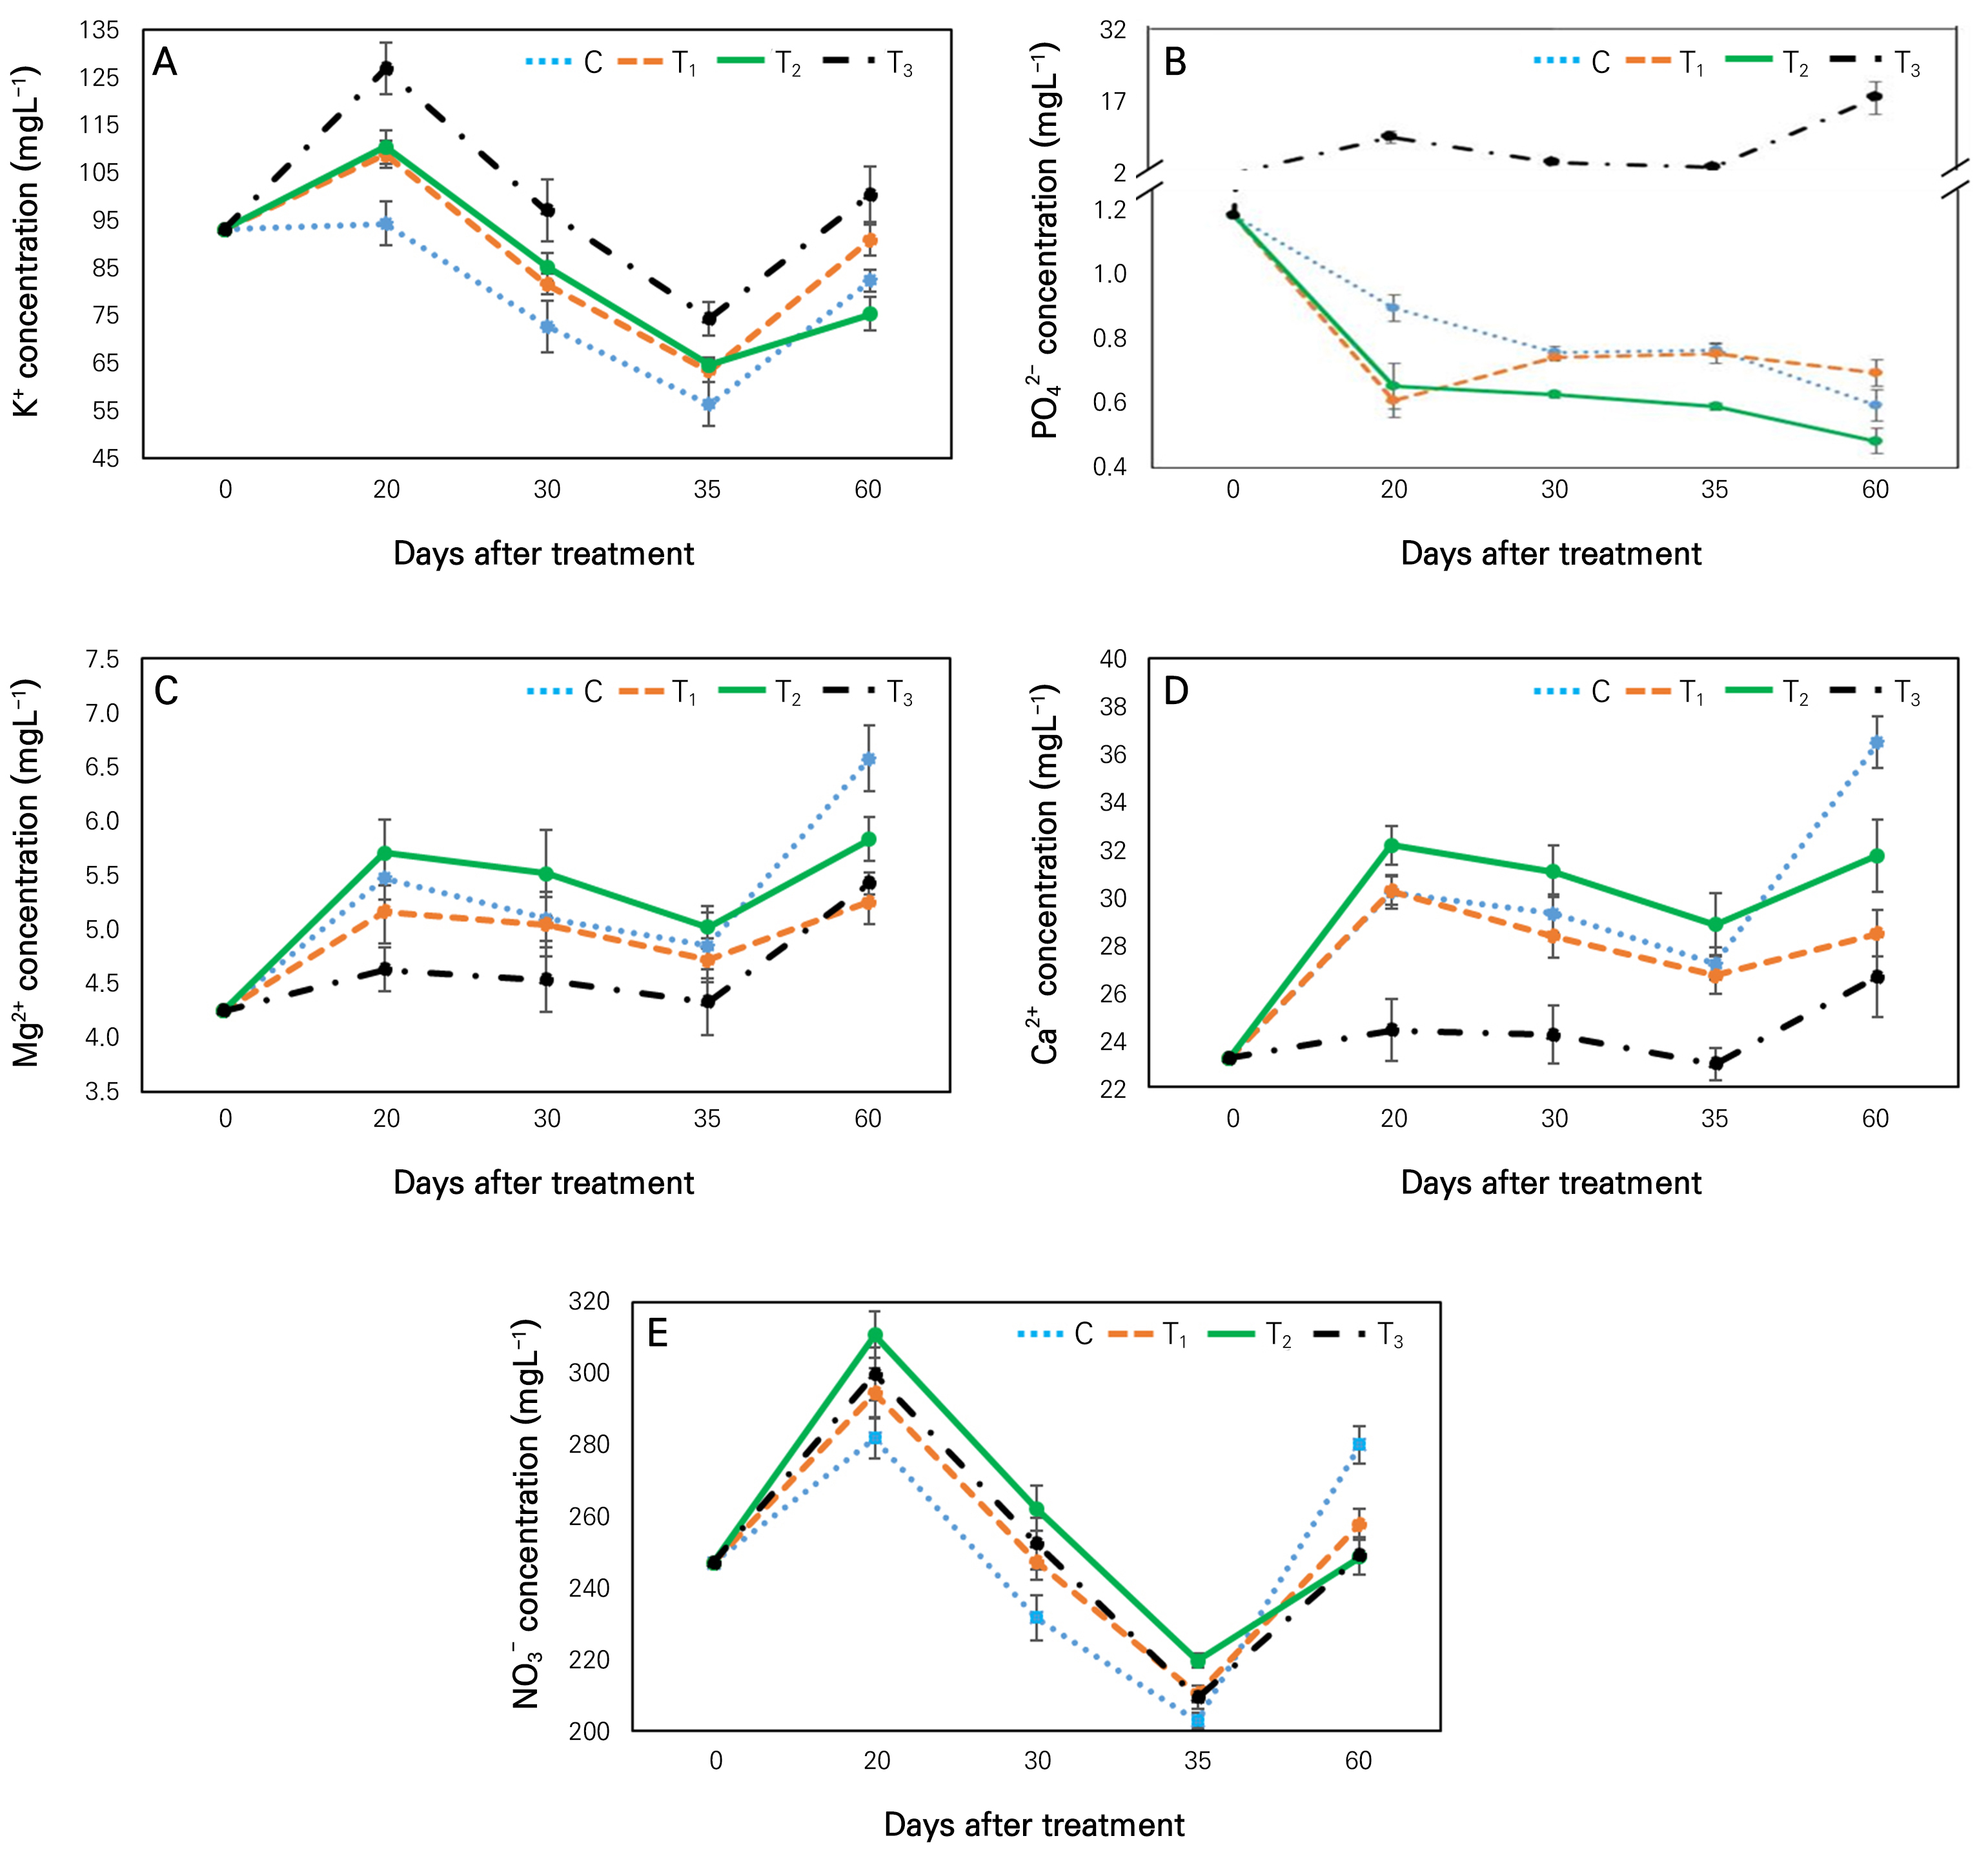
All used nutrition supplements in this study were major sources of potassium in aquaponic water. For this reason, the concentration of potassium was significantly higher in different treatments than in the control at 20 and 30 days after treatment (Fig. 3A). At 20 days after treatment, K+ was the highest (126.7 mgL-1) in T3 treatment. It was significantly 34% higher than that in the control. At 60 days after treatment, K ion was significantly higher in all treatments (except T2) than in the control. In T2 treatment, Fe-EDTA might act as a factor for reduced potassium concentration in its water at 60 days after treatment. Although T2 and T3 both are sources of Fe, the nutrition of T3 carries two potassium-based compounds (KHCO3, KH2PO4) whereas T2 carries only one (KHCO3). As a result, potassium ion could act more dominancy on Fe in T3-treated water than in T2. Notably, to keep EC strength below 0.75 dSm-1, we replaced aquaponic water with 5L of fresh water at 23 and 30 days after treatment, which was the reason for the sharply decreased K+ ion in all treatments between 20 days and 35 days (Fig. 3A).
Phosphate ion (PO42-) in T3-treated water was higher compared to other treatments is shown in Fig. 3B. Fish diet is a prominent source of phosphorus in aquaponics water. Hussain et al. (2015) have noted that fecal matter and food residues are prime sources of phosphorus in aquaponic systems. However, around 30-65% of phosphorus are inaccessible to plants for uptake because it is fixed in a solid form as excretions. Furthermore, the added nutrition in T3 treatment contained potassium dihydrogen phosphate (KH2PO4) as another source of phosphate in water of this treatment group, resulting in a significantly higher concentration of phosphate in this aquaponic water than in other treatments (Fig. 3B).
At 60 days after treatment, magnesium, calcium, and nitrate ions were significantly higher in the control than in other treatments (Fig. 3C, 3D, and 3E). Usually, when K+ was enriched in aquaponic water, Mg2+ and Ca2+ were decreased. KH2PO4 is an additional source of potassium in T3 treatment compared to T2. For this reason, during the treatment period, the concentration of K+ was higher while concentrations of Mg2+ and Ca2+ were lower in T3 than in T2 (Fig. 3). Furthermore, during the treatment period, K+ concentration was significantly lower in the control than in T3 because the control lacked additional potassium-based nutrition. Moreover, Mg2+ and Ca2+ concentrations were significantly higher in the control than in T3. At 60 days after treatment, Mg2+ and Ca2+ concentrations were the highest in the control. They were 21% and 37% higher than those in T3 treatment, respectively. Shamsi et al. (2010) have reported that increased supplementation of K can inhibit Ca accumulation and absorption and vice versa. Other research studies have shown that added iron and potassium nutrition in aquaponic water can suppress nitrate accumulation compared to the control (Stathopoulou et al., 2021). In the present study, supplements used in T2 and T3 treatments included iron and potassium which were absent in the control, resulting in lower NO3- concentrations in T2 and T3 treated water than in the control (Fig. 3E). At 60 days after treatment, NO3- concentration was around 11% significantly lower in T2 or T3-treated water than in the control. Notably, adding fresh water at 23 and 30 days after treatment decreased concentrations of Mg2+, Ca2+, and NO3- in all treated water from 20 days to 35 days (Fig. 3C, 3D and 3E).
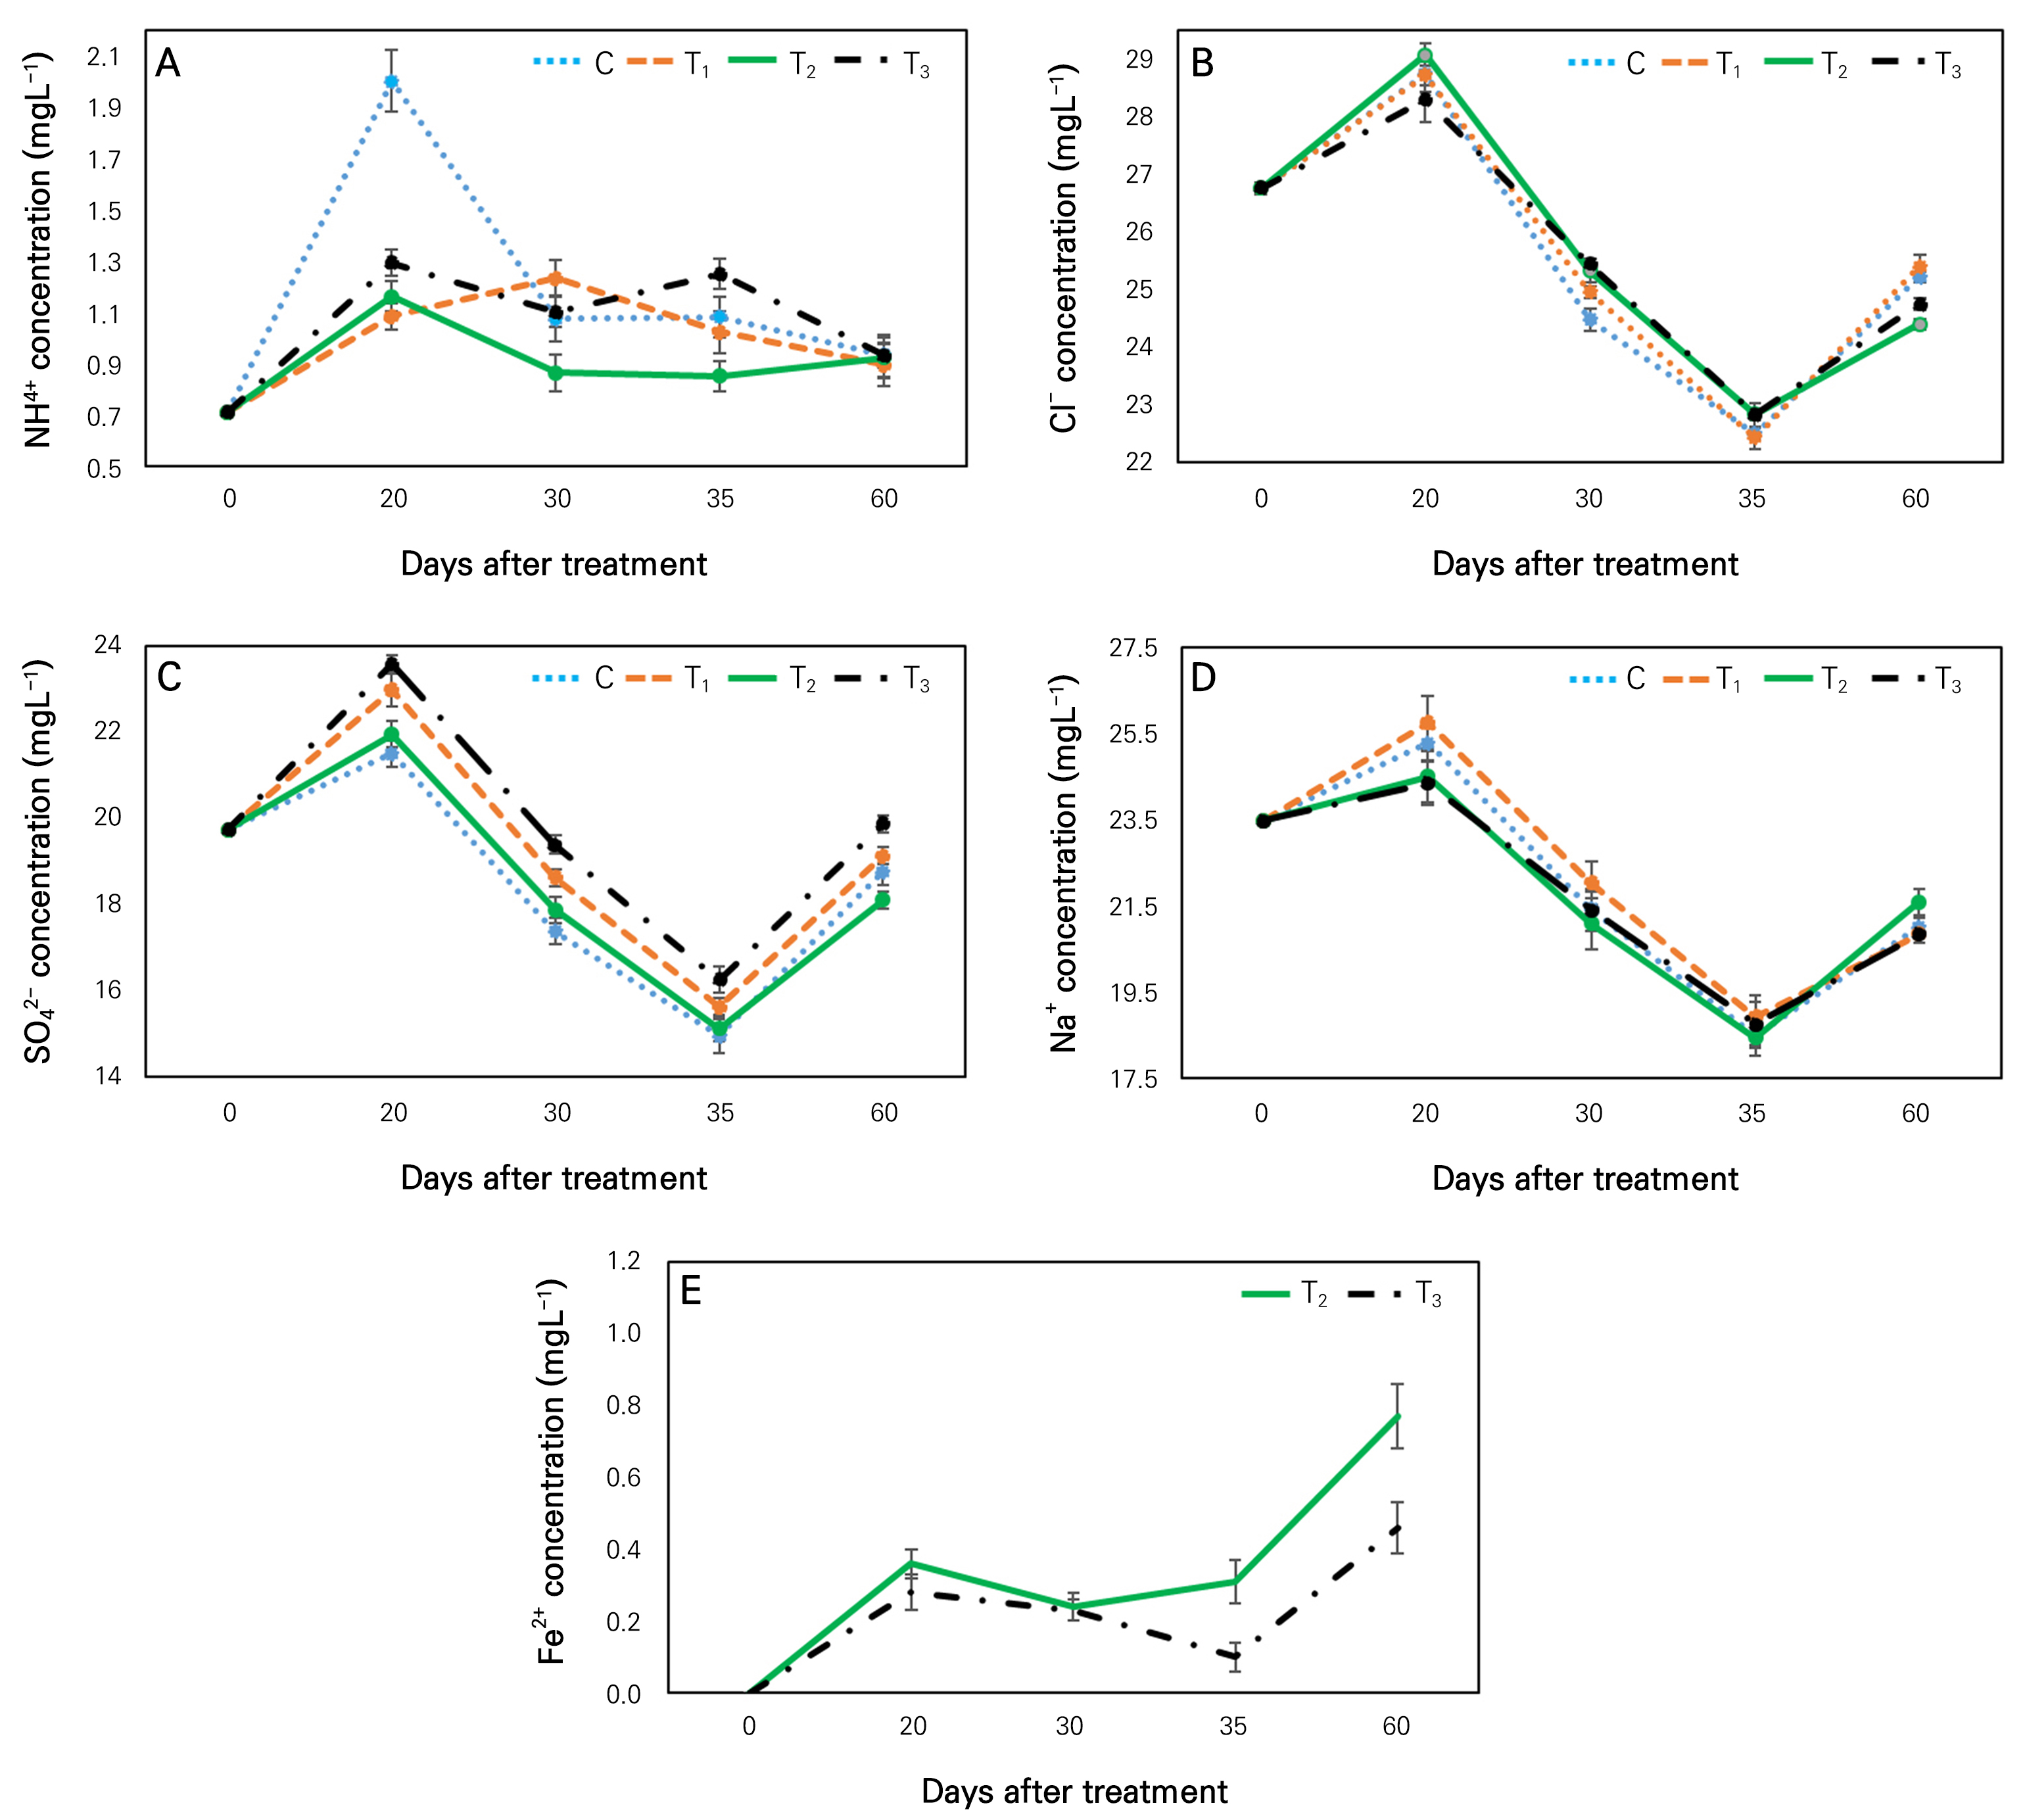
Generally, ammonium ion (NH4+) is converted into nitrate (NO3-) through nitrification. In this study, we also observed that ammonia ion was decreased in the control and T1 treatment at 60 days after treatment compared to that at 30 days after treatment (Fig. 4A). However, nitrate ion levels were increased in the control and T1 treated water after 60 days of treatment than those after 30 days of treatment. Nitrification might be the reason for this inverse trend between NH4+ and NO3- ions in these treatments. Nitrification is a process (biological) in aquaponic systems where nitrite-oxidizing bacteria (NOB) could convert ammonia–nitrogen (NH3–N; a toxic form of nitrogen) into a nitrate (non-toxic form) and conserve water quality (Yang and Kim, 2019; Doncato and Costa, 2023).
At 60 days after treatment, the concentration of chloride in water was increased in control and T1 treatment but decreased in T2 and T3 treatments compared to that at 30 days after treatment (Fig. 4B). Additional Fe input through nutrition might be the reason for decreased Cl- in T2 and T3 treated water. Earlier research has shown that when iron concentration is increased in water, it can result in a decreased chloride concentration (Li et al., 2022). Iron deposits in aquaponics water can stimulate chlorine consumption by plants.
Compared to 30-day treated water, sulfate ion (SO42-) was significantly increased in the control, T1, and T3 at 60 days after treatment (Fig. 4C). Furthermore, it was the highest in the T3 treatment. In addition, at 60 days after treatment, SO42- was significantly lower in T2 treatment than in others. The presence of Fe might be the reason for the lower concentration of SO42- in T2-treated water. Although Fe was present in T3 treatment, K ion was dominant over Fe in this treatment.
Until 35 days, Na+ concentration was similar in T2 and T3 treatments but lower than in T1 (Fig. 4D). After 60 days of treatment, Na+ concentration was significantly higher in T2-treated water than in others. The decreasing trend of Cl-, SO42-, and Na+ in all treatments between 20 and 35 days (Fig. 4) was the reason for adding fresh water on days 23 and 30. As illustrated in Fig. 4E, Fe2+ was only present in T2 and T3 treatments. It happened due to the nutrition supplement of Fe-EDTA which was absent in control and T1 treatment. Furthermore, from 35 days of treatment, Fe2+ was significantly (more than 50%) higher in T2-treated water than in T3 (Fig. 4E). Supplement KH2PO4 might be the reason for the lower Fe2+ in T3 treatment.
Plant growth parameters
At 60 days after treatment, plant height was significantly higher in T2 treatment than in others (Fig. 5A). The lowest plant height (4.94 cm) was observed in the control treatment. T2-treated plant was significantly (23%) taller than those grown in the control. The number of leaves was significantly higher in T2-treated plants than in others at both 30 days and 60 days after treatment (Fig. 5B). Plants that were grown in T2 treatment had 64% and 92% higher numbers of leaves than those grown in control at 30 and 60 days after treatment, respectively. At 60 days after treatment, a high concentration of chloride in control and T1 treatment was another reason for the lower plant growth in these treatments than in T2 (Fig. 4B). Researchers have noted that a high chloride content in aquaponic water can create an obstacle for plants to absorb nitrogen and other nutrients (Atique et al., 2022).
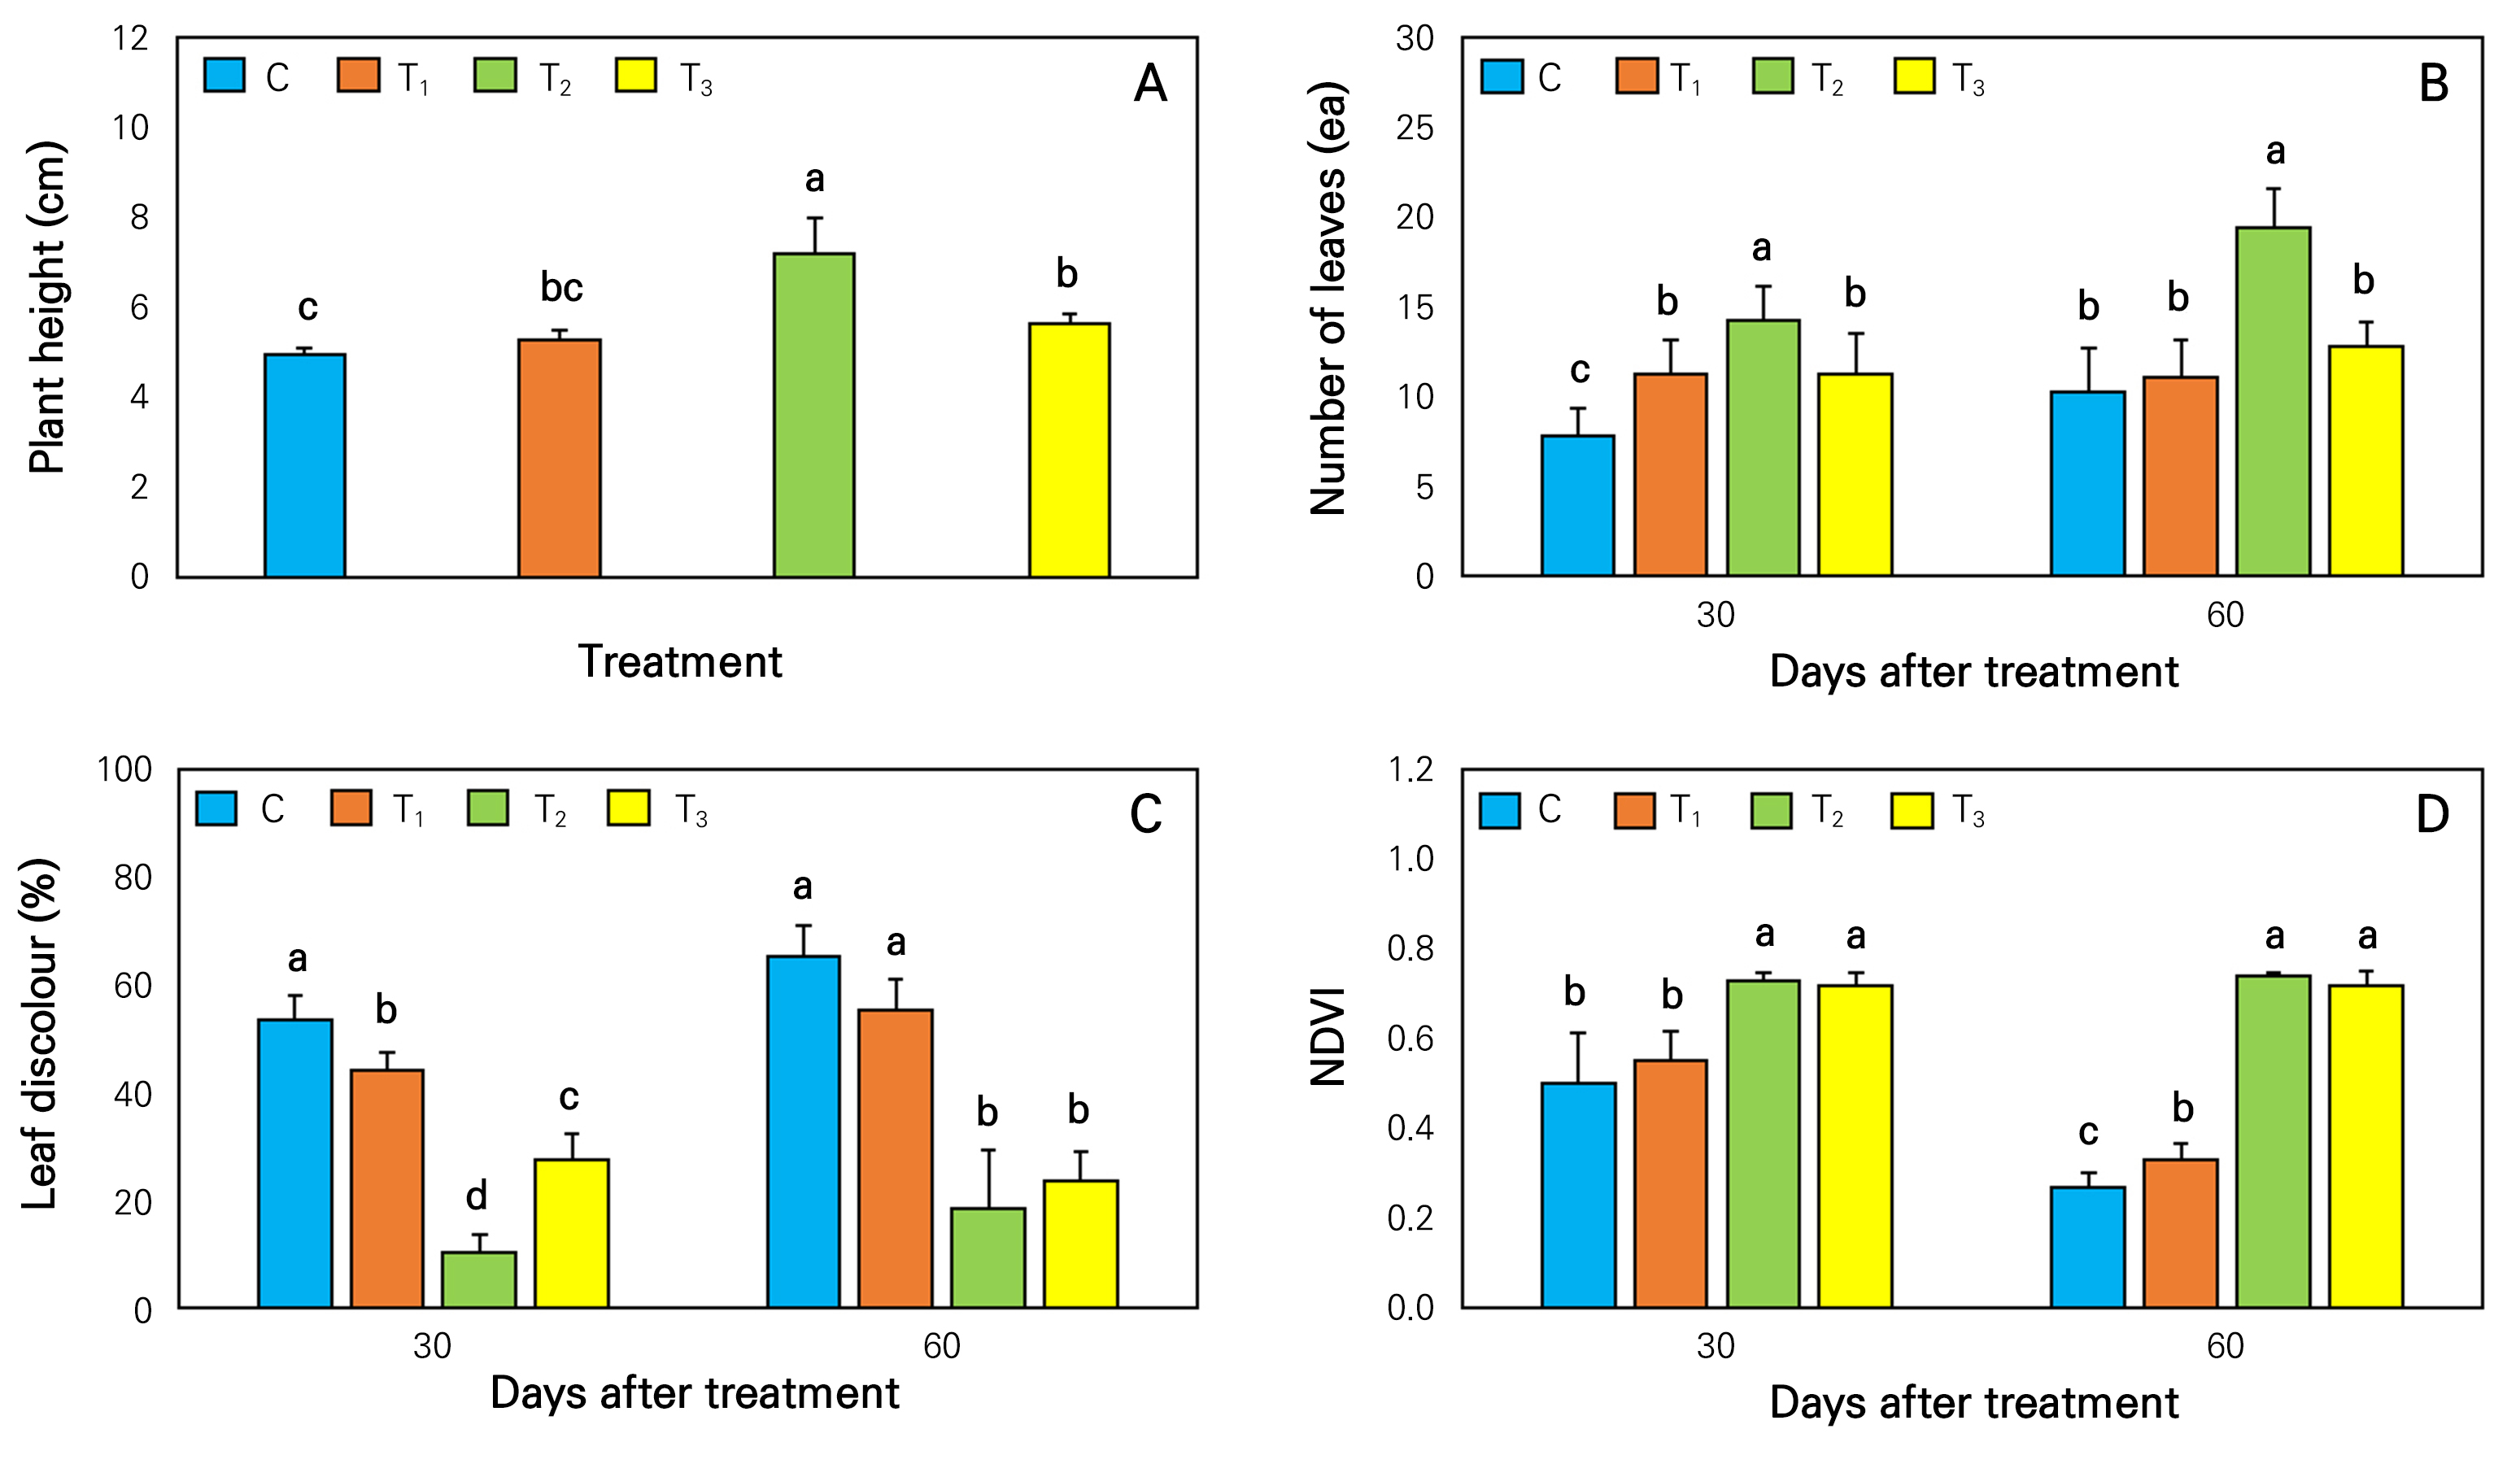
Fig. 5.
Effects of different nutrition supplements on the (A) plant height, (B) number of leaves, (C) leaf discoloration (F) NDVI of P. zonale plants. The same lowercase letters above the bars within the figure indicate non-significant differences based on Duncan’s multiple range test at p < 0.05. (n = 5). C, control; T1, KHCO3; T2, KHCO3 + Fe-EDTA; T3, KHCO3 + Fe-EDTA + KH2PO4.
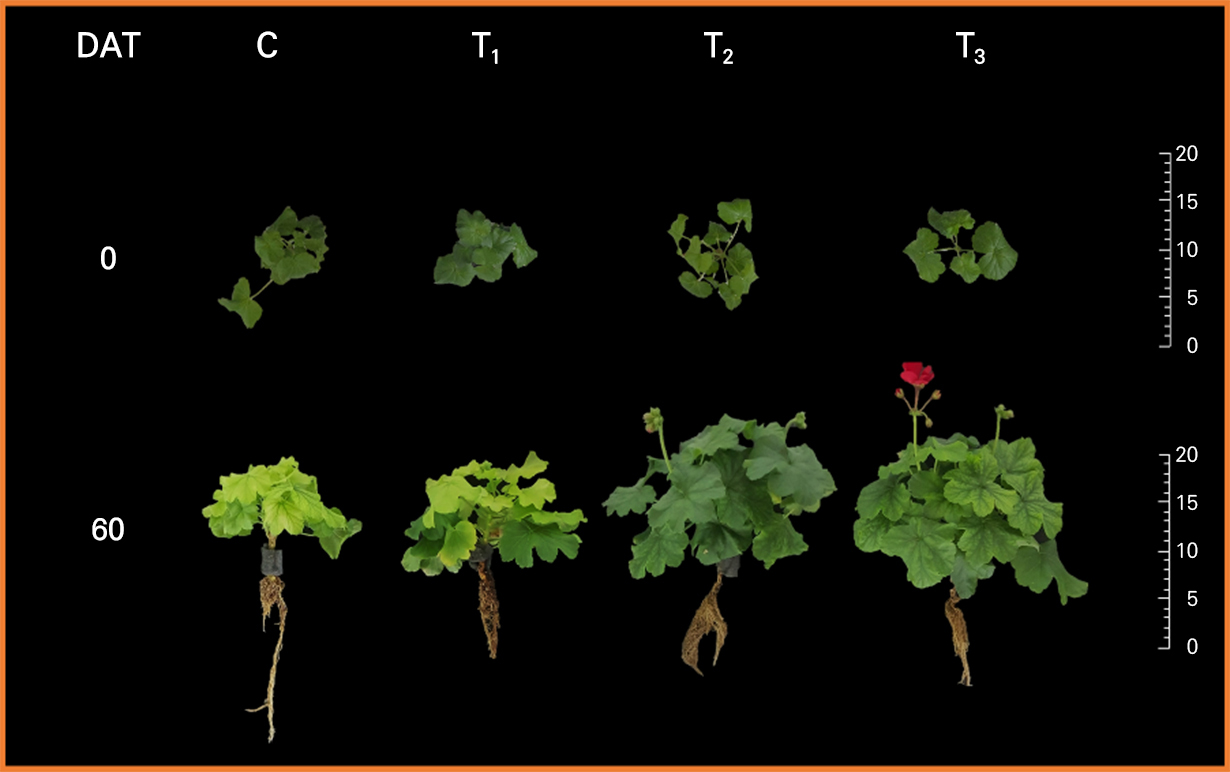
Plants grown in control and T1 treatments showed higher leaf discoloration than in other treatments (Figs. 5C and 6). However, the lowest percentage (10.4%) of leaf discoloration was observed in T2-treated plants at 30 days after treatment. Furthermore, at 60 days after treatment, leaf discoloration was also around 70% significantly lower than that in the control and T1. Leaf discoloration percentage was higher in control and T1-treated plants because of iron (Fe) deficiency in their water (Fig. 4E). Iron deficiency can induce structural changes in photosynthetic apparatus of plants and disturb their whole function (Abadia, 1992). Iron deficiency in pigments seems to arise from the formation of thylakoid membrane. Leaves with iron-deficient thylakoid composition can cause a change in photosystem-II to photosystem-I stoichiometry, the ratio of xanthophylls to chlorophylls, and lipid composition. The visual sign of iron deficiency in plant is chlorosis or yellowing of leaves (Therby-Vale et al., 2022).
NDVI interprets relative reflectance as a parameter of relative plant health by calculating the difference between near-infrared (plant strongly reflects) and red light (plant absorbs) (Tucker et al., 2020). NDVI value greater than 0.5 indicates a good morphological and physiological condition of plants. In this study, NDVI values of T2 and T3 treated plants were always significantly higher than those in control and T1 treatment (Fig. 5D). Furthermore, NDVI values were always higher than 0.7 in T2 and T3-treated plants. Healthy and green color leaves are the reason for higher NDVI values of T2 and T3-treated plants. In addition, a large proportion of discolored leaves in plants grown in control and T1 treatment resulted in NDVI values less than 0.4.
The physiological condition of plants is also predicted by chlorophyll contents in their leaves (Zhao et al., 2016). SPAD (Soil Plant Analysis Development) meter is a commonly used tool to measure chlorophyll status in leaves (Hyun et al., 2024). At 30 and 60 days after treatment, T2 and T3 treated plants showed 2 times and 3 times higher SPAD values, respectively, compared to those grown in control and T1 treatment (Table 1). The lowest SPAD value (9.1) was observed for control plants after 60 days of treatment. Hu et al. (2014) and Lee and Lee (2024) have noted that SPAD readings are influenced by chlorophyll distribution along the leaf blade. A deficiency of iron in the control and T1-treated water might be the reason for the lower SPAD values in these plants (Fig. 4E). This is because iron deficiency can lead to lower chlorophyll contents in leaves and affect its functions in a plant.
Leaf length and leaf width of T2-treated plants were significantly (around 10%) larger than control and T3-treated plants at 30 days after treatment (Table 1). Furthermore, these were more than 10% larger at 60 days after treatment than in control and T1-treated plants. Notably, additional iron (Fe-EDTA) into aquaponic water of T2 and T3 treatment resulted in good health conditions of their plants based on NDVI and SPAD values. It is also a reason for their higher leaf length and leaf width than others. Although at 30 days after treatment, leaf length and leaf width of T1 treated plants were similar to those of T2 treated plants, continuous lacking of iron in the water of T1 treatment resulted in lower leaf length and width in its plants than T2 and T3 treatments at 60 days after treatment (Table 1). Iron deficiency can disrupt chlorophyll concentration in leaves and photosynthetic activities of plants (Kim et al., 2021).
Table 1.
Effect of different supplements and their combinations on plant growth characteristics of P. zonale in aquaponic system. C, control; T1, KHCO3; T2, KHCO3 + Fe-EDTA; T3, KHCO3 + Fe-EDTA + KH2PO4
| Days | Treatment | Plant growth characteristics per plant | ||
| Leaf length (cm) | Leaf width (cm) | SPAD (value) | ||
| 30 | C | 3.5 ± 0.2z by | 6.0 ± 0.5 b | 18.0 ± 2.8 c |
| T1 | 4.1 ± 0.3 ab | 7.1 ± 0.4 ab | 24.8 ± 2.7 b | |
| T2 | 4.6 ± 0.8 a | 8.1 ± 1.4 a | 40.2 ± 3.6 a | |
| T3 | 3.9 ± 0.4 b | 6.9 ± 0.3 b | 41.6 ± 4.7 a | |
| 60 | C | 3.2 ± 0.2 c | 5.1 ± 0.5 c | 9.1 ± 1.6 c |
| T1 | 3.7 ± 0.3 b | 6.3± 0.8 b | 14.7 ± 2.3 b | |
| T2 | 4.7 ± 0.3 a | 7.4 ± 0.9 a | 44.6 ± 3.0 a | |
| T3 | 4.5 ± 0.3 a | 7.8 ± 0.7 a | 42.5 ± 3.6 a | |
Principal component analysis (PCA) was also carried out to uncover the correlation between different plant growth characteristics of geranium and nutrition supplement treatments. As illustrated in Fig. 7, PC1 explained 89.84% variability and PC2 explained 9.25% variability. The graph indicates that the number of leaves and plant height are positively correlated with each other. Other researchers have noted that the number of leaves and plant height are positively correlated with each other for plants grown in controlled conditions (Gao et al., 2022; Choi et al., 2022). Leaf length, leaf width, SPAD, and NDVI also showed positive correlations. Their response is closer for T2 and T3 treatments. Wang et al. (2012) have reported that SPAD and NDVI values have a positive correlation for healthy geranium plants grown in pots in a greenhouse. Furthermore, the biplot also showed that leaf discoloration was closer to control and T1 treatment (Fig. 7). It had negative correlations with NDVI and leaf discoloration.
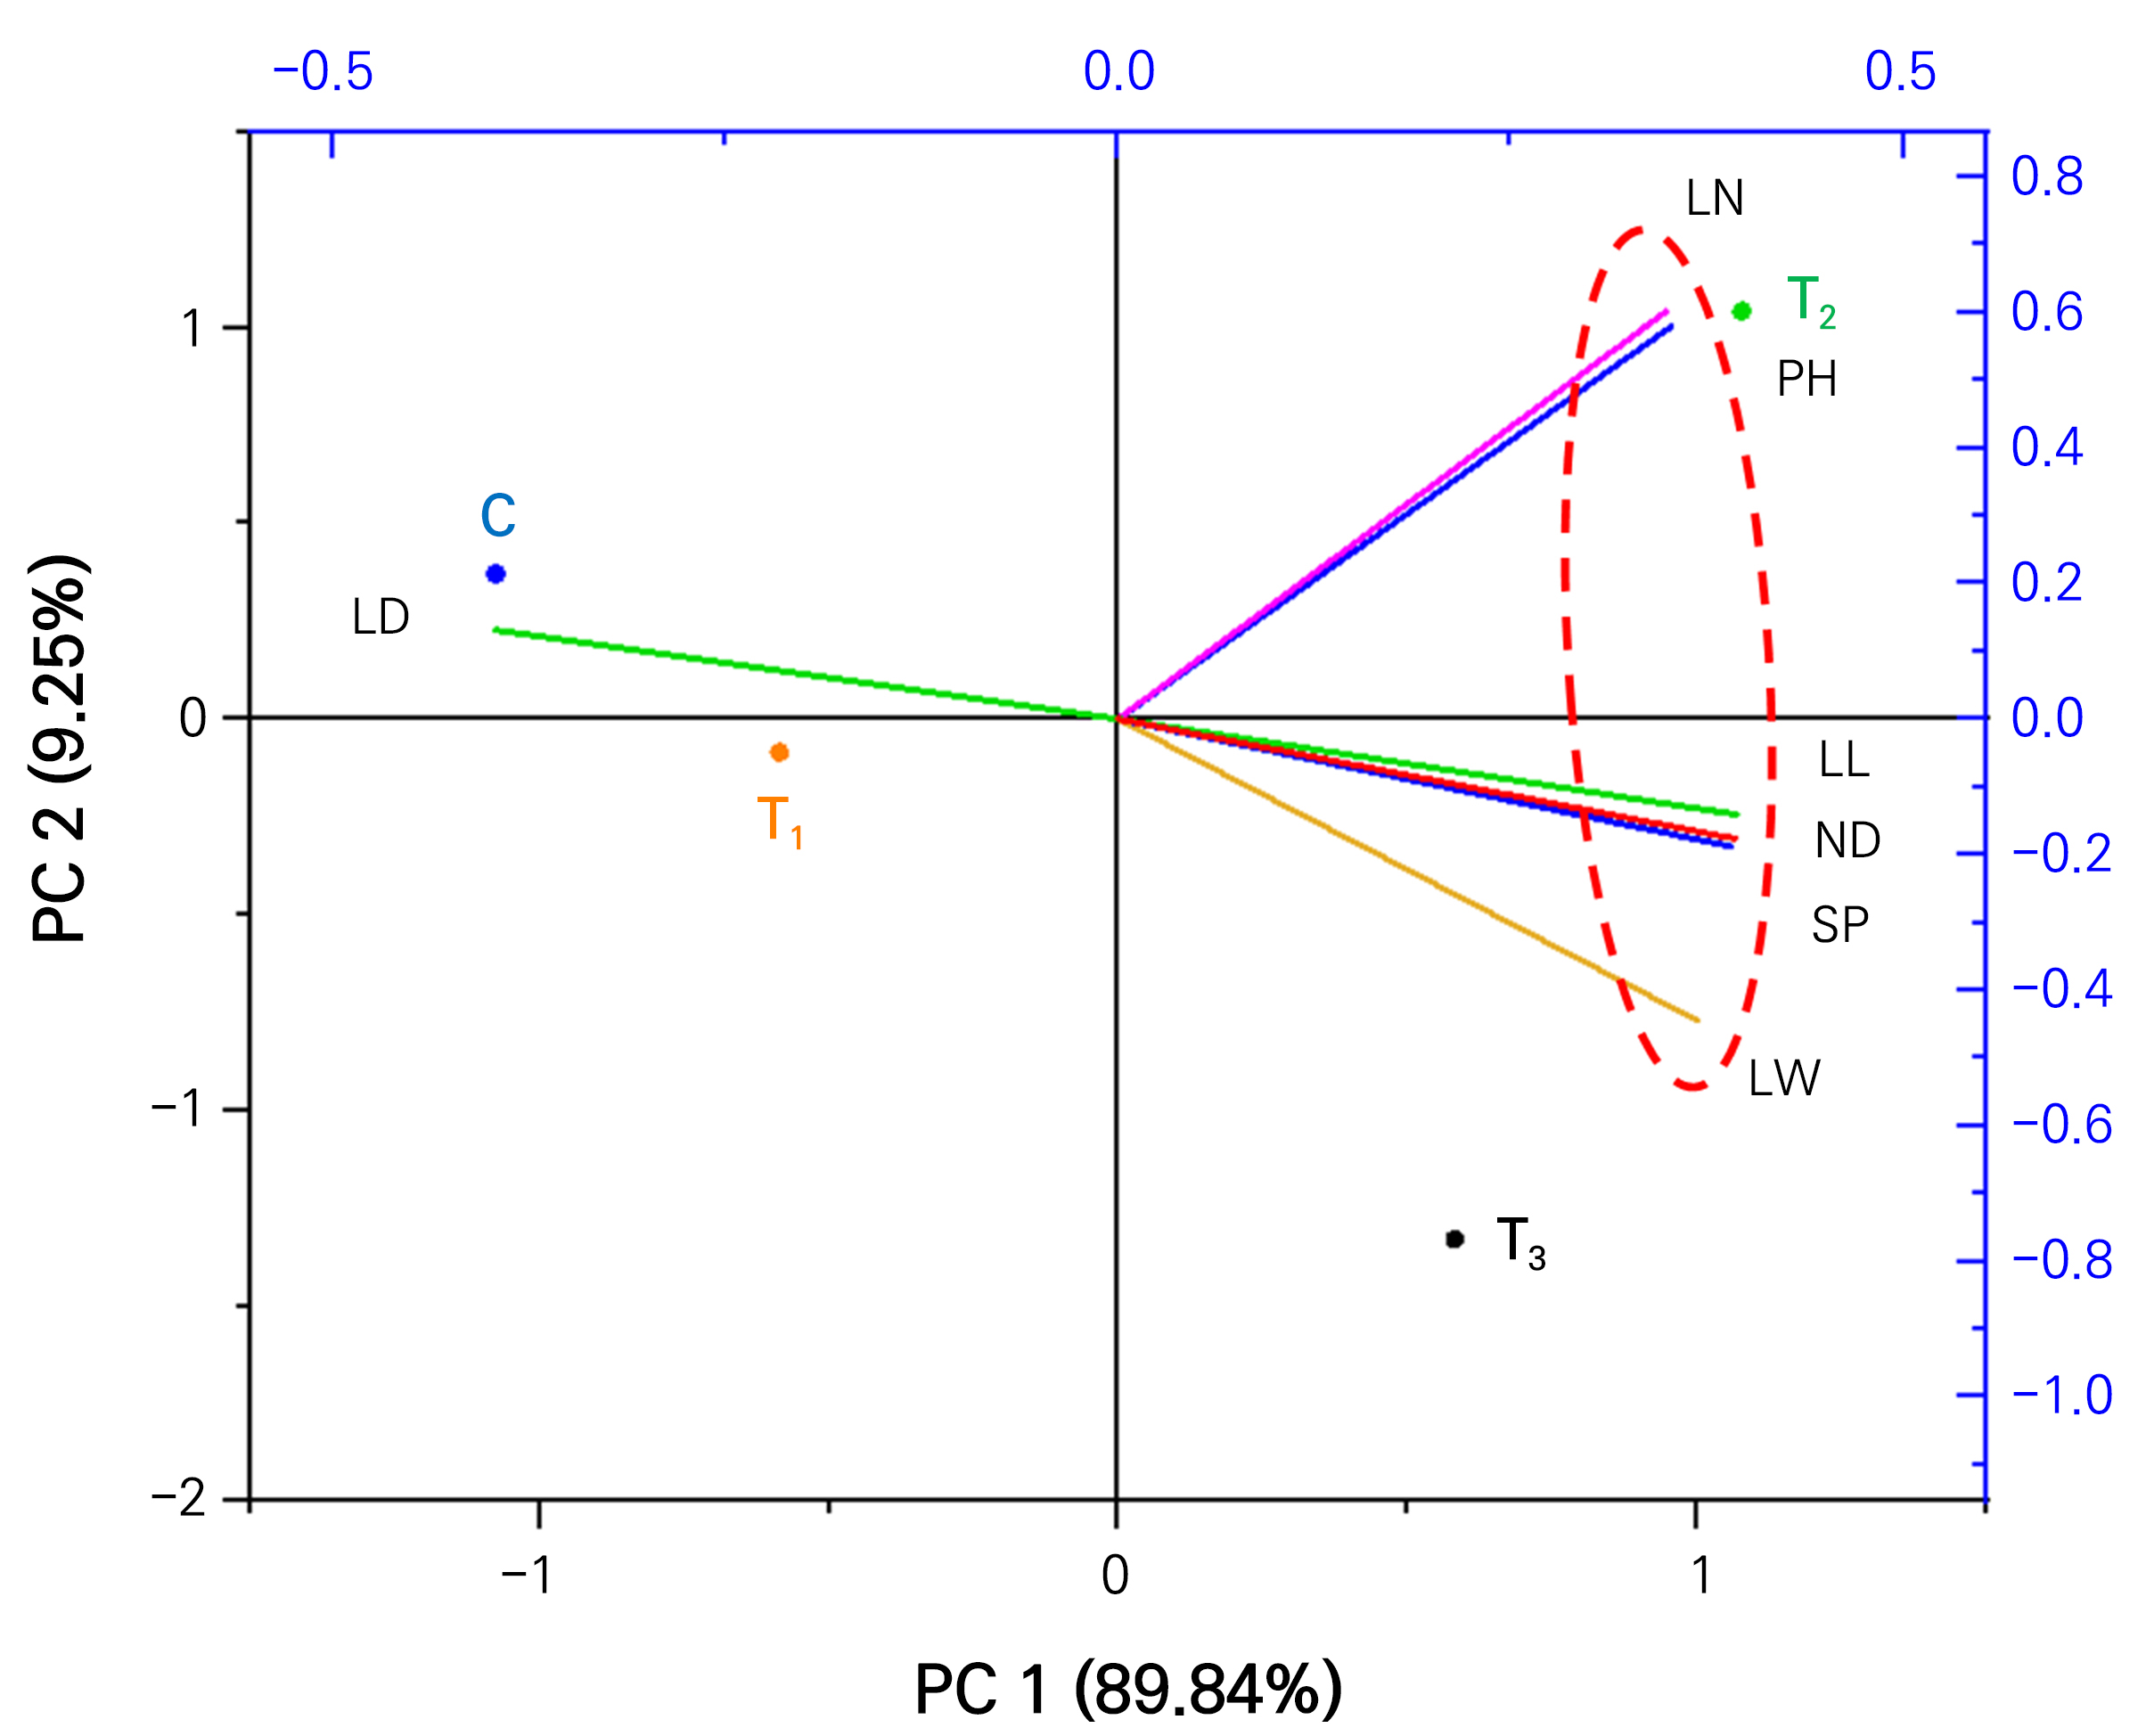
Fig. 7.
Fig. 7. Principal component analysis (PCA) illustrates the variable treatment relationships among the four treatments of geranium at 60 days after treatment in a controlled condition. C, control; T1, KHCO3; T2, KHCO3 + Fe-EDTA; T3, KHCO3 + Fe-EDTA + KH2PO4. The lines starting from the central point of the biplots display the negative or positive associations of the different variables, and their proximity specifies the degree of correlation with specific treatment. LN- number of leaves; PH-plant height; LL-leaf length; LW-leaf width; LD- leaf discolor ness; ND- NDVI and SP-SPAD value.
Conclusions
EC, pH, and nutrient concentrations fluctuated in all treated water. However, based on water quality and growth parameters of geranium, the combination of KHCO3 and Fe-EDTA in T2 treatment showed a better result than other treatments. Furthermore, plant height and the number of leaves showed a positive correlation with each other. The limitation of this study was that fish responses were not investigated. Future research needs to investigate effects of fish and feed density on aquaponic planterior, bioactive compounds of plants, and morphological growth of plants with fish responses.
