

Introduction
Plant Materials
DNA Extraction and ISSR-polymerase Chain Reaction (PCR) Procedure
ISSR Data Analysis
Results
Polymorphism of ISSR Markers and Genetic Diversity Analysis of C. brevistyla
Genetic Structure Analyses
Discussion
Introduction
The genus Camellia is native to South and East Asia, belongs to the family Theaceae, and comprises about 120 large evergreen shrub species worldwide (Ming and Bartholomew, 2007). These species are economically important as a food resource, for ornamental horticulture, and in cosmetics (Vela et al., 2013). Food oil is a historical application of Camellia, and C. oleifera (tea tree oil) was traditionally the key species for such usage. In Taiwan, C. brevistyla is also used by indigenous people for its oil. Previously, the chemical composition of this species was analyzed for seed oils, and remarkably high levels of oleic acid ranging between 70-89 % were found, which is comparable to those in olive oil production (Su et al., 2014). However, utilization of C. brevistyla is limited because this species has not yet been agriculturally developed. Camellia brevistyla trees are only planted in a small area in Taiwan, leading to limited oil production. The economic potential of C. brevistyla oil is remarkably high, and can cost approximately US$100 per liter in the food oil market. Therefore, the development of C. brevistyla genetic identification and germplasm collection and conservation is worthwhile.
Camellia brevistyla is widely distributed in the mountains of Taiwan (Su et al., 2012a). Morphological variations in C. brevistyla are closely related to geographic factors, and our previous study suggested that C. tenuiflora, a morphologically similar species, should be taxonomically merged with C. brevistyla (Su et al., 2012a). Morphological similarities can hinder germplasm identification in these tea trees. In Camellia, Wachira et al. (1995) first applied a randomly amplified polymorphic DNA (RAPD) marker to identify C. sinensis and concluded that DNA markers would be a more effective tool to identify germplasm than morphological traits. Subsequently, several DNA markers such as amplified fragment length polymorphisms (AFLPs) or inter-simple sequence repeats (ISSRs) were used for identifying tea plant clones, and similar views on speciation in tea tree plants were proposed (Paul et al., 1997; Lai et al., 2001; Yao et al., 2008). Among the molecular markers available to detect genetic diversity and variability of germplasm, ISSRs were developed to explore microsatellite repeats without requiring DNA sequencing (Zietkiewicz et al., 1994). The ISSR markers are very stable, dominant, reproducible, and generate a large number of polymorphic fragments (Reddy et al., 2002). Several studies of phylogenetic and genetic diversity based on ISSR markers were performed on Camellia, especially C. sinensis, and found that ISSRs are useful for analyzing genetic diversity within and between populations; thus, they have frequently been used to resolve the genetic relatedness in tree species (Kumar, 2002; Mondal, 2002; Wei et al., 2008; Ji et al., 2011; Wang et al., 2012; Lin et al., 2013; Leonida et al., 2013; Zhou et al., 2015; Chen et al., 2016).
Full-length complementary DNAs (cDNA) of CoFBA genes corresponding to lipid biosynthesis were identified in C. oleifera based on an analysis of its seed transcriptome library (Zeng et al., 2014). The CoFBA gene controls the flux of key intermediates in oil biosynthesis, while the CoSAD gene controls the synthesis of oleic acid, the predominant fatty acid in tea oil. The CoFAD2 gene plays an important role in determining the composition of fatty acids in tea oil (Tan et al., 2008). To date, no information is available on the genetic diversity of C. brevistyla. Since this species is a potential germplasm for the food oil industry, the goals of this study were to investigate its genetic structure and diversity, as well as its relationship among wild populations of C. brevistyla to lay the foundation for developing strategies for genetic improvement. In addition, a scientific database for identifying and examining varieties of C. brevistyla should be developed for doubtful trees. We further analyzed DNA sequences related to the oil content of C. brevistyla using primers for the oil biosynthesis-associated genes CoFAD2, CoSAD, and CoFBA3. To our knowledge, this is the first report to assess the genetic diversity and differentiation of C. brevistyla.
Plant Materials
In total, 102 individuals from 29 populations of C. brevistyla were collected from 11 counties within two geographic regions of Taiwan in 2013 and 2014. The sampling spanned the distribution range of the species throughout the main island of Taiwan and each population was composed of two to nine individuals. The collected populations were unevenly distributed, with 86 individuals in 23 populations from the northern region and 16 individuals in six populations from the southern region. These two regions have significant variation in soils and climate with diverse agro-ecologies:southern regions (22°09´N-22°28´N, 120°43´E-120°45´E, 210-1100 m in elevation), and northern regions (22°29´N-25°11´N, 120-51´E-121°55´E, 260-2110 m in elevation; Fig. 1, Suppl. Table 1s). In each sampling site (population), a random collection of samples was carried out. Population codes, sizes (the number of individuals sampled), and locations of origin for each entry are listed in Suppl. Table 1s. Three C. kissii individuals from one population were used as the outgroup in this study because they are morphologically related to C. brevistyla (Su et al., 2012a).
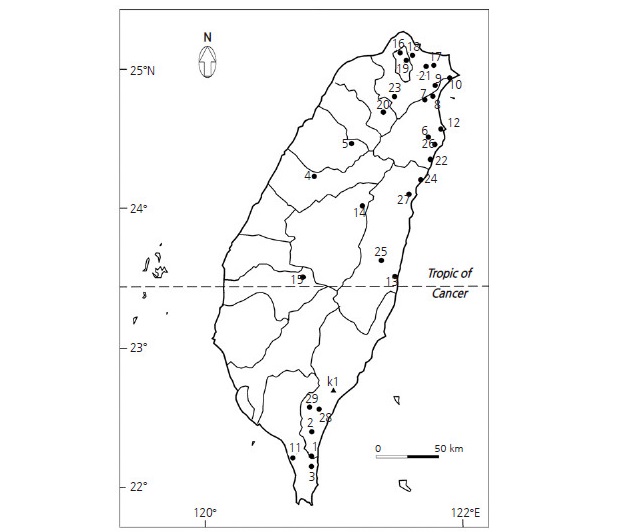
Fig. 1.
Map indicating the collection sites of 102 Camellia brevistyla samples from population 1–29 (labeled with circles) and three samples of C. kissii (labeled with triangles) in Taiwan. Tropic of Cancer separates the collected samples into a northern region with 23 populations (b3-9 and 12-27) and southern region with six populations (b1-3, 10-11, and 28-29).
DNA Extraction and ISSR-polymerase Chain Reaction (PCR) Procedure
Three young leaves were detached from each plant and served as samples that were labeled and stored in sealed bags with silica gel as previously described (Su et al., 2009). We used a modified cetyltrimethylammonium bromide (CTAB) method for DNA extraction following that of Doyle (1991). DNA from approximately 50 mg of dried leaves was extracted. DNA quality was checked on a 1.0 % (w/v) agarose gel, and concentrations were measured on a UV-visible spectrophotometer (GeneQuant Pro, Amersham Biosciences, Cambridge, UK). All DNA samples were diluted to 30 ng µL-1 and stored at -20°C prior to PCR amplification. One hundred ISSR primers (UBC nos. 801- 900, primer set 9) were purchased from the University of British Columbia Biotechnology Laboratory (Vancouver, Canada). From a preliminary screening, 13 ISSR primers (Table 1) that amplified strong, polymorphic bands were selected for further examination. Different annealing temperatures were tested to optimize amplification conditions for the 13 selected primer sets. Each PCR contained 30 ng genomic DNA template, 1 unit Taq DNA polymerase (Gibco-Life Technologies, MA, USA), 200 mM each dATP, dCTP, dGTP, and dTTP, 0.5 µM primer, and a PCR buffer with a final concentration of 2 mM MgCl2, in a final reaction volume of 20 µL. The PCR was performed in an Eppendorf Mastercycler Gradient Thermal Cycler set (Hamburg, Germany) with the following thermal program: initial denaturation at 94°C for 5 min followed by 40 cycles of 94°C for 40 s, 50-60°C (depending on the primers used) for 90 s, and 72°C for 90 s; with a final extension at 72°C for 10 min. Amplified products were separated by electrophoresis on a 2% agarose gels in TBE buffer (90 mM Tris-borate buffer and 1 M EDTA) at 100 V, and visualized with ethidium bromide staining. A 100-bp DNA ladder marker (Takara, Tokyo, Japan) was used for band size estimation. Gels were visualized and recorded by UV light using an image analysis system (Vilber Lourmat, France). Only the most intense and clearest bands were used for ISSR data analysis. Additionally, we used a reference sample, C. kissii (coded k1), as an outlier control (CK).
ISSR Data Analysis
The digital gel images were inverted and the contrast was increased using Microsoft Photo Editor. Bands in the size range of 200-2,000 bp were scored such that only those that were reproducible and could be unambiguously amplified across all individuals were included in the analysis. To estimate the band-scoring error, all gels were scored a second time 2 weeks after the first scoring by the same person (R.D. Kang) without reference to the initial results. The ISSR bands were scored for presence (1) or absence (0) of robust and unambiguous bands, and then transformed into a 0/1 binary character matrix (Suppl. Fig. 1s). In order to identify the proportion of genetic variation among regions, counties, and within populations, a molecular variance analysis (AMOVA) was performed in GENALEX 6.5 (Peakall and Smouse, 2012). The POPGENE software version 3.2 (Yeh et al., 2000) was used to calculate parameters such as Nei’s gene diversity (H), Shannon information index (I), the coefficient of genetic differentiation (Gst), and gene flow (Nm) (Shannon and Weaver, 1949; Nei, 1973). The amount of gene flow among these populations was estimated according to the formula: Nm = (1- Gst) / 4Gst (Slatkin and Barton, 1989). The similarity index (S) was calculated according to the Dice similarity coefficient using Excel VBA. A cluster analysis was performed based on Dice similarity coefficients and the Unweighted Pair-Group Method with Arithmetic mean (UPGMA) generated in NTSYS software version 2.10 (Rohlf, 2000).
Results
Polymorphism of ISSR Markers and Genetic Diversity Analysis of C. brevistyla
After screening 100 ISSR primers, we selected 13 pairs that produced clear and reproducible banding profiles for amplification in all 102 C. brevistyla samples. In total, 176 bands were amplified and 175 bands (99.9%) were found to be polymorphic (Table 1). The primers 827 and 836 generated the highest and lowest number of bands, respectively. Ten to 17 polymorphic bands ranging between 200-1700 bp were produced by each of the 13 primers with an average of 13.46 polymorphic bands for each primer. Furthermore, based on the anchored primers, these 13 primers were divided into two groups, including 3’-end-anchored primers (UBC815-856) and no-end-anchored primers (UBC864-881).
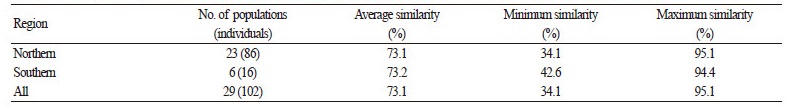
The average genetic similarities of C. brevistyla populations within the northern and southern regions were 73.1% and 73.2 %, respectively (Table 2). Genetic similarity ranged between 34.1-95.1 % for all 102 samples from 29 populations, with an average of 73.1%, indicating that high genetic variation in C. brevistyla exists in the two geographic regions. This variation reflects a large spatial separation between C. brevistyla populations in Taiwan. Based on ISSR marker estimates, the overall Nei’s genetic diversity value (H) was 0.323, whereas those for the northern and southern regions were 0.317 and 0.262, respectively (Table 3). The overall Shannon’s diversity index (I) was 0.485, and the highest and lowest I values were observed in Hualien (0.443) and Chiayi (0.088) in the northern region, respectively. The lowest I value detected was due to only three individuals being sampled. Coefficients of genetic differentiation (Gst) in the northern and southern regions were 0.495 and 0.482, respectively. The overall Gst value (0.534) in our study was higher than that of general wind-pollinated plant species (0.143) from Hamrick et al. (1992). The Nm values were < 1.00 in northern (0.538) and southern (0.436) regions, indicating limited gene flow between these two regions.
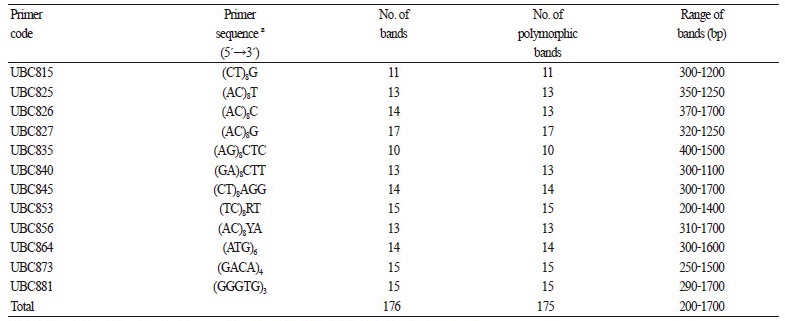
Table 2. Genetic similarity of Camellia brevistyla populations (individuals) collected from two geographic regions in Taiwan
 |
Genetic Structure Analyses
A phylogenic tree was constructed based on genetic similarity coefficients that ranged between 0.47-0.96; the 102 individual samples were separated into eight distinct groups between 0.55 and 0.67 (Fig. 2). Three samples of C. kissii (K) were isolated in an outgroup (group VIII). Group V included the two populations b28 and b29 from the southeastern region, while group VI included the populations b4 and b5 from the north-central region. Group VII was composed of six C. brevistyla (coded b) populations and was further divided into two subgroups:one that included samples from the southern region (b1-b3 and b11) and one including the north-central region (b14 and b15). Group VII was a mixture of populations from widely ranging geographical regions, indicating that populations that were highly genetically related were distributed within different regions. The six populations b6-b10, and b22 from the northeastern region clustered in group III. In addition, group II also contained five closely clustered populations, b6 and b16-b19 of C. brevistyla at the top of the northern region. It is noteworthy that individuals form b6 belong to groups II and III. The two populations b12 and b13 in eastern Taiwan comprised group IV but were distinctly distributed. The remaining seven populations b20, b21, and b23-b27 from the northern and eastern regions formed group I.
AMOVA results for the 102 C. brevistyla samples showed significant differences in genetic variation among regions, among counties (i.e. among populations), and within populations (Table 4). The majority of the genetic variation was concentrated within populations (75%), indicating that there was abundant genetic diversity in each population. Variation among counties (18%) was larger than that among regions (7%), which suggested that there is significant genetic differentiation among geographical regions.
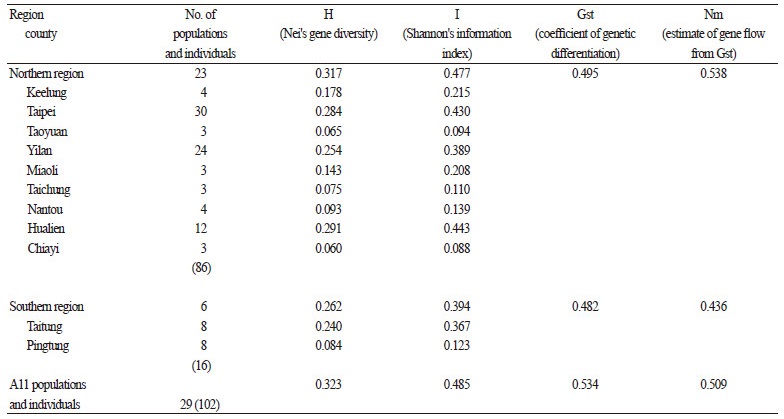
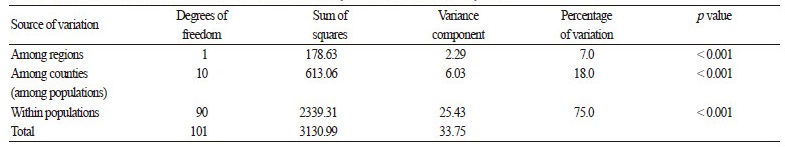
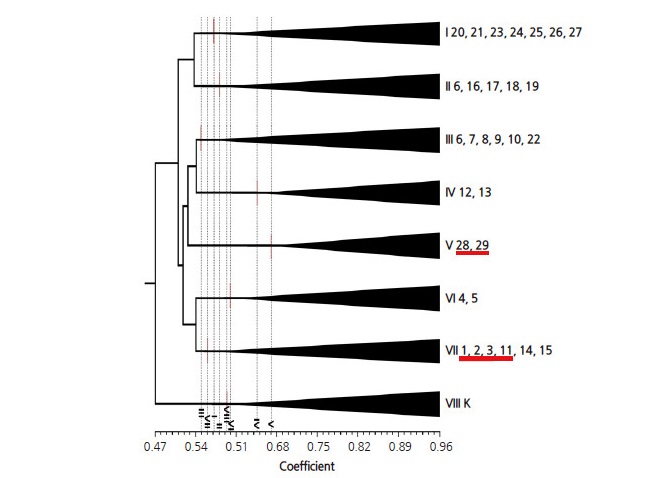
Fig. 2.
Cluster analysis using a UPGMA dendogram of genetic similarity based on 175 ISSR markers for 102 Camellia brevistyla samples (populations b1-29) and three C. kissii samples (outgroup K). Underlined populations in groups V (b 28, b29) and VII (b1-3, b11) are from the southern region, and the rest are from the northern region.
Discussion
In this study, ISSR DNA markers were used to evaluate the genetic diversity from a collection of C. brevistyla natural populations from two different regions of Taiwan. A mean value of 13.46 polymorphic bands per primer and 99.9% polymorphism revealed a relatively high level of genetic diversity in these populations. The results suggest that ISSR markers are suitable for detecting the genetic variability within C. brevistyla and can be used as effective markers for germplasm identification. The high percentage of polymorphism observed in the ISSR markers was also reported by Lin et al. (2013), who analyzed 390 C. japonica individuals based on 20 ISSR primers that had a total of 211 discernible fragments (90.1% polymorphism) with an average of 10.55 polymorphic bands per primer. Moreover, Ji et al. (2011) analyzed 181 plants of C. sinensis that represented 10 ancient populations using 19 ISSR primers and obtained a total of 155 reproducible bands with 80.1 % polymorphism, which was an average of 8.2 polymorphic bands per primer. Table 1 also reveals that differences in the number of anchors contributed to differences in marker amplification. Among the 3’-end-anchored primer types, only amplified bands with CT, AC, AG, GA, and TC motifs were detected, indicating that SSRs with these five dinucleotide repeats are abundant in the C. brevistyla genome. There were more CT-, AC-, AG-, GA-, and TC-binding sites in the region than could be amplified with SRR markers. Meanwhile, GT, CA, TG, AT, TA, GC, and CG motifs did not amplify stable clear bands in this study, probably because A/T and C/G dinucleotides are self-complementary within the primers (Yao et al., 2008). In addition, no trinucleotide or tetranucleotide motifs were successfully amplified with anchored primers in this study, suggesting that SSRs with long repeats are less frequent in the genome, and that SSRs might not be evenly distributed in the C. brevistyla genome. The ISSR information for both anchor and motif types showed that the frequencies and polymorphisms of different SSR motifs could be useful in developing new microsatellite markers for C. brevistyla.
The spatial apportionment of genetic variation in C. brevistyla within different populations was 75% (Table 4), which was higher than 60.3% and 73.17% reported for C. sinensis (Ji et al., 2011) and C. japonica (Lin et al., 2013) populations, respectively. Moreover, the genetic variation within populations was also higher than that among populations. Several factors, such as the geographic distribution, reproductive system, and dispersal patterns can influence the level of the genetic structure of plant populations, and outcrossing maintains most of the genetic variation within rather than among populations (Zhou et al., 2008). There is no report on the reproductive system of C. brevistyla; however, the populations analyzed in our study showed high genetic variability with an overall genetic diversity (H) of 0.323, a coefficient of genetic differentiation (Gst) of 0.543, and a Shannon information index (I) of 0.485, which were consistent with those expected for outcrossing species (Hamrick and Godt, 1996). In addition, outcrossing between populations might occur in C. brevistyla because the key pollinators of Camellia plants are bees (Su et al., 2012b), which can serve as long-distance pollinators. In addition, the widely distributed C. brevistyla is also expected to have greater genetic variation because species with wider distributions tend to be more genetically diverse (Wang and Ruan, 2012). Previously, the taxonomic clarity of C. brevistyla was addressed and the patterns of morphological variations of C. brevistyla throughout their geographic ranges and locations in Taiwan were also characterized (Su et al., 2012a). Seed dispersal determines a plant’s reproductive success, range expansion, and population genetic structures (Wang et al., 2004). Abe et al. (2006) reported that Camellia japonica is a zoochorous species dispersed by Apodemus speciosus; this seed dispersal would contribute to a range expansion of C. japonica and increase genetic structure. Although no study shown dispersal of C. brevistyla seeds by rodents, the Nm values of plants in the southern and northern regions of Taiwan show the existence of gene flow barriers between regions, presumably because of the dispersed distribution of C. brevistyla by rodents.
All 175 polymorphic markers could be used to obtain a more representative evaluation of genetic diversity in C. brevistyla. Noticeable differences in population numbers were collected from the two regions, where northern and southern regions contained 23 and six populations, respectively. The relationship between clustering and geographic region was highly significant. Notably, northern populations were separated in groups I-IV and VI, while southern populations were distributed in groups V and VII. However, both northern and southern populations were comprised group VII with a genetic similarity coefficient of 0.56, indicating that populations b14 and b15 from the southernmost part of the northern region (Fig. 1) might still have genetic flow with southern populations. The highest similarity (0.67) among all groups was group V, which was a geographically southern element but genetically differed from other southern populations. The lowest genetic similarity (0.47) was found between the outgroup K (C. kissii) and C. brevistyla b14, which was collected from Nantou County in the top north-central region, indicating a genetically distant relationship or reproductive isolation between the two taxa. These results show that there are clearly correlations between the genetic variation and geographical locations of C. brevistyla populations from southern and northern Taiwan, which agrees with the results of morphological traits in C. brevistyla (Su et al., 2012a). The morphological characters traditionally used to distinguish C. brevistyla and C. tenuiflora from one another include leaf shape, leaf apex shape, secondary vein prominence, style number, and style length. Based on leaf characters, the populations b7, 8, 9, 16, 18, 20, and 23 could be also identified as C. tenuiflora; however, the ISSR analyses showed that samples of C. brevistyla and C. tenuiflora were mixed in groups I, II, and III (Fig. 2). Therefore, the present molecular study supports the taxonomic treatment of C. tenuiflora as a synonym of Camellia brevistyla, and they should be combined as the same species.
High genetic variation in C. brevistyla could serve as a basis for germplasm conservation. Moreover, the percentage variation between the northern and southern regions of Taiwan was 7%, indicating spatial isolation of genetic exchange between the regions. Therefore, different regions may present independent cultivation zones of C. brevistyla due to positive conservation or breeding programs. Moreover, while selecting genotypes from a particular cluster, the cluster distance should be taken into consideration for crossing populations to increase the genetic variability and desirable recombination (Beyene, 2013). Breeders could use genotypes that are the most disparate with wider genetic distance between each other as a strategy to maximize heterosis; thus, we recommend that crosses should make use of genotypes or groups of genotypes with high genetic distances. Understanding and maintaining genetic variation within and among populations is essential to formulate appropriate conservation measures (Francisco-Ortega et al., 2000; Liu et al., 2015). The major aim of biodiversity conservation is to preserve species through maintaining as much genetic diversity as possible. With such consideration, the high genetic variation of C. brevistyla highlights the difficulty of conserving genetic diversity in gardens. Thus, we suggest that all Taiwanese C. brevistyla populations be protected in situ.
Genetic differentiation may be enhanced by selecting and propagating desirable populations with obvious agronomic characteristics. Fructose-1,6-bisphosphate aldolase (FBA) hydrolyzes fructose-1,6-bisphosphate into dihydroxyacetone phosphate and glyceraldehyde 3-phosphate, two critical metabolites for oil biosynthesis. Plant stearoyl-ACP desaturase (SAD) is the enzyme that controls the first-step desaturation during the biosynthesis of plant unsaturated fatty acids and therefore, directly regulates the proportion of saturated and unsaturated fatty acids by dehydrogenating saturated fatty acids bonded to the acyl carrier protein (ACP) to form oleic acids (Zhang et al., 2008). In the study, deduced FAD2, SAD, and FBA3 gene sequences from seven groups of C. brevistyla were aligned and compared with C. oleifera. Nucleotide sequences of the isolated primers proved to be the most similar to FAD2 and SAD genes in other plants (Suppl. Fig. 2s). These genes from C. brevistyla and C. oleifera are highly conserved, suggesting that the domestication of Camellia substantially affected the evolution of oil-content genes in these plants and could be unique to C. brevistyla. The diversity of oil-content genes is probably an adaptive function to counteract the rapid evolution of plants. As inferred from their DNA sequences, C. brevistyla and C. oleifera did not show a violation of plant taxonomy, and the morphology and developmental regulations of these woody species are diverse. Further work will be needed to confirm whether high oil content and fatty acid composition of C. brevistyla can lead to the enrichment of transcripts of the FAD2 and SAD genes for increasing oil biosynthesis.
In conclusion, ISSR DNA markers were used to evaluate genetic diversity and phylogenetic relationships of native C. brevistyla populations. Populations from southern and northern Taiwan were clearly separated into seven different groups, except for one group that included populations from both regions. AMOVA results revealed that genetic variation was high within populations and low among populations and regions. The results of this study should be useful for collecting, managing, utilizing, and improving C. brevistyla germplasm.
