

Introduction
Materials and Methods
System configurations
Greenhouse energy model
Heat-pump performance estimation
Results
Discussion
Introduction
Driven by the rapid growth of digital services, especially compute-intensive AI workloads, new data centers are being built at an accelerating pace, concentrating large and continuous thermal loads across many regions (IEA 2024; Masanet et al. 2024). Data centers require dedicated cooling to remove sensible heat generated by IT equipment. In conventional chiller-based systems, chilled water at roughly 5–10°C is supplied to data center air handlers or liquid-cooling loops, typically returning at approximately 15°C after absorbing heat from the servers (Yuan et al. 2023). The cooling system consumes electricity to produce local cooling while continuously expelling low-grade waste heat into the surrounding area (Wang et al. 2025). To restore the supply temperature, the chiller rejects to the ambient environment a heat load equal to the sum of the cooling duty and electrical energy consumed by the compressors and auxiliary equipment. This rejected heat contributes directly to local thermal loads and indirectly to environmental burdens via the electricity required (Cengel and Boles 2002). Capturing and reusing this otherwise wasted energy for nearby end uses is, therefore, a logical pathway to improve the overall system efficiency (Du et al. 2024).
Among potential sinks, greenhouses represent a particularly promising application, as heating constitutes a major operational burden in temperate and cold climates, often amounting to several hundred kWh m-2 yr-1, even in modern facilities (Muñoz-Liesa et al. 2022). The recent growth in air-source heat pump adoption has been strongly driven by policy-based incentives and deployment programs, including capital subsidies, low-interest financing, and tariff or tax incentives that lower the economic barrier for end users (Sun et al. 2022; Corbett et al. 2023; Rao et al. 2025; Zhou et al. 2025). However, the performance capabilities of ASHPs deteriorate in cold weather as the evaporating temperature decreases, and during severe cold spells, frost formation on outdoor coils triggers frequent defrost cycles and causes abrupt efficiency losses (Baglivo et al. 2023; Masiukiewicz et al. 2025). These characteristics result in higher electricity consumption and reduced reliability when heating demand peaks.
Thus, coupling greenhouses with data center waste heat offers a practical alternative (ÉTS Montréal 2022; Chen et al. 2024). When the heat-pump evaporator draws from the warm return loop of a data center rather than from ambient air, the system avoids frost formation, stabilizes winter source conditions, and increases the effective source temperature; the corresponding reduction in temperature lift improves the coefficient of performance (COP) (Yuan et al. 2025). In addition, extracting heat upstream of a chiller can modestly lower the chiller inlet temperature and enhance plant efficiency, facilitating mutually beneficial interaction between the source facility and agricultural load.
Building on these insights, this study quantifies the COP gains and associated reduction in electricity use when a greenhouse is supplied with a data-center-coupled water-to-water heat pump (DCHP) relative to a conventional air-source heat pump (ASHP) under identical supply temperature requirements. We developed a Python-based, year-long simulation to evaluate the greenhouse energy balance while accounting for heat transfer through conduction, convection, and ventilation. The model computed the hourly indoor temperature, heating load, and heat-pump performance using typical meteorological year (TMY) weather data. Beyond headline performance comparisons, this study identifies key design factors influencing seasonal outcomes—here the factors of data center energy use, greenhouse energy reduction, and COP enhancement of the DCHP system—and discusses their implications with regard to robust cold-season operation.
Materials and Methods
We performed a dynamic energy simulation in Python to capture the seasonal and diurnal variability in cooling demand. Meteorological inputs were obtained from the TMY3 dataset, in this case the global horizontal irradiance (GHI) and ambient air temperature (). These data provide hourly boundary conditions for the greenhouse energy balance and serve as inputs for estimating the COP of the heat pump.
System configurations
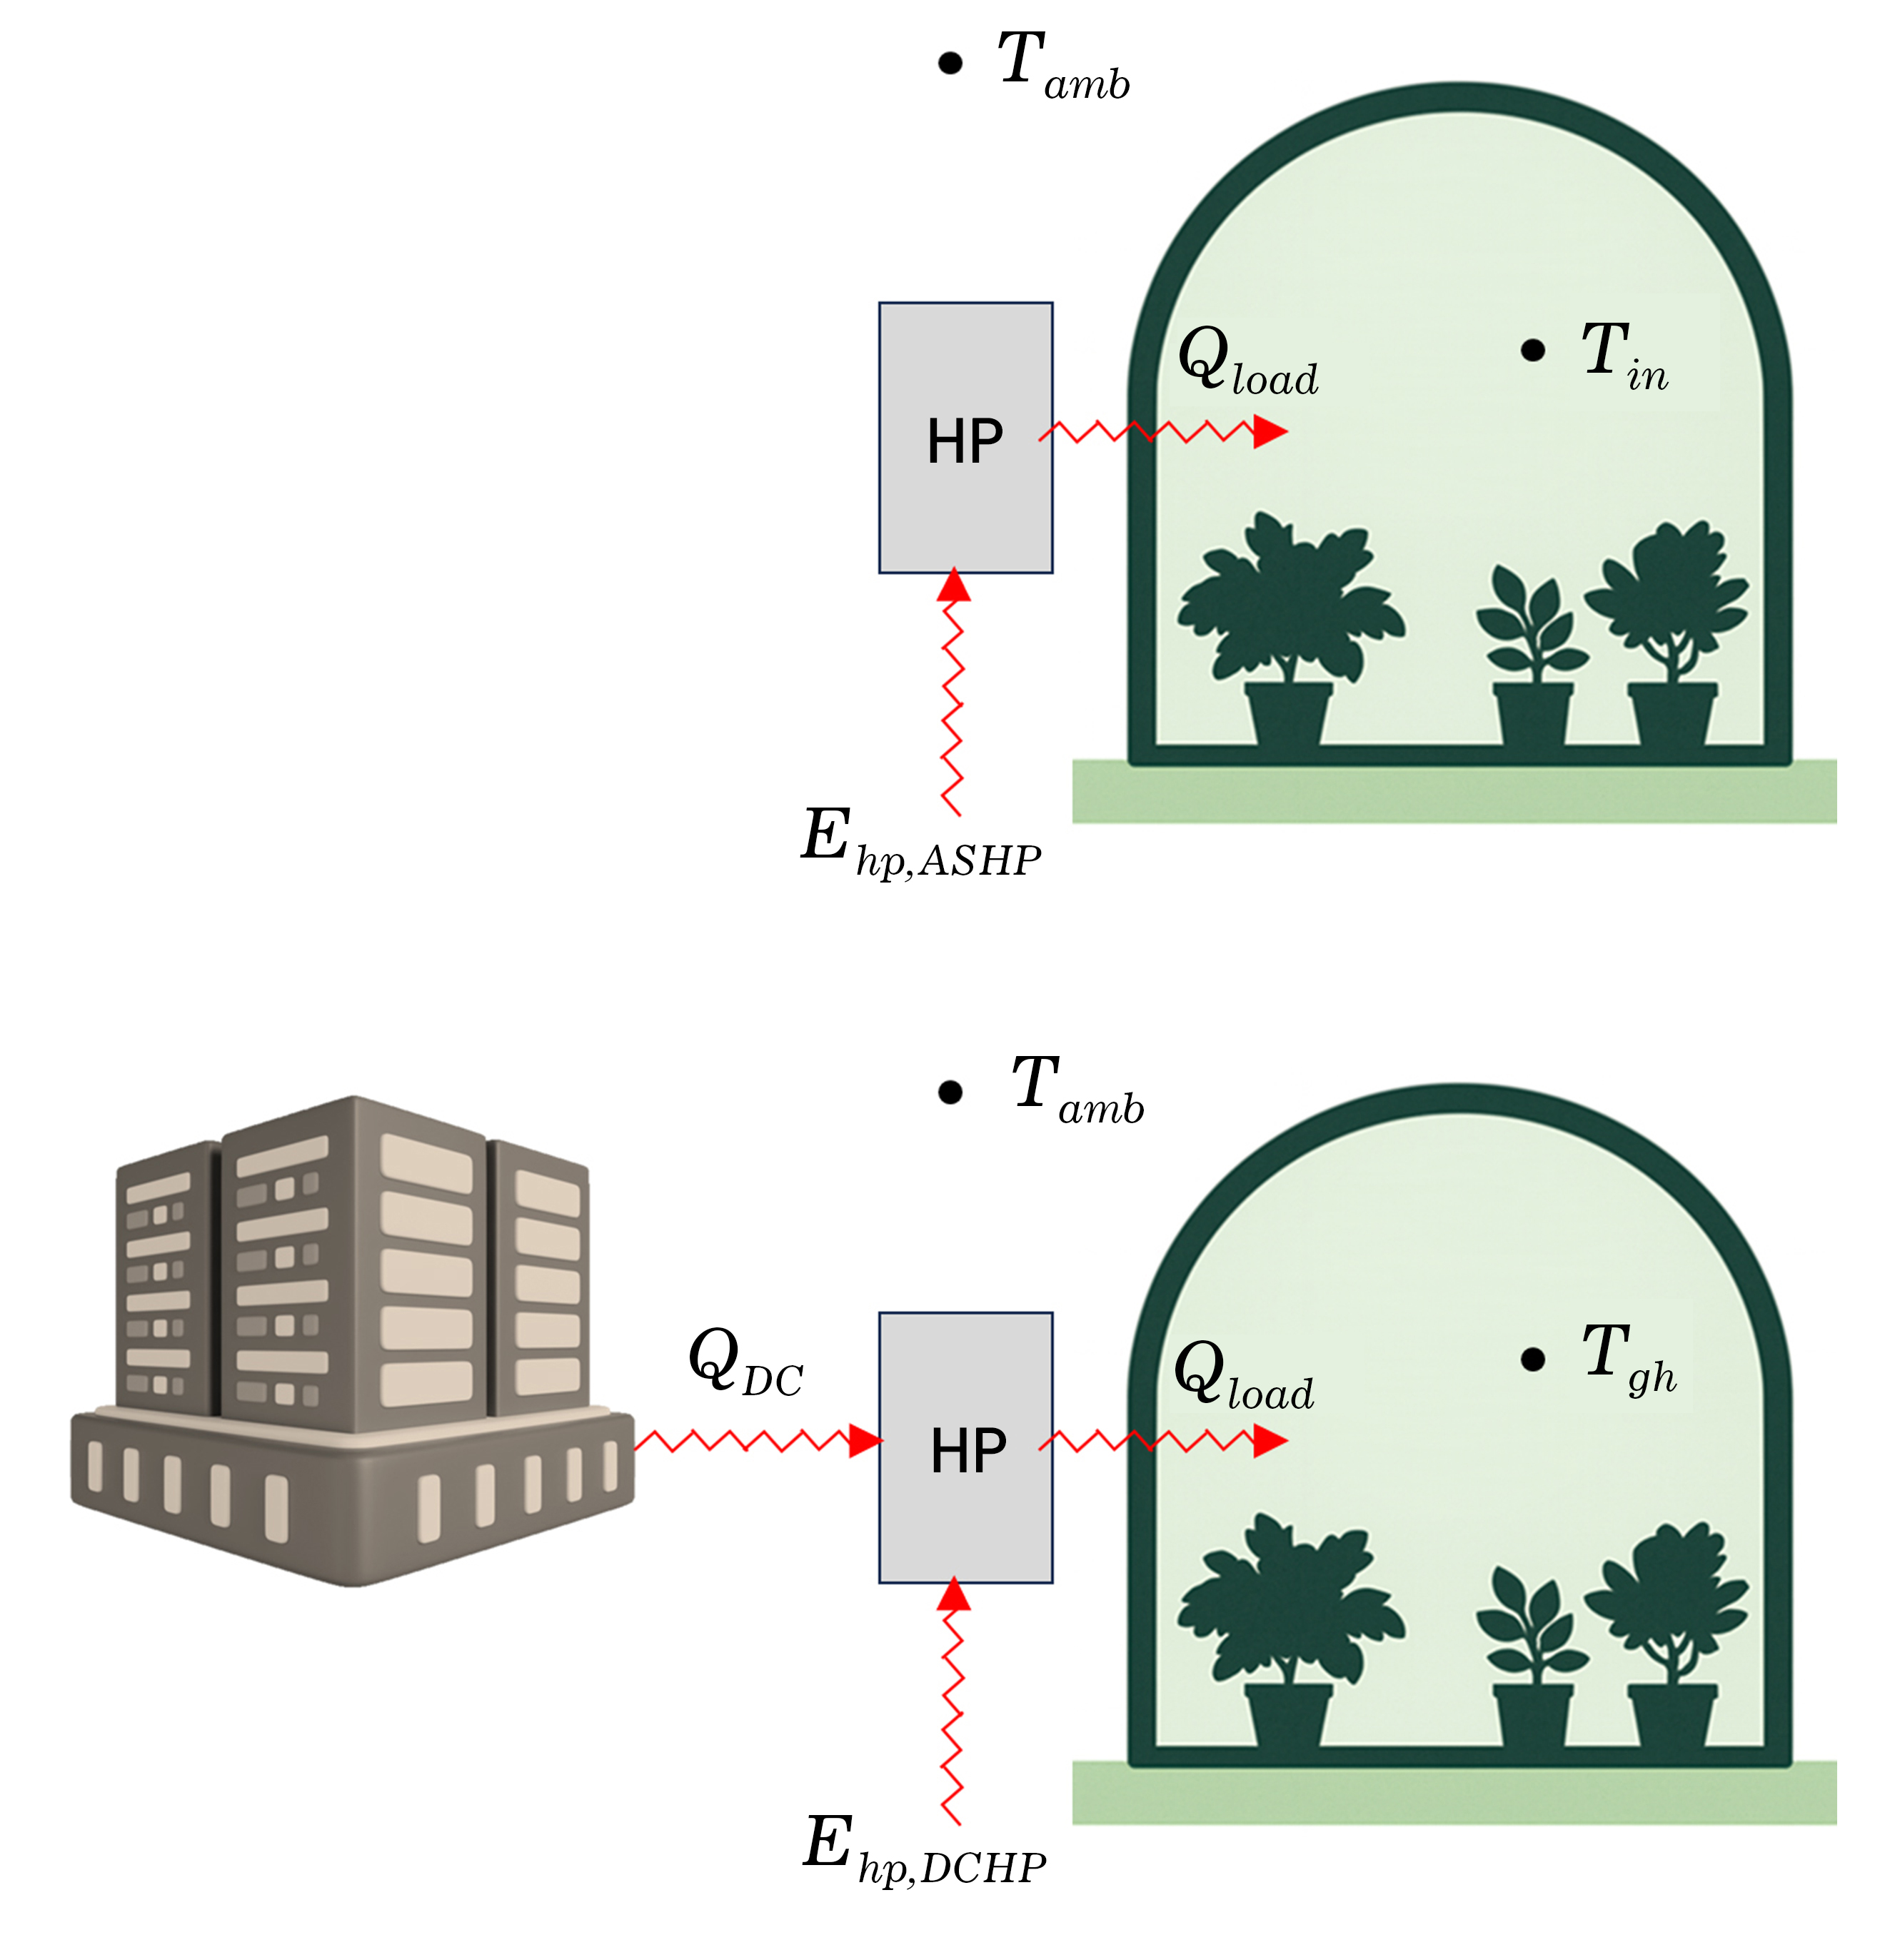
The two heating architectures were compared under identical greenhouse setpoints and structural/operational assumptions as shown in Fig. 1. Case studies considered a single-span strawberry greenhouse (8 m wide × 70 m long) constructed using polyethylene (PE) film and equipped with a thermal curtain. The overall heat transfer coefficient (U-value) of the envelope was assumed to be constant at 3.0 W m-2 K-1. The greenhouse heating setpoint was maintained at 8°C (Massa et al. 2015; Sim et al. 2020); heating was activated whenever the indoor temperature dropped below this threshold. The baseline system was an ASHP that extracts heat directly from the ambient air and delivers hot water to the greenhouse heating loop. Its performance varies hourly according to the outdoor air temperature. In contrast, the proposed DCHP draws heat from the warm return water of a nearby data center, where an infinite heat source is available. The heat-source temperature for the DCHP was fixed at 15°C, representing the steady cooling-water return temperature typically available from a data center facility. Both systems supplied the same hot water circuit of the greenhouse at the prescribed supply temperature . No thermal storage tank was included, and the heat pumps operated only when heating demand arose, assuming that all extracted heat was directly transferred to the greenhouse air through the heating network.
Greenhouse energy model
The greenhouse air temperature was advanced over time by a transient energy balance that accounted for the transmitted solar gains (), overall convection through the side wall () and roof (), ventilation/infiltration (), and heat transfer to the ground () (Yoon and Jeon 2024), as shown in Fig. 2.
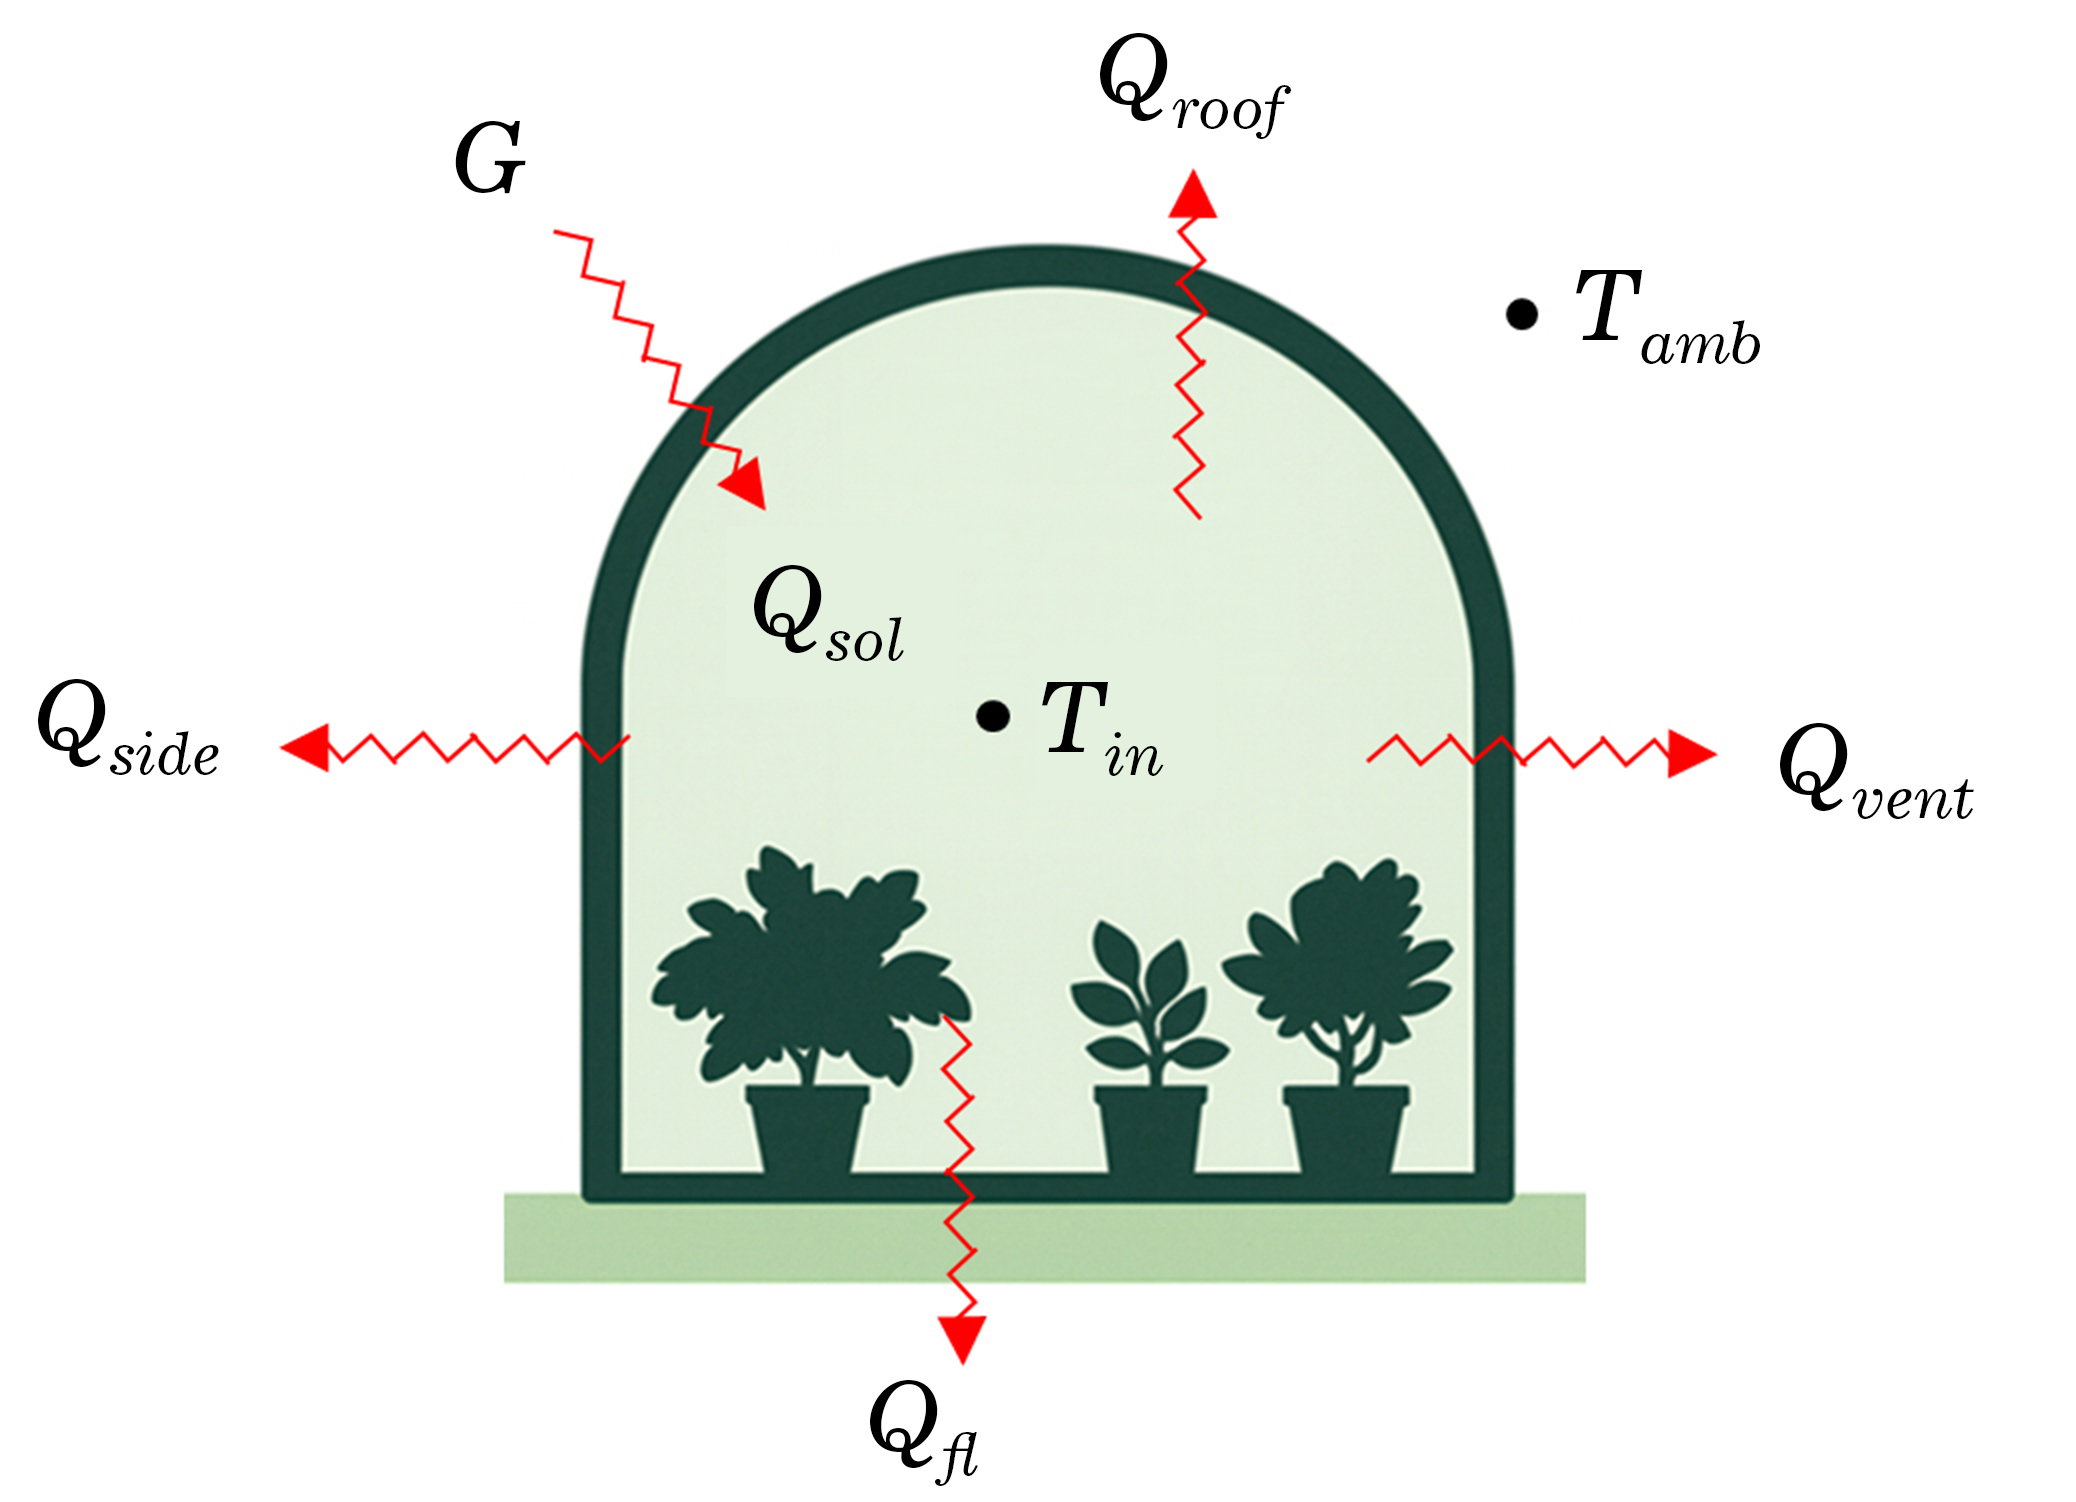
Table 1.
Nomenclature and units used in this study
Here, is the effective thermal capacitance of the air and greenhouse structure, and (), where 𝜏 is the broadband solar transmittance, G is the global irradiance incident on the greenhouse, and is the horizontal area of the greenhouse. ()represents the heat transfer through the side wall of the greenhouse, and it can be obtained by multiplying (the overall heat transfer coefficient of the greenhouse), (the envelop area of greenhouse), and (the temperature difference between the inside and outside of the greenhouse). Heat transfer through the roof was calculated using the same equation but with a different area .
The heat transfer through ventilation () represents the heat transfer by ventilation, and this value was obtained using the parameters (Air change per hour), , and . Finally, heat transfer through the ground () was obtained with multiplying , , and (the temperature difference between the inside and the floor). The ground temperature was assumed to be constant when calculating the ground heat flux . This simplification is supported by previous observations that the ground temperature commonly remains near 10°C (Zhang et al., 2020) during nighttime and in winter conditions, justifying the use of a fixed value for model stability and clarity. The outdoor boundary conditions were provided by a TMY file (hourly outdoor temperature, wind speed, and global horizontal irradiance). When the internal temperature of the greenhouse remained below the setpoint, the heating system operated and supplied heat to the greenhouse under the setpoint was reached. Table 1 summarizes the parameters and the corresponding units used in this study.
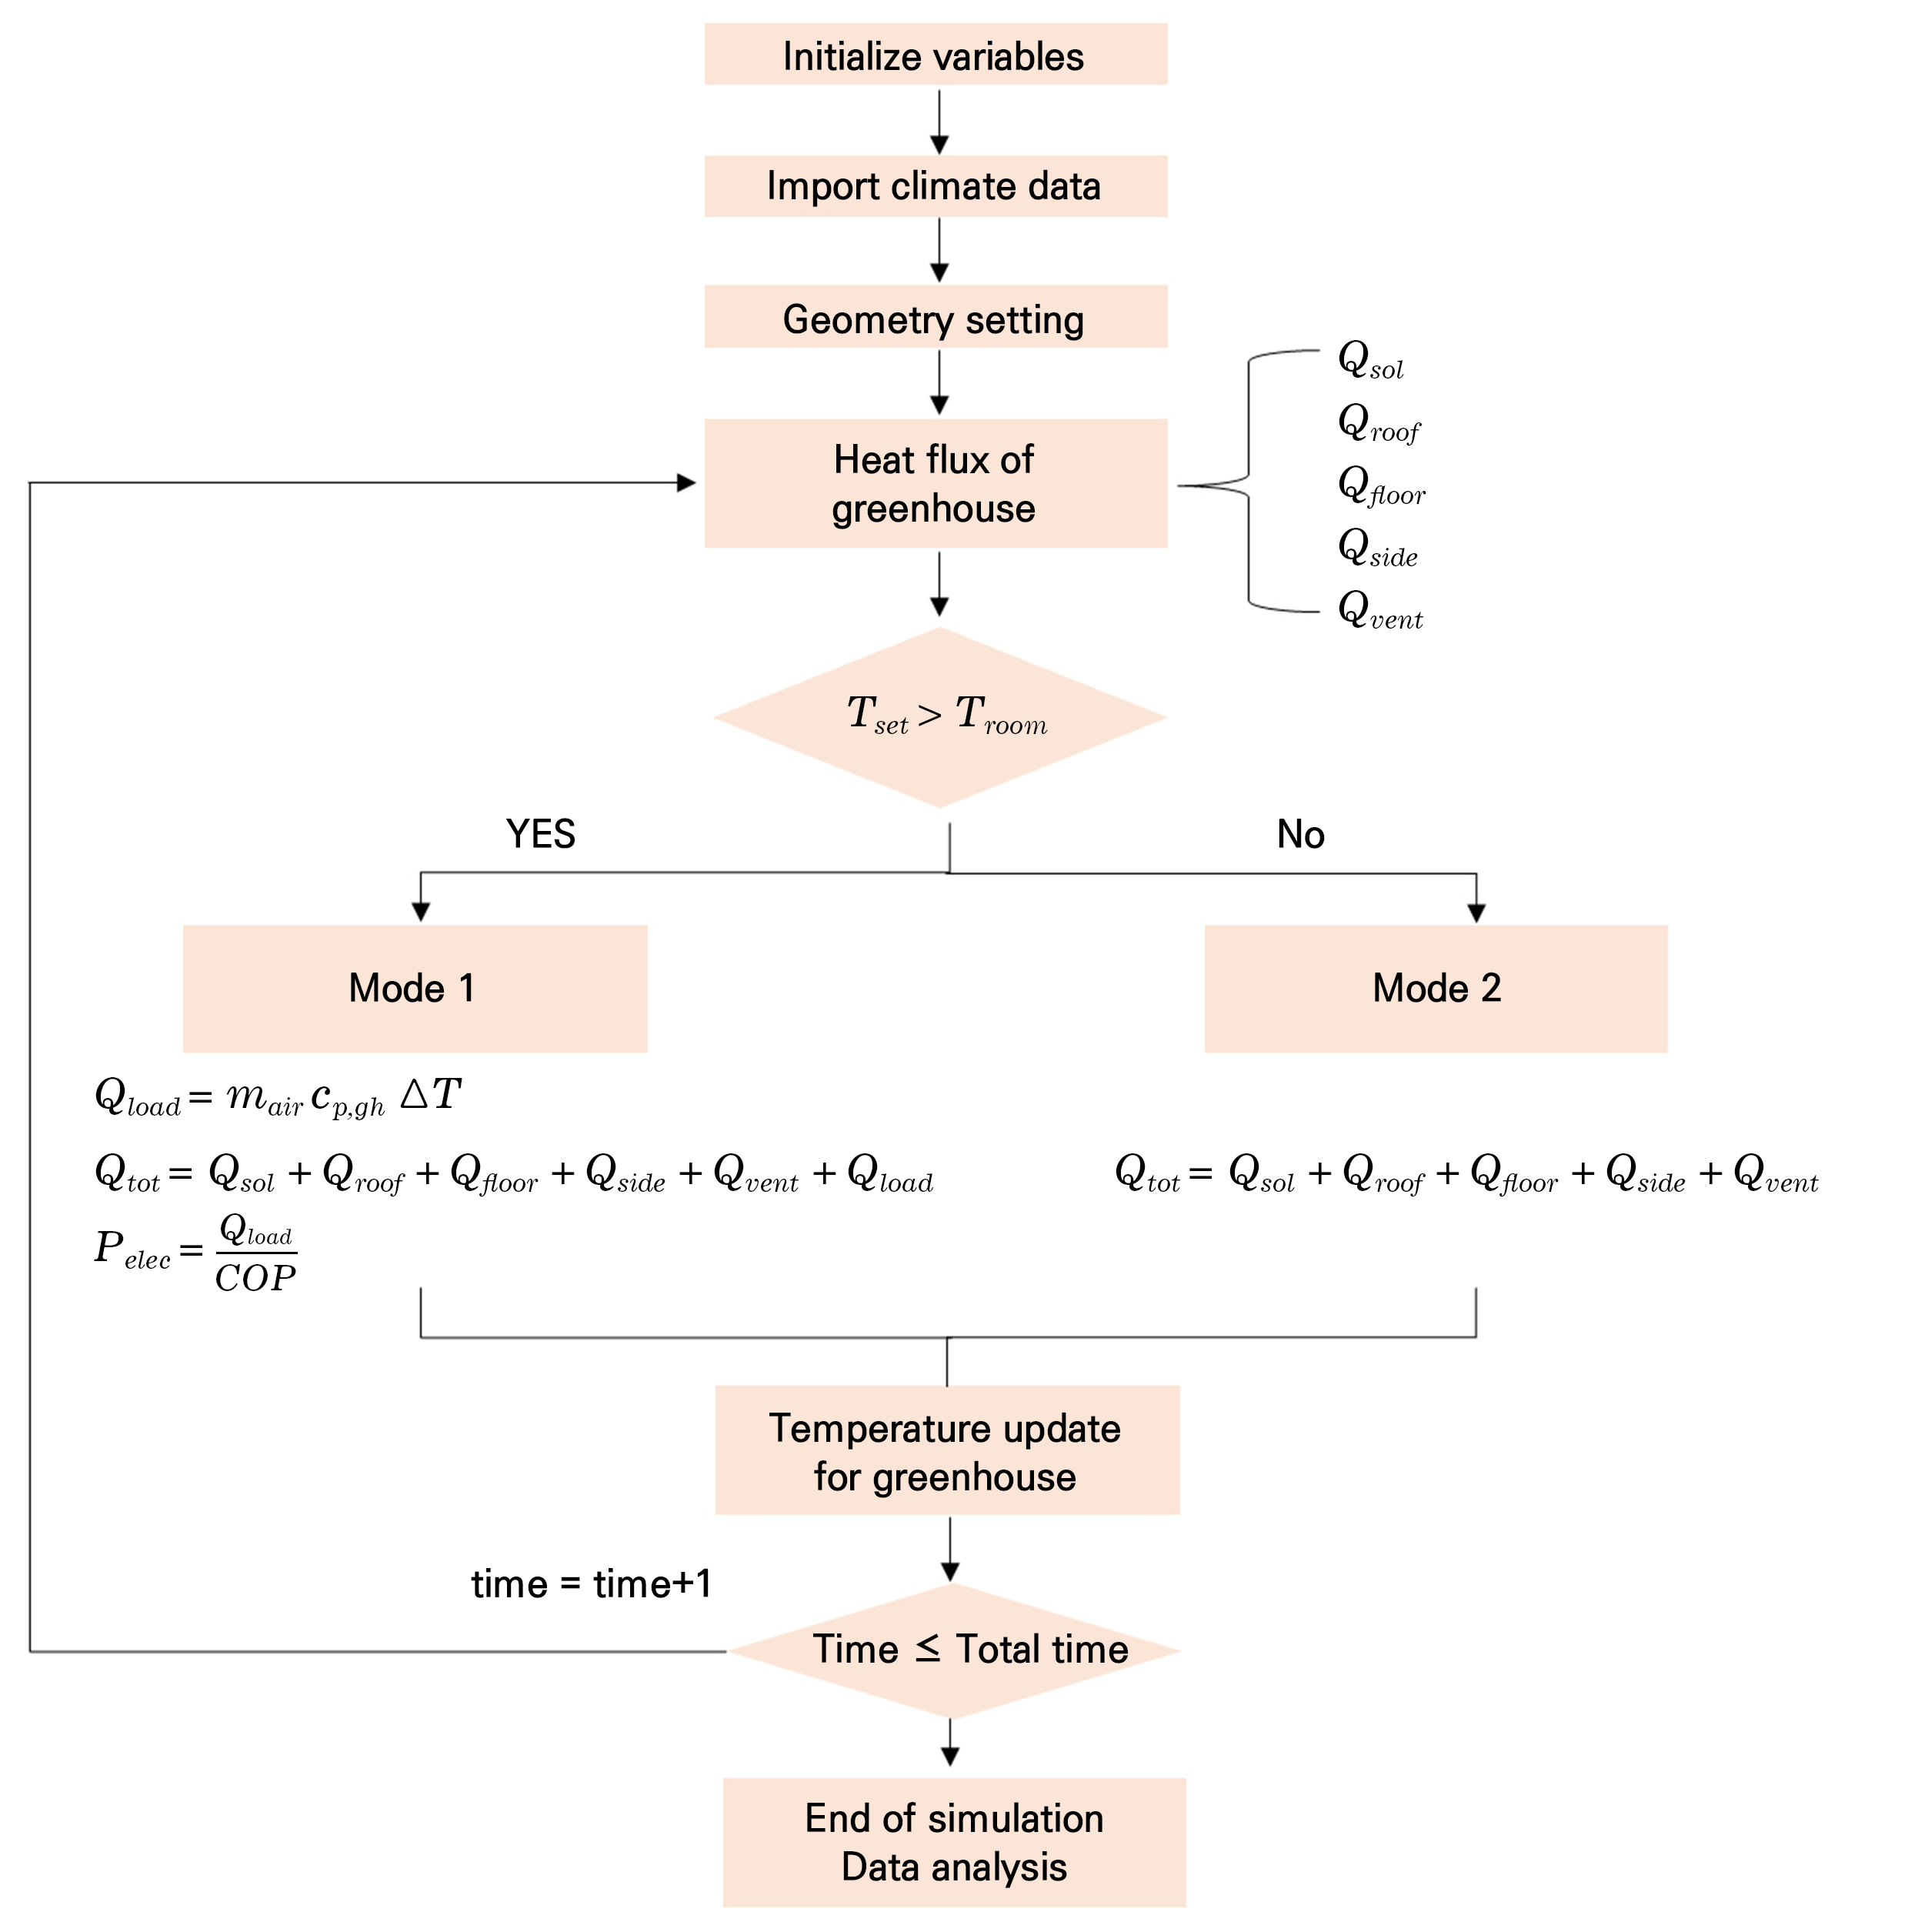
As shown in Fig. 3, a time-resolved pipeline predicts the greenhouse indoor temperature, determines the thermal load, and evaluates the performance outcomes of alternative heat-supply configurations under identical sink conditions. At each time step (Δt = 1 h), the model uses TMY format data —taking into account the dry-bulb temperature, wind speed, solar irradiance—together with the greenhouse geometry, envelope properties, and ventilation/infiltration rates expressed as the air changes per hour. It then solves a time-dependent energy balance equation that includes conduction, convection, radiation, and ventilation, as well as transmitted solar gains, to compute the net heating demand and indoor air temperature. Given this demand, the model considers the heat pump operating point (ASHP or DCHP) to obtain the instantaneous COP and electric power (). The resulting indoor temperature is used as the initial condition in the next step. Annual integration yields hourly time series of the heating load, COP, and electricity consumption, as well as seasonal performance metrics, in this case the annual COP, electricity use, and greenhouse gas emissions.
Heat-pump performance estimation
The instantaneous COP at each simulation step was calculated using an empirical temperature-driven approach calibrated from published correlations (Chen et al. 2006; Yoon and Jeon 2024) and then applied under our greenhouse sink conditions. Following the procedure exemplified in recent dynamic simulations that regress the vapor-compression performance against a representative source (heat sink) temperature and include auxiliary terms explicitly in the power balance, we adopted a linear COP–temperature model for each configuration and enforced it hourly in the annual run. For a given hour , we computed the COP from a first-order relationship in the effective source temperature: , , where is the ambient air temperature (the heat source for the ASHP), and is the temperature of the water entering from the data center (the heat source for the DCHP). We adopted the following correlation parameters: =2.42, =0.073, =3.01, and =0.062. For each hour, we computed the delivered heat and electricity . The hourly COP and power consumption were aggregated into monthly and annual metrics (SPF and annual electricity) as and the annual power consumption (). Given the identical sink-side conditions for the ASHP and DCHP, the performance differences arose solely from the source temperature terms (outdoor ambient temperature versus entering water temperature) captured by the equations above.
Results
Figure 4 summarizes the thermal (top) and power consumption (bottom) for three consecutive winter days. As shown in Fig. 4(A), the outdoor temperature (blue line) exhibits a clear diurnal cycle, reaching a minimum in the early morning and partially recovering during the daytime. In contrast, the indoor temperature (red line) remains tightly regulated around the setpoint, indicating that the heating system is engaged, maintaining the indoor temperature. The outdoor air follows a strong diurnal cycle, with the minima occurring before sunrise, but the greenhouse air (red) temperature remains close to the setpoint, showing only small fluctuations and a short phase lag owing to thermal capacitance.
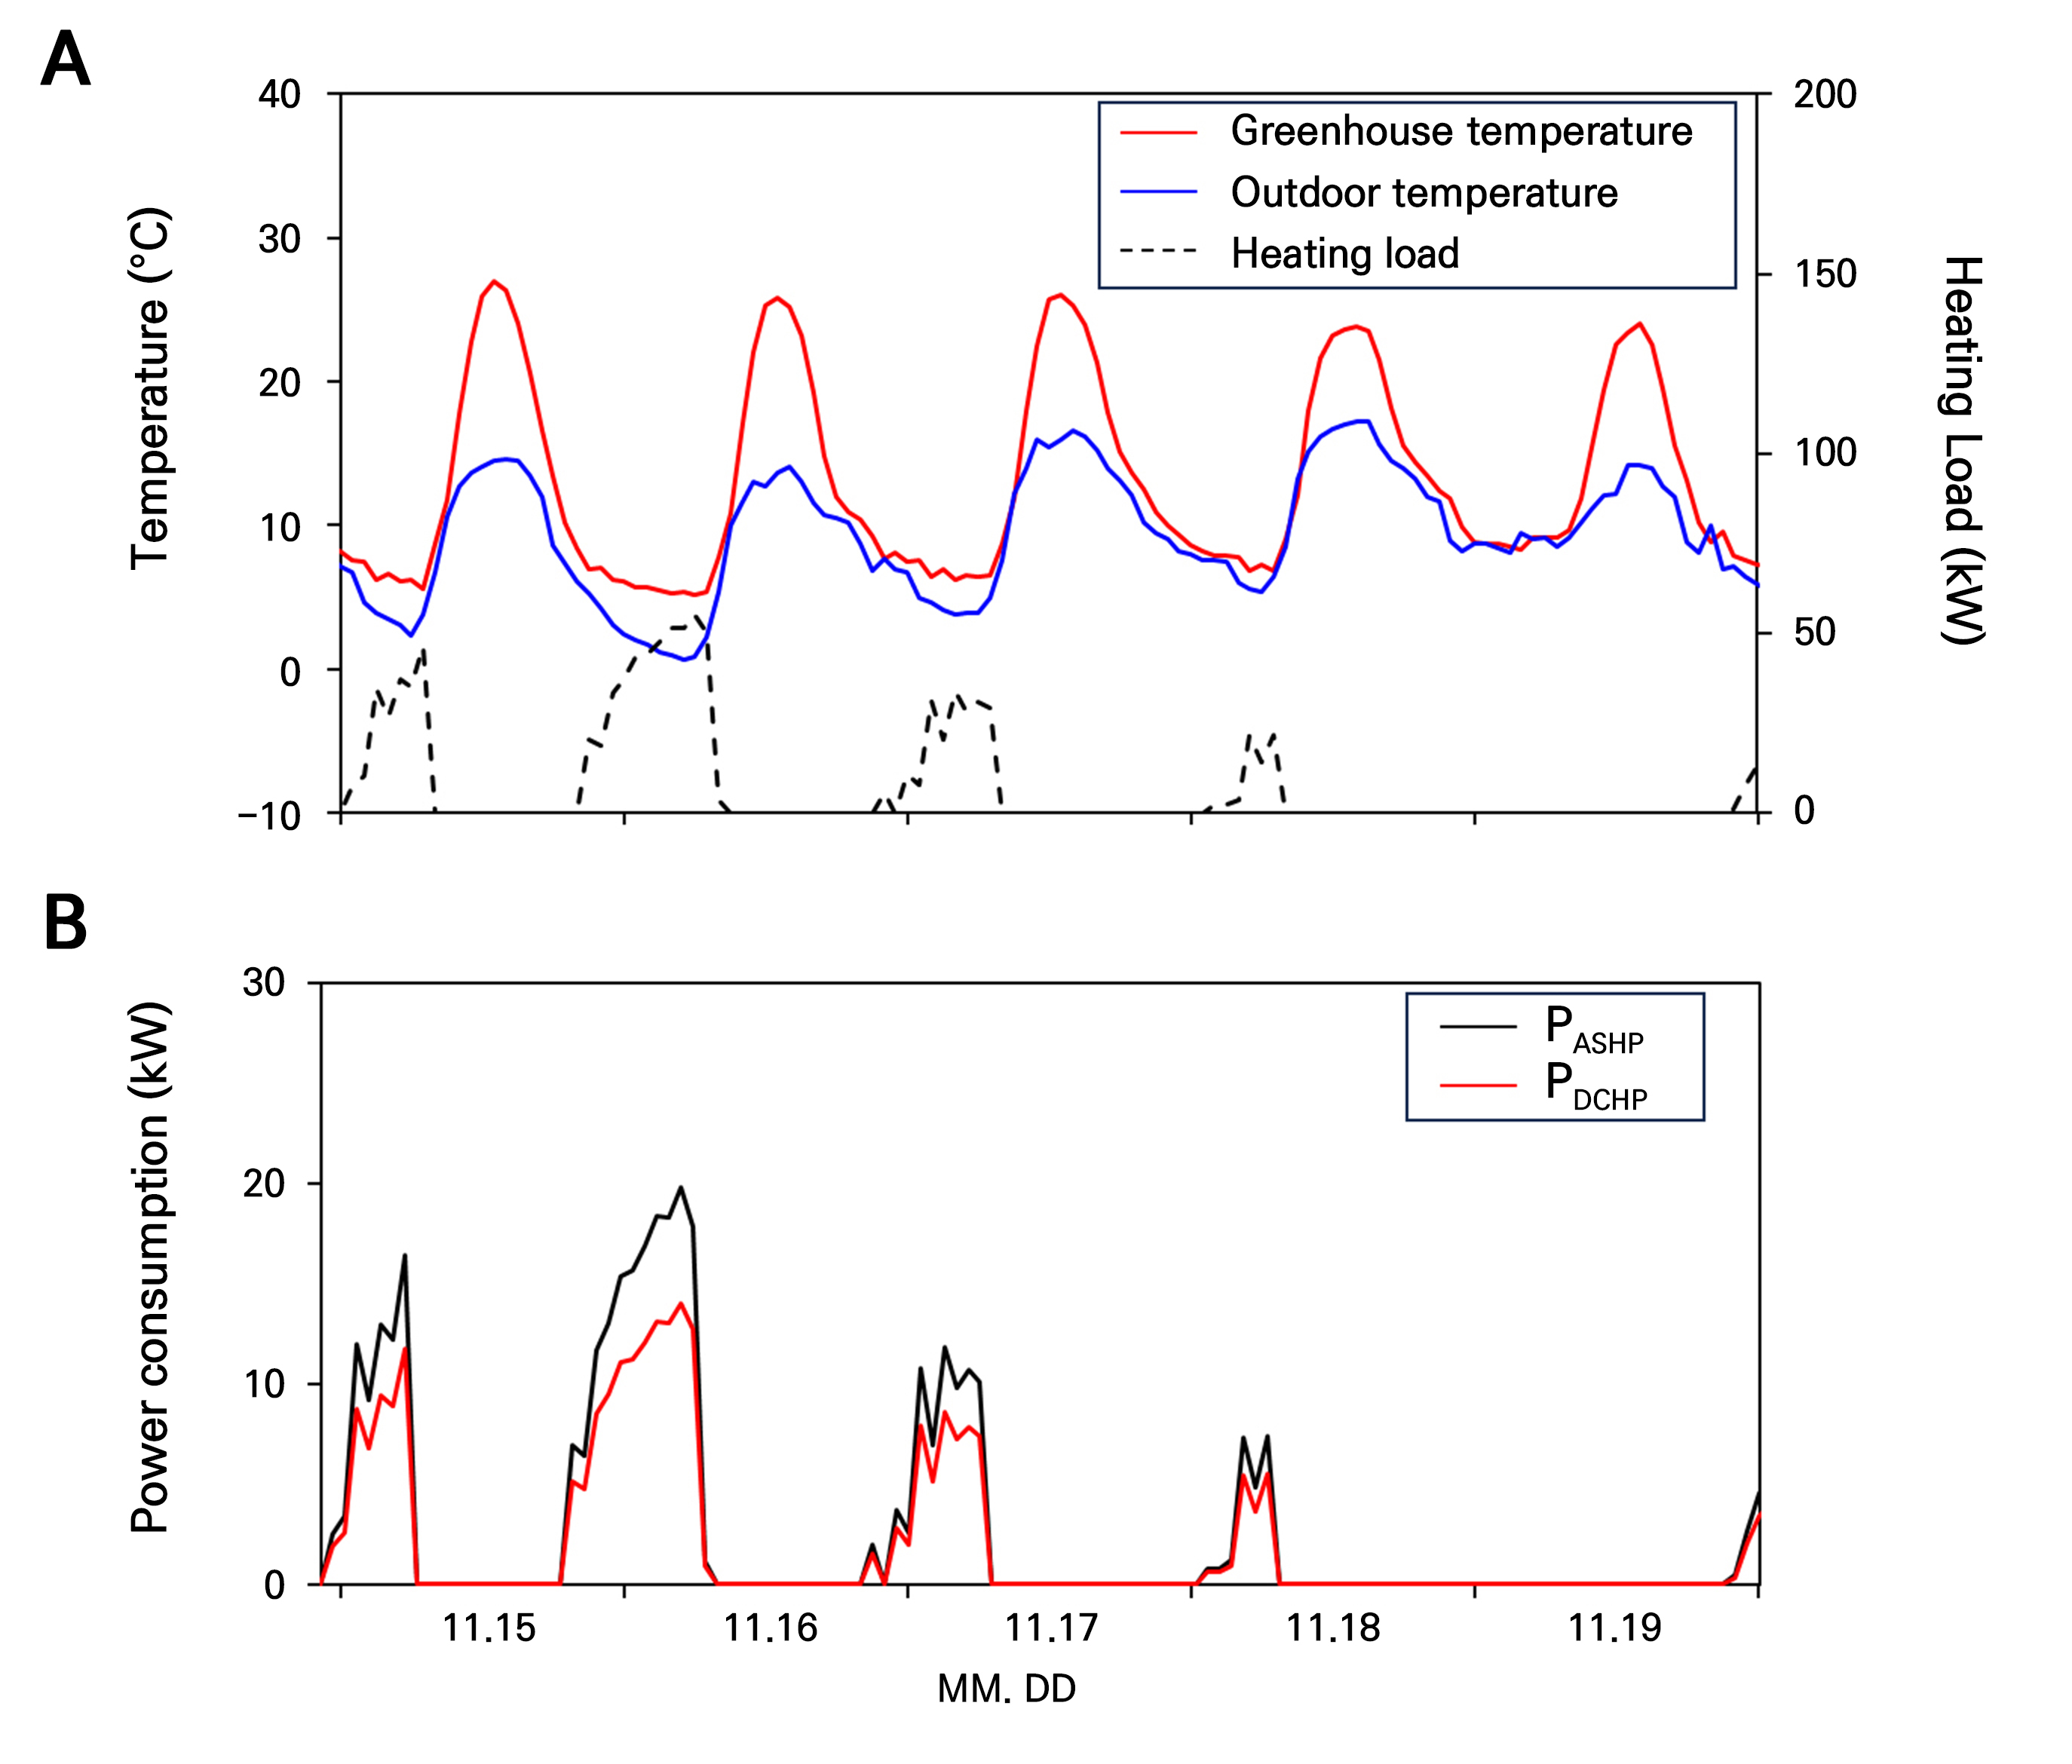
The heating load (dashed line) appears only when the outdoor temperature drops sufficiently below the setpoint; when the outdoor temperature remains above the setpoint, no heating is required, and the load collapses to zero, as observed during the mild daytime periods. Load peaks occur in the early morning hours when the indoor–outdoor temperature difference is the largest, and solar gains are absent. The corresponding heat pump power consumption levels show that the DCHP (red) consistently draws less power and exhibits a smoother profile than the ASHP (black) under identical supply requirements, as shown in Fig. 4(B). The largest separations arise during cold spells, reflecting the lower temperature lift and absence of frosting penalties when using a warmer, more stable data-center source. Finally, normalizing the peak and daily integrated loads as per the greenhouse floor area yields heating demands per unit area that fall within the ranges reported in prior greenhouse studies (Ozturk and Kucukerdem 2016; Brækken et al. 2024), indicating that the modeled envelope and control assumptions predict the heating demand realistically for this climate and season. These features indicate effective peak suppression and a lower mean power demand for the DCHP system, trends that align with the seasonal metrics reported later when discussing Fig. 6. Overall, Fig. 4 confirms that the DCHP system maintains favorable operating points throughout winter, whereas the efficiency of the ASHP degrades with a decrease in the ambient temperature.
The monthly average values confirmed a strong anti-phase relationship between the outdoor temperature and heating demand, as shown in Fig. 5(A). As the ambient temperature increases from winter to summer, the greenhouse heating load declines and remains essentially zero from April to October; it re-emerges in late autumn and peaks during January and February, when the outdoor temperature is the lowest. This seasonal pattern indicates that envelope conduction and ventilation dominate the load formation under the conditions studied here, with solar gains providing only modest relief in the shoulder months. This heating load is satisfied by the heat supplied by the ASHP and DCHP, as shown in Fig. 5(B). The monthly average COP and the summation of the power consumption are illustrated. The COP of the ASHP exhibits pronounced seasonal dependence on the outdoor temperature.
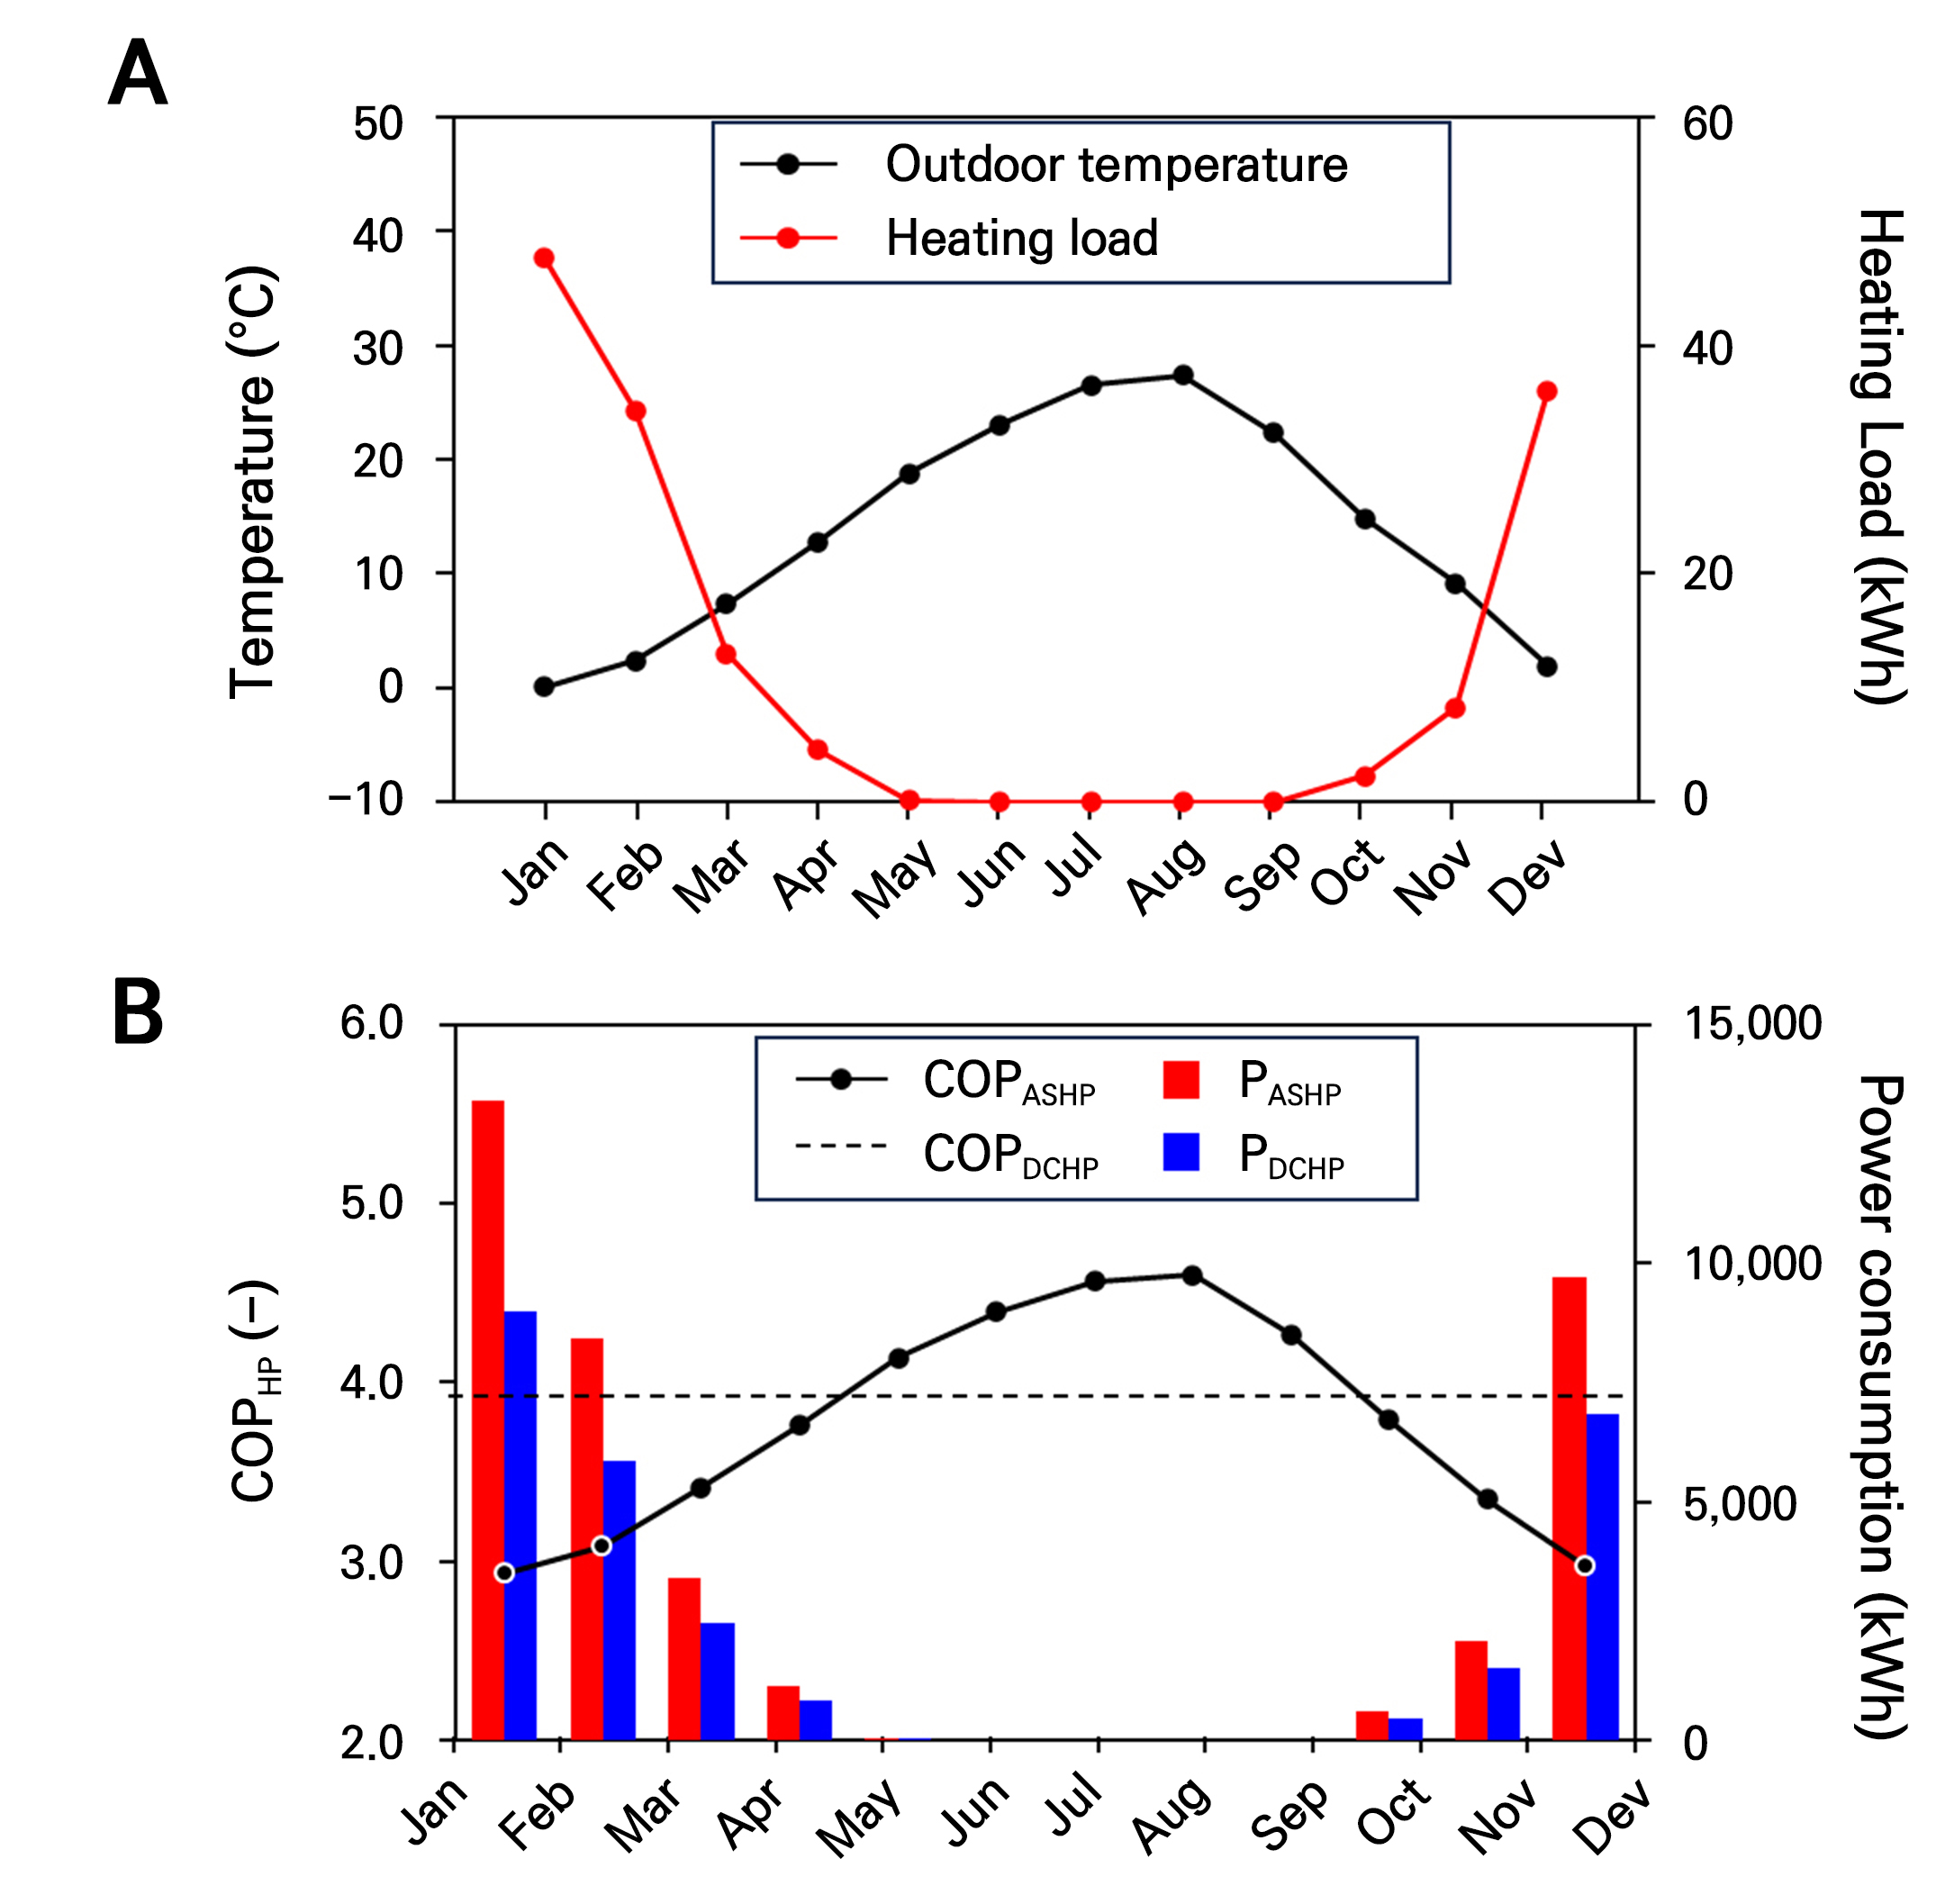
As ambient conditions warm from winter to summer, the COP rises steadily, peaking in mid-summer (≈4.5) and declining again toward winter. During the coldest month (January), the COP was 3; by late spring it surpassed 4 and then returned to approximately 3.0–3.2 in late autumn as temperatures fell. This month-to-month pattern reflects the direct link between the temperature lift and efficiency: colder outdoor air lowers the evaporating temperature, increases the lift, and depresses the COP, whereas warmer outdoor air has the opposite effect. Notably, the COP curve for periods of negligible heating demand (April–October) is shown for reference; during this period, the COP contributes minimally to the seasonal energy because the compressor runtime is minimal. In contrast, the DCHP maintains an approximately constant COP of 3.9 across months, underscoring the stabilizing effect of the warmer data-center water source during the heating season. This represents a 15.8% COP enhancement for the DCHP compared with the ASHP in the coldest month. For example, in January, when the heating load reaches its maximum, the power consumption bars show corresponding electrical demands of 13,399 kWh for the ASHP and 9,000 kWh for the DCHP, indicating a 32.8% reduction in power consumption for the DCHP. Collectively, these results demonstrate that stabilizing the source temperature through data center coupling shifts the operation into a higher COP and lower power regime across the full range of outdoor conditions, suppressing winter peaks and underpinning seasonal savings. The monthly COP pattern observed in this study is consistent with previously reported seasonal trends of air-source heat pumps (Baglivo et al. 2023; Masiukiewicz et al. 2025). The drop in COP under cold outdoor conditions and its subsequent recovery with rising temperatures closely match the temperature-dependent behavior described in the literature. In contrast, the DCHP exhibited minimal seasonal variation owing to its thermally stable water-source temperature, which aligns with the stable seasonal performance reported for water-source and ground-source heat pump systems (Hepbasli and Kalinci 2009).
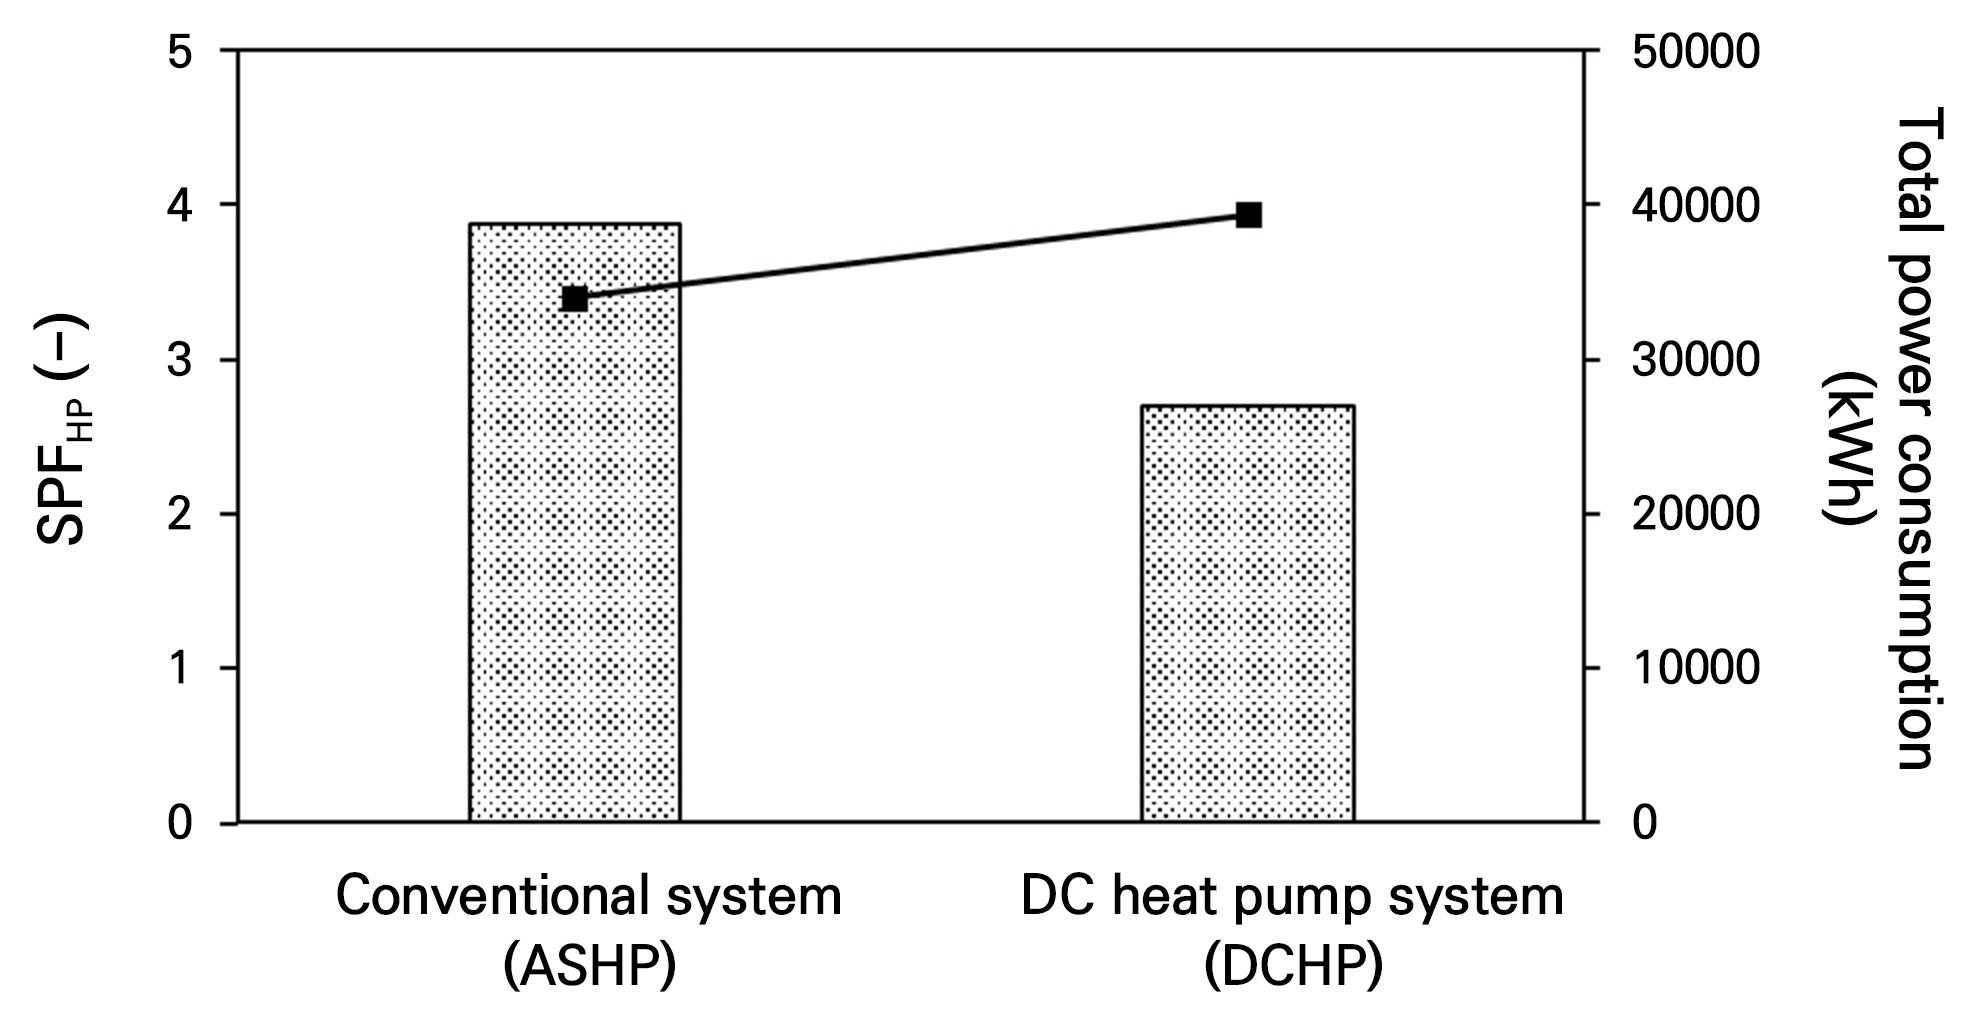
A long-term perspective is essential for evaluating system performance outcomes. Accordingly, the annual evaluation of each system was conducted using the following annual metrics: total heat pump power consumption, seasonal performance factor (SPF), and GHG emissions derived from grid-electricity factors. Figure 6 shows the annual heat pump performance (line, left axis) and power consumption (bar, right axis). The DCHP system outperforms the ASHP on both metrics: the SPF increases from 3.40 for the ASHP to 3.94 for the DCHP, with an absolute gain of 15.8%. Simultaneously, the annual electricity consumption decreased from 38,800 kWh to 26,942 kWh, yielding savings of 11,858 kWh (30.5%). The paired improvement—a higher SPF with less electricity use—confirms that the warmer and more stable heat source from the data center reduces the temperature lift through the heating season and shifts the operation into a more efficient regime. In the baseline configuration, the envelope heat loss was calculated using a U-value of 3.0 W m-2 K-1, corresponding to a PE film greenhouse equipped with a thermal curtain. To evaluate the potential impact of improved insulation commonly achieved in commercial greenhouses through techniques such as water-curtain systems or multi-layer thermal screens, an additional scenario with a reduced U-value of 1.5 W m-2 K-1 (a 50% reduction) was analyzed. Under this improved envelope condition, the annual heating demand decreased from 38,800 kWh to 25,080 kWh (a 33% reduction), resulting in a proportional decrease in electricity consumption for both the ASHP and DCHP systems. This indicates that envelope insulation is a dominant factor with regard to greenhouse heating performance, although the relative advantage of the DCHP system is preserved even under enhanced insulation conditions.
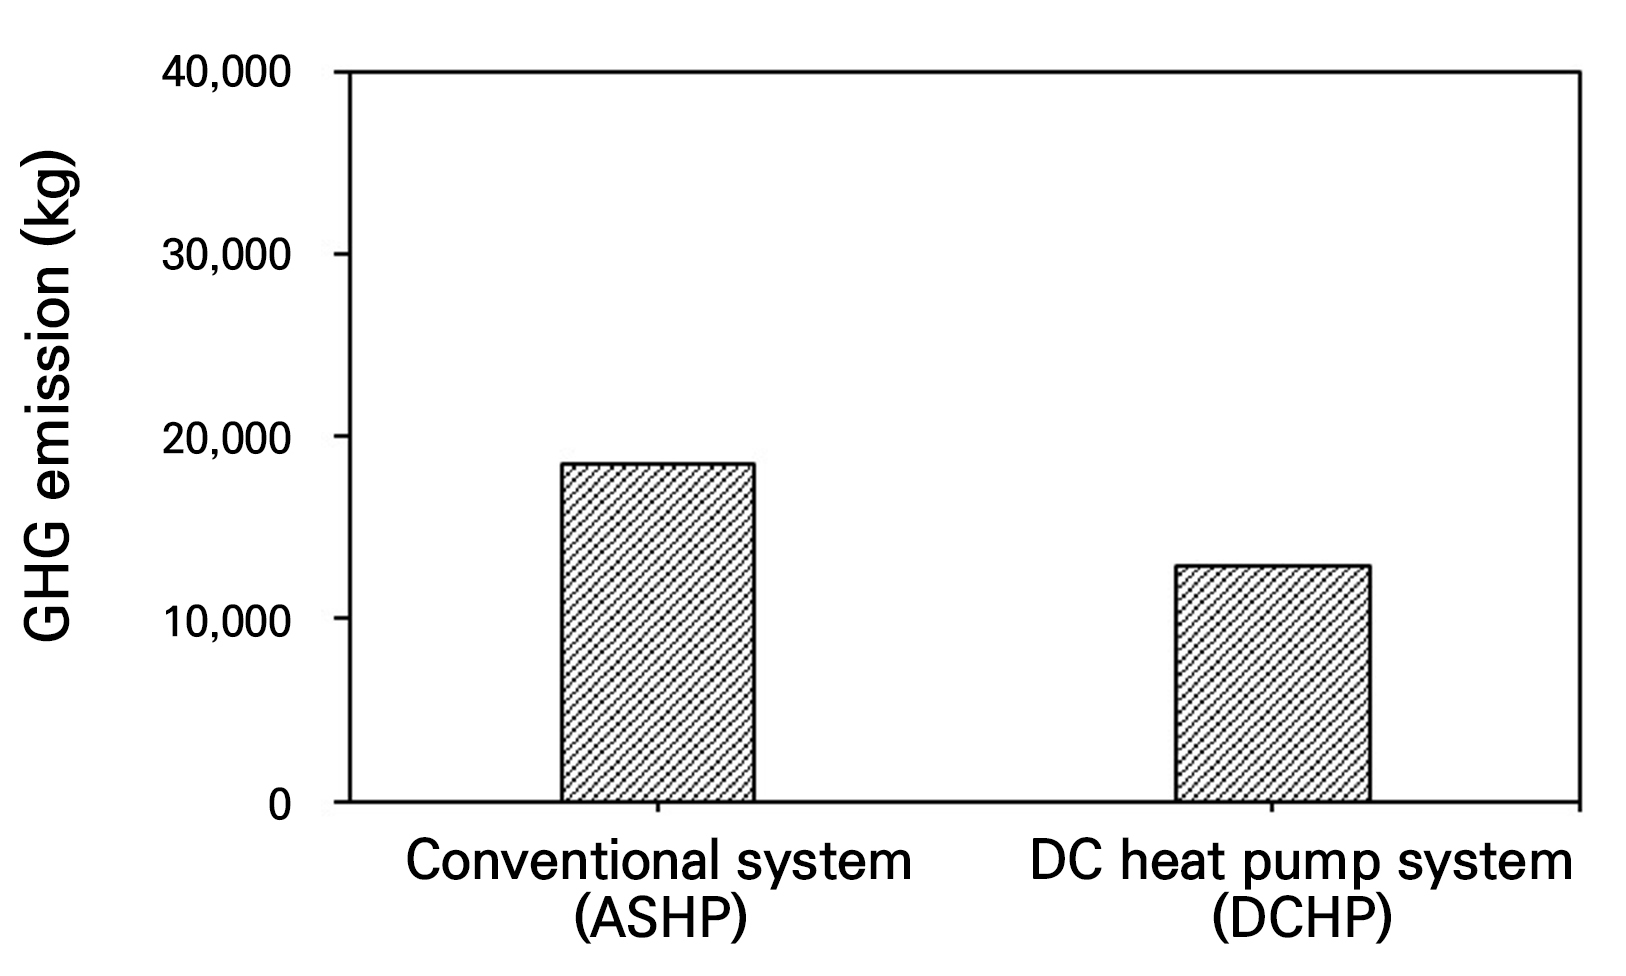
Finally, the annual GHG emissions of both systems were compared using the Republic of Korea grid emissions factor of 0.4781 kgCO2 eq/kWh. As shown in Fig. 7, the annual greenhouse gas emissions were estimated to be 18,550 kg CO2 eq for the ASHP and 12,881 kg CO2 eq for the DCHP system. These values correspond directly to the annual electricity consumption and indicate an absolute reduction of 5,669 kg CO2 eq or a 30.5% decrease owing to the DCHP configuration. Because greenhouse gas emissions were calculated by multiplying electricity consumption by a fixed emission factor (i.e., CO2 emissions = electricity use × emission factor), the reduction rate in CO2 emissions becomes identical to the reduction rate in electricity use.
The combination of a higher SPF, less electricity consumption, and lower GHG emissions demonstrates that integrating the heat-pump evaporator with a data-center return loop is a robust strategy for improving seasonal greenhouse heating performance capabilities.
Discussion
This study quantified the change in the operating regime of a greenhouse heat pump when replacing the air-side evaporator with a data-center return water source. Three consistent findings emerged across hourly, monthly, and annual analyses. First, the heating load was almost entirely driven by the ambient temperature, with the demand collapsing to zero from late spring to early autumn. This validates the energy-balance formulation and implies that performance comparisons should be made mainly during winter operation, when the temperature lift is the largest and the opportunity for improvement is the greatest. Second, source temperature stabilization was the dominant factor behind the observed gains. The DCHP maintains an approximately constant COP independent of the month, whereas the COP of the ASHP follows the outdoor temperature, dropping in winter and peaking near 4.5 in summer when heating is negligible. The consequence is visible at all timescales: (i) lower and more smoother power traces over cold sequences, (ii) reduced electricity use by 30.5% in January, and (iii) an overall gain in seasonal efficiency. Third, these efficiency gains propagate to system-level outcomes: the SPF increases from 3.40 for the ASHP to 3.94 for the DCHP, and the annual electricity consumption falls from 38,800 kWh to 26,942 kWh (a 15.8% reduction). Furthermore, the annual GHG emissions can be significantly reduced with the DCHP system compared to the ASHP system. However, this model assumes a fixed DCHP source temperature of 15°C and employs linear temperature-based COP correlations with aggregated network losses (no thermal storage modeled). As this study focuses on a feasibility assessment, a sensitivity analysis in which the data-center source temperature varies is reserved for future work. Conceptually, a higher source temperature reduces the temperature lift and increases the COP, whereas a lower source temperature decreases the COP. Nevertheless, due to the inherently stable temperature of water-based sources, the relative performance advantage of the DCHP over the ASHP is expected to persist throughout the heating season. Furthermore, the results reflected one greenhouse, one climate, and a single crop requiring an 8°C heating setpoint. Considering the implications of greenhouse scale-up efforts and higher heating setpoints, two trends are anticipated. First, increasing the greenhouse floor area proportionally increases the absolute heating demand; however, the relative advantage of the DCHP system is expected to persist because the warmer and more stable source temperature from the data center reduces the temperature lift regardless of the scale. Second, while higher heating setpoints inevitably raise the overall energy consumption for both systems, the ASHP experiences a greater increase in power demand due to its stronger dependence on the outdoor temperature. As a result, the DCHP system would continue to demonstrate a performance benefit, and its energy-saving rate may even become more pronounced under elevated heating setpoints. Finally, for the practical deployment of a data center and greenhouse heat integration system, several considerations must be addressed in advance. Successful application requires appropriate pricing and incentive policies from policymakers, while growers must clearly understand the economic benefits and support mechanisms available to them. Moreover, key techno-economic factors including the pipeline installation cost, the distance between the data center and the greenhouse (which affects the thermal losses and pumping power), and economic viability metrics such as the ROI and payback period should be carefully assessed prior to implementation.
Overall, the analysis establishes that data center coupling offers a physics-grounded, operationally robust method by which to reduce electricity use associated with greenhouse heating, especially during cold hours that dominate the seasonal heating demand.
The conclusions are as follows:
1. Seasonal efficiency gain: With identical setpoints and sink conditions, the data center–coupled heat pump achieved an SPF of 3.94 versus 3.40 for the ASHP, reflecting the advantage of a warm and stable source.
2. Lower electricity and emissions: The annual compressor electricity demand decreased by 30.5%, and the calculated GHG emissions decreased accordingly.
3. Winter peak mitigation: During the coldest month, the DCHP system significantly reduced the electricity consumption while maintaining a constant temperature, yielding smoother operation and potential demand-charge benefits.
These findings support data center waste-heat integration as a credible near-term strategy for improving the energy and operational performance of greenhouse heating systems over the entire growing season.
