

Introduction
Materials and Methods
Next-Generation Sequencing and Assembly
Microsatellite Detection, Primer Design, and PCR Amplification
Polymorphism and Genetic Characterization
Results and Discussion
Sequencing, Contig Assembly, and Microsatellite Detection
Characterization of Polymorphic Markers and Genetic Diversity
Genetic Differentiation and Structure of Three K. paniculata Populations
Introduction
Koelreuteria paniculata Laxm. (Sapindaceae) is a deciduous woody plant, reaching up to 13 m in height and 50 cm in diameter (Meyer, 1976). This species is regionally endemic and native to parts of eastern Asia including Korea, China, and Japan (Wang et al., 2013). It has high value as a horticultural genetic resource because of the aesthetic appeal of its showy yellow flowers and seed pods. It has been widely used as an ornamental and landscape tree at parks, roadsides, temples, and so on, and has been introduced as the ‘Goldenrain tree’ in America and Europe, and is popularly cultivated there for landscape purposes. In addition, its fruits and leaves have been used as medicinal resources and dyes, respectively (Meyer, 1976). In South Korea, K. paniculata trees are scattered sporadically with only a few remnant populations, mainly located near the seaside (Lee, 1958; Lee et al., 1997). Among them, three populations have been designated as natural monuments due to their biological and cultural significance. These remnant populations may have important evolutionary roles as reservoirs of genetic diversity and reproductive fitness, and for maintaining the adaptive potential of trees under pressure from environmental change (Reisch et al., 2007). In that respect, those natural monument populations could play an important role as a genetic source for conserving genetic diversity and developing new economic varieties of this species. For the conservation of the monument populations, local authority-led management projects, such as tree surgery and removal of understory vegetation, have been carried out. Meanwhile, it is also necessary to prepare conservation strategies that consider the genetic characteristics of these populations. Genetic studies of K. paniculata in Korea have been performed by isozyme analysis (Lee et al., 1997). However, studies using DNA markers, based on sequence information such as microsatellites, have not been conducted.
A microsatellite (or simple sequence repeats, SSR) is a highly variable genetic region consisting of simple sequence repeats of 1 to 6 nucleotides (Selkoe and Toonen, 2006). Microsatellites are widely distributed in genomes and have been used as a genetic marker for studying genetic diversity, breeding, forensic science, and so on (Pourkhaloee et al., 2018; Kim et al., 2019). Ten polymorphic expressed sequence tag (EST)-SSR markers were previously developed using the transcriptomic approach in this species (Yang et al., 2017). However, the results showed slightly low polymorphism. In addition, since EST-SSRs are only derived from transcribed regions and likely to be conserved, they are less randomly dispersed throughout the genome and less polymorphic than genomic microsatellites (Li et al., 2004; Pashley et al., 2006). Employing a large number of markers can allow for genome-wide sampling and increase the statistical power for genetic estimation (Selkoe and Toonen, 2006). Thus, more DNA markers need to be developed for the genetic characterization of this species.
In this study, we aimed to develop polymorphic genomic microsatellite markers for K. paniculata using next-generation sequencing, and to characterize them using the three natural monument populations of K. paniculata in Korea.
Materials and Methods
Next-Generation Sequencing and Assembly
To construct the DNA library for next-generation sequencing, DNA was extracted from an individual K. paniculata tree that is planted in the National Institute of Forest Science (NIFoS), Suwon, South Korea (voucher specimen No. WFRI 67978; deposited in the herbarium at the Warm-temperate and Subtropical Forest Research Center of NIFoS, JeJu). Genomic DNA (100 ng·µL-1) was extracted using Plant SV mini kit (GeneAll, Seoul, Korea) and digested using Fragmentase (New England Biolabs, Beverly, MA, USA). The fragments were repaired to blunt ends using a SPARK DNA sample Prep Kit for Ion Torrent (Enzymatics, Beverly, MA, USA). The P1 adapter (5'-CCACTACGCCTCCGCTTTCCTCTCTATGGGCAGTCGGTGAT-3', 5'-ATCACCGACTGCCCATAGAGAGGAAAGCGGAGGCGTAGTGGTT-3') and A adapter (5'-CTGAGTCGGAGACACGCAGGGATGAGATGGTT-3', 5'-CCATCTCATCCCTGCGTGTCTCCGACTCAG-3') were ligated to the blunt-ended DNA using SPARK DNA sample Prep Kit (Enzymatics). DNA fragments of 230-270 bp were selected by purification using XSEP MagBead (Celemics, Seoul, Korea). The purified DNA was used as templates in PCR amplification using the primer set (5'-CCACTACGCCTCCGCTTTCCTCTCTATG-3', 5'-CCATCTCATCCC TGCGTGTC-3'). The PCR product was applied to next-generation sequencing with an Ion Proton system (Thermo Fisher Scientific, Waltham, MA, USA). The sequenced reads were assembled to contigs using SOAPdenovo2 ver. 2.04 (Luo et al., 2012).
Microsatellite Detection, Primer Design, and PCR Amplification
To identify the microsatellites, the contigs larger than 500 bp were selected and analyzed by MISA (Beier et al., 2017). The length of the repeated motif for detecting microsatellites was set from di- to penta-nucleotides. The minimum numbers of repetitions were 6 for di-nucleotides, and 5 for the others. Next, primer sets flanking the microsatellites were designed with Primer3 (Koressaar and Remm, 2007).
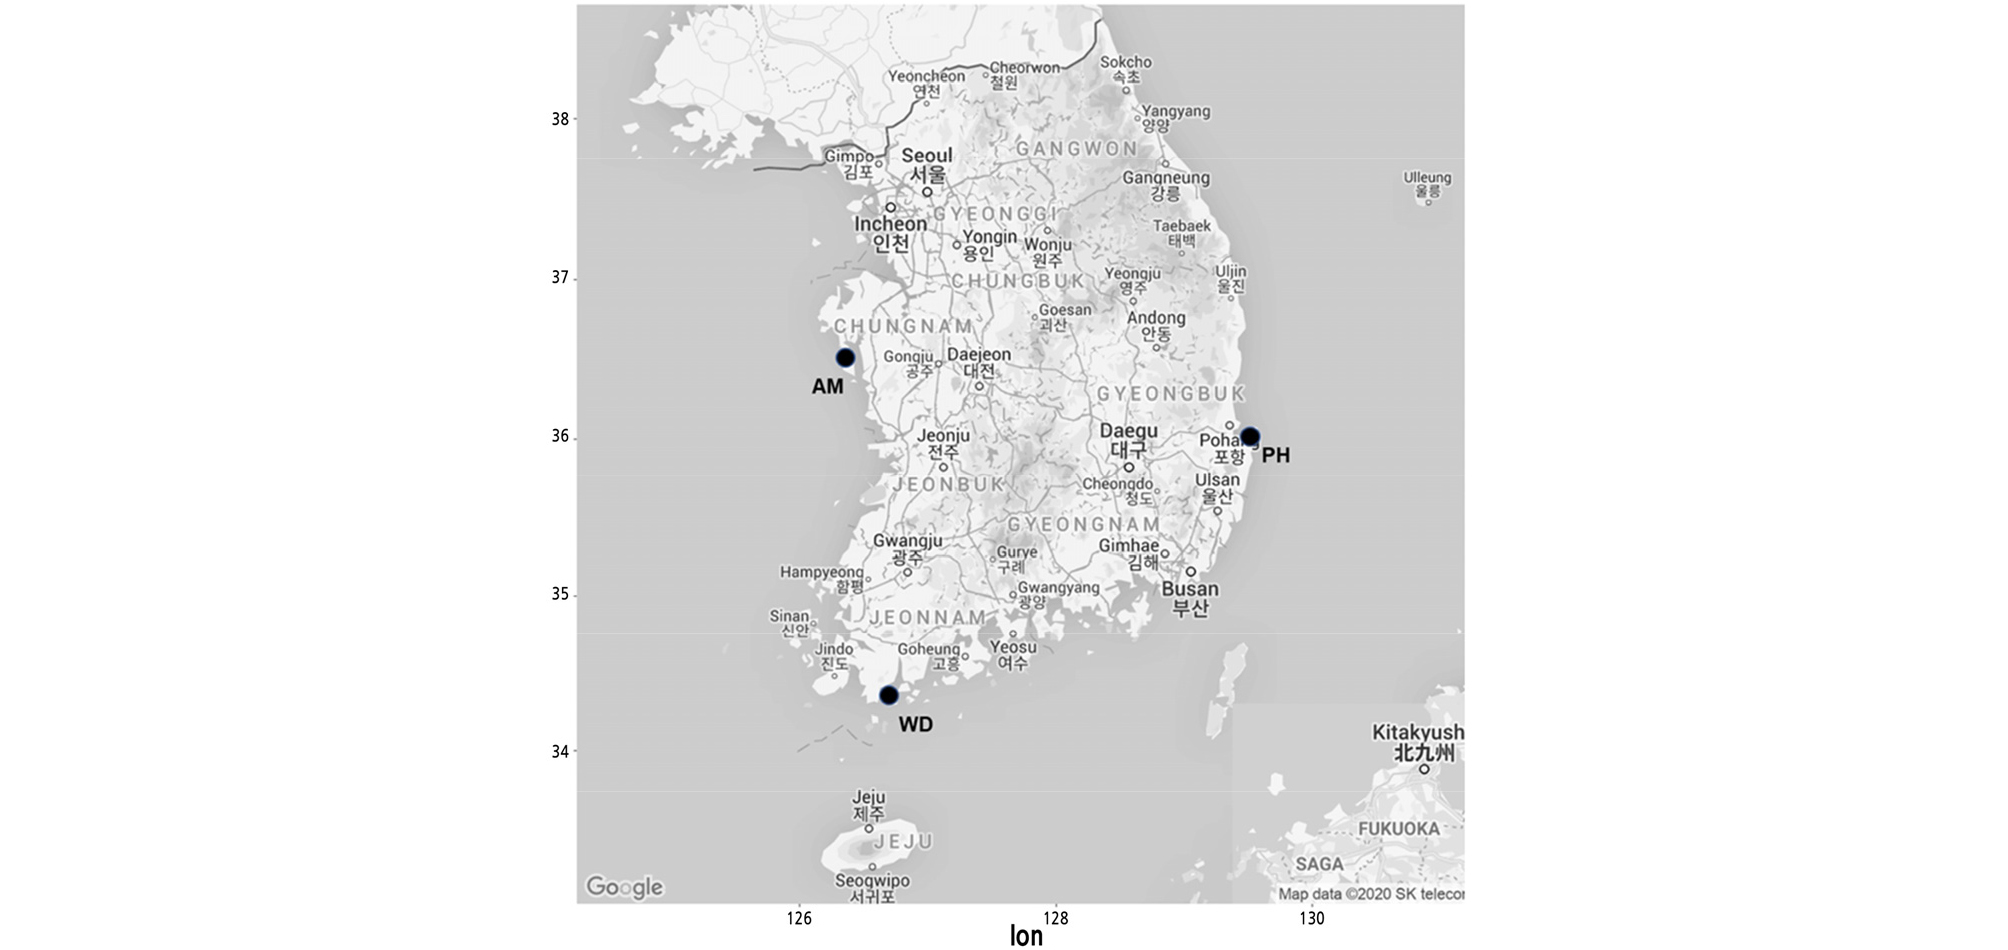
To select stable and polymorphic candidate markers, the primer sets were screened using 12 individuals (four per population) collected from the three natural monument populations located in Anmyeondo (AM), Pohang (PH), and Wando (WD) in South Korea (Table 1 and Fig. 1). Then, selected polymorphic markers were applied to all individuals sampled from the three populations. The PCR amplification was performed in 15 µL reaction mixtures containing the following: 20 ng of template DNA, 1x reaction buffer, 2.5 mM MgCl2, 0.2 mM dNTPs, 0.04 µM M13(-19) sequencing primer labelled with FAM, 0.2 µM primer mix, and 0.5 U of Taq DNA polymerase (BIOFACT, Daejeon, Korea). The PCR conditions were as follows: denaturing at 94°C for 5 min; 10 cycles at 94°C for 45 s, 60°C for 45 s, and 72°C for 45 s; 30 cycles at 94°C for 45 s, 52°C for 45 s, and 72°C for 45 s; and final extension at 72°C for 5 min. The PCR products were separated on an ABI 3730 xl Genetic Analyzer (Applied Biosystems), and genotypes were determined using Gene Mapper v5.0 (Applied Biosystems).
Table 1.
Location information for K. paniculata samples used in this study
Polymorphism and Genetic Characterization
Genetic parameters such as the number of alleles (NA), observed heterozygosity (HO), expected heterozygosity (HE), inbreeding coefficient (FIS), pairwise genetic differentiation index (FST), and accumulated probability of identity (PI) for polymorphic markers were calculated using GenAlEx 6.41 (Peakall and Smouse, 2006). Analysis of molecular variance (AMOVA) for estimating the components of variance of the populations, and principal coordinate analysis (PCoA) for detecting the pattern of genetic differentiation of the populations were conducted using the GenAlEx. The Hardy-Weinberg (HW) equilibrium was tested by the Fisher’s exact test based on a Markov chain (Forecasted chain length: 1,000,000 and Dememorization step: 100,000) for all loci in each population using Arlequin ver. 3.5 (Excoffier and Lischer, 2010). The linkage disequilibrium (LD) was tested using FSTAT ver. 2.9.3.2 (Goudet, 2002). The significance levels were adjusted using the Bonferroni correction. Null allele frequencies were estimated using the Micro-Checker 2.2.3 (van Oosterhout et al., 2004). The polymorphic information content (PIC) was calculated using PIC calculator (Jan, 2002), according to the equation:
where pi is the frequency of the ith allele, and n is the number of alleles (Botstein et al., 1980). The population structure was inferred using STRUCTURE ver. 2.3.4 based on an admixture model with correlated allele frequencies. The K value was set from 1 to 6. For each K value, 10 independent runs were conducted with a burn-in period of 100,000 for each run, and a Markov chain Monte Carlo of 100,000 iterations. The optimum K value was determined by the method of Evanno et al. (2005) using STRUCTURE HARVESTER ver. 0.6.94 (Earl and Vonholdt, 2012).
Results and Discussion
Sequencing, Contig Assembly, and Microsatellite Detection
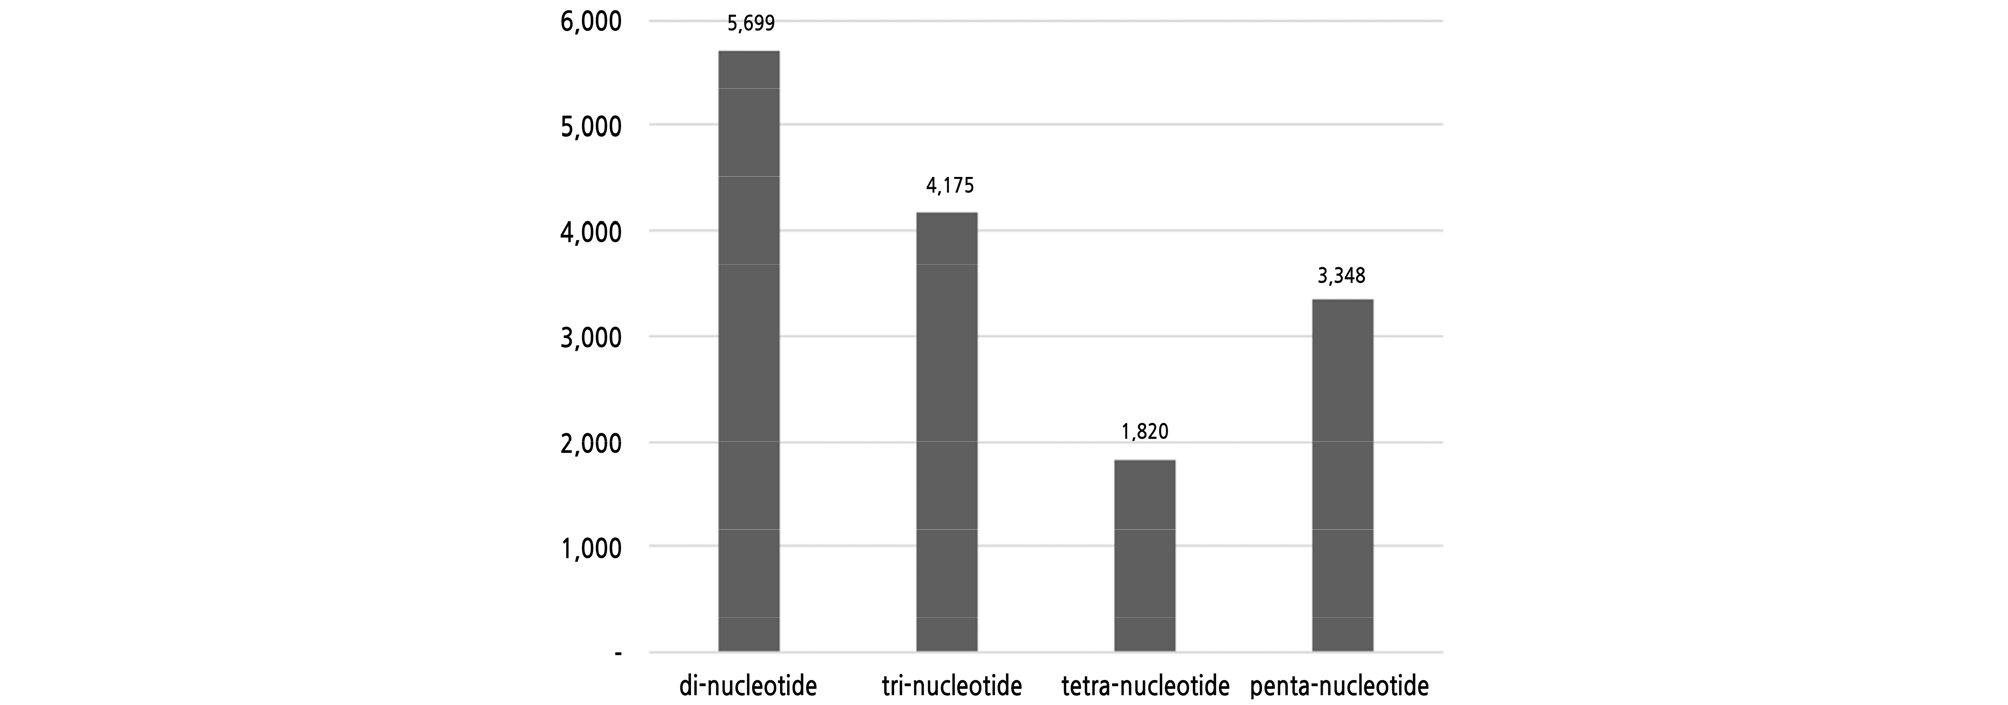
The next-generation sequencing analysis obtained 71,114,562 reads with a total length of 10.3 Gbp (average 144 bp), accounting for about 20x genome coverage (Ohri et al., 2004), which were assembled into 141,924 contigs of a minimum of 500 bp long with an average length of 784 bp (Table 2). The average length was quite similar to that of Haloxylon ammodendron analyzed with the Ion Proton, as in this study (Batkhuu et al., 2019). Among them, 141,441 contigs (99.7%) were identified as derived from the nuclear genome by BlastN analysis, and included 15,042 microsatellites. There were 5,699 and 4,175 di- and tri-nucleotide motifs, respectively, with the most abundant accounting for 66% (Fig. 2). Penta- and tetra-nucleotide microsatellites were 3,348 and 1,820, respectively, accounting for 34%. These results were consistent with most other organisms, excluding mono-nucleotide motifs which were not considered for analysis in this study (Zhang et al., 2012; Baek et al., 2016; Batkhuu et al., 2019). All of the 163 primer sets were designed from 179 contigs containing di- and tri-nucleotide microsatellites.
Table 2.
Results of next-generation sequencing and assembly
| Number of reads | Total length | Number of contigs | Length of contigs (bp) | ||||
| Total length | Minimum | Maximum | Average | N50 | |||
| 71,114,562 | 10.3 Gbp | 141,924 | 111,368,532 | 500 | 6,057 | 784 | 779 |
Characterization of Polymorphic Markers and Genetic Diversity
Fourteen primer sets were selected as polymorphic markers based on the genotyping data of the three K. paniculata populations (Table 3). The sequences including polymorphic microsatellite regions were deposited in the NCBI GenBank. The number of alleles at each locus for all populations ranged from one to seven (Table 4). The null allele frequency (NAF) of polymorphic loci were estimated to be negligible (p < 0.05) or moderate (0.05 < NAF < 0.20; Chapuis and Estoup, 2007). No significant LD value (p < 0.01) was detected in all marker combinations. The average number of alleles ranged from 2.4 in WD to 2.9 in AM. These results were similar to those analyzed in the previous study reported by Yang et al. (2017), in which ten polymorphic microsatellite markers were developed using the transcriptome data of K. paniculata. Genomic microsatellite markers were generally expected to have higher polymorphism compared to EST-derived microsatellite markers designed in highly conserved regions (Pashley et al, 2006). However, in this study, there was no difference in polymorphism depending on the sequence source for marker development. This low level of allelic diversity in K. paniculata was similar to that of Calophyllum inophyllum (Setsuko et al., 2012). These two species are distributed along the coast, and their seeds are dispersed through the ocean currents to areas relatively far apart (Lee, 1958). Setsuko et al. (2012) explained that the low allelic diversity of C. inophyllum might be due to founder effects and genetic drift in the process of the introduction of seeds by the ocean current (Eckert et al., 1996).We also thought that the low allelic diversity of K. paniculata might be due to the founder effect, and genetic drift by such a seed dispersal mechanism.
Table 3.
Characteristics of 14 microsatellite markers developed in K. paniculata
Table 4.
Genetic parameters of 17 loci in the three natural monument populations of K. paniculata
The average observed heterozygosity ranged from 0.406 in AM to 0.581 in PH, and the average expected heterozygosity ranged from 0.372 in AM to 0.455 in PH (Table 4). These results tended to be slightly lower compared to other tree species with a similar life history (long-lived perennial: HE = 0.680, regional: HE = 0.650, outcrossing: HE = 0.650) (Nybom, 2004). The polymorphic information content (PIC) varied between loci from 0.215 (MGJ_067) to 0.647 (MGJ_012), with an average of 0.431 over all 14 loci (Table 4). Four loci were highly informative (PIC > 0.5), and nine loci were moderately informative (0.25 < PIC < 0.5) (Bostein et al., 1980). The accumulated probabilities of identity (PI) of the 14 markers were calculated to be 4.1 × 10⁻⁶, 5.6 × 10⁻⁷, and 7.5 × 10⁻⁶ in AM, PH, and WD populations, respectively. These results mean that the probability that two independent samples will have the same identical genotype is quite low, and the set of these loci has a robust potential power to distinguish genetically different individuals in the population (Peakall and Smouse, 2006).
Genetic Differentiation and Structure of Three K. paniculata Populations
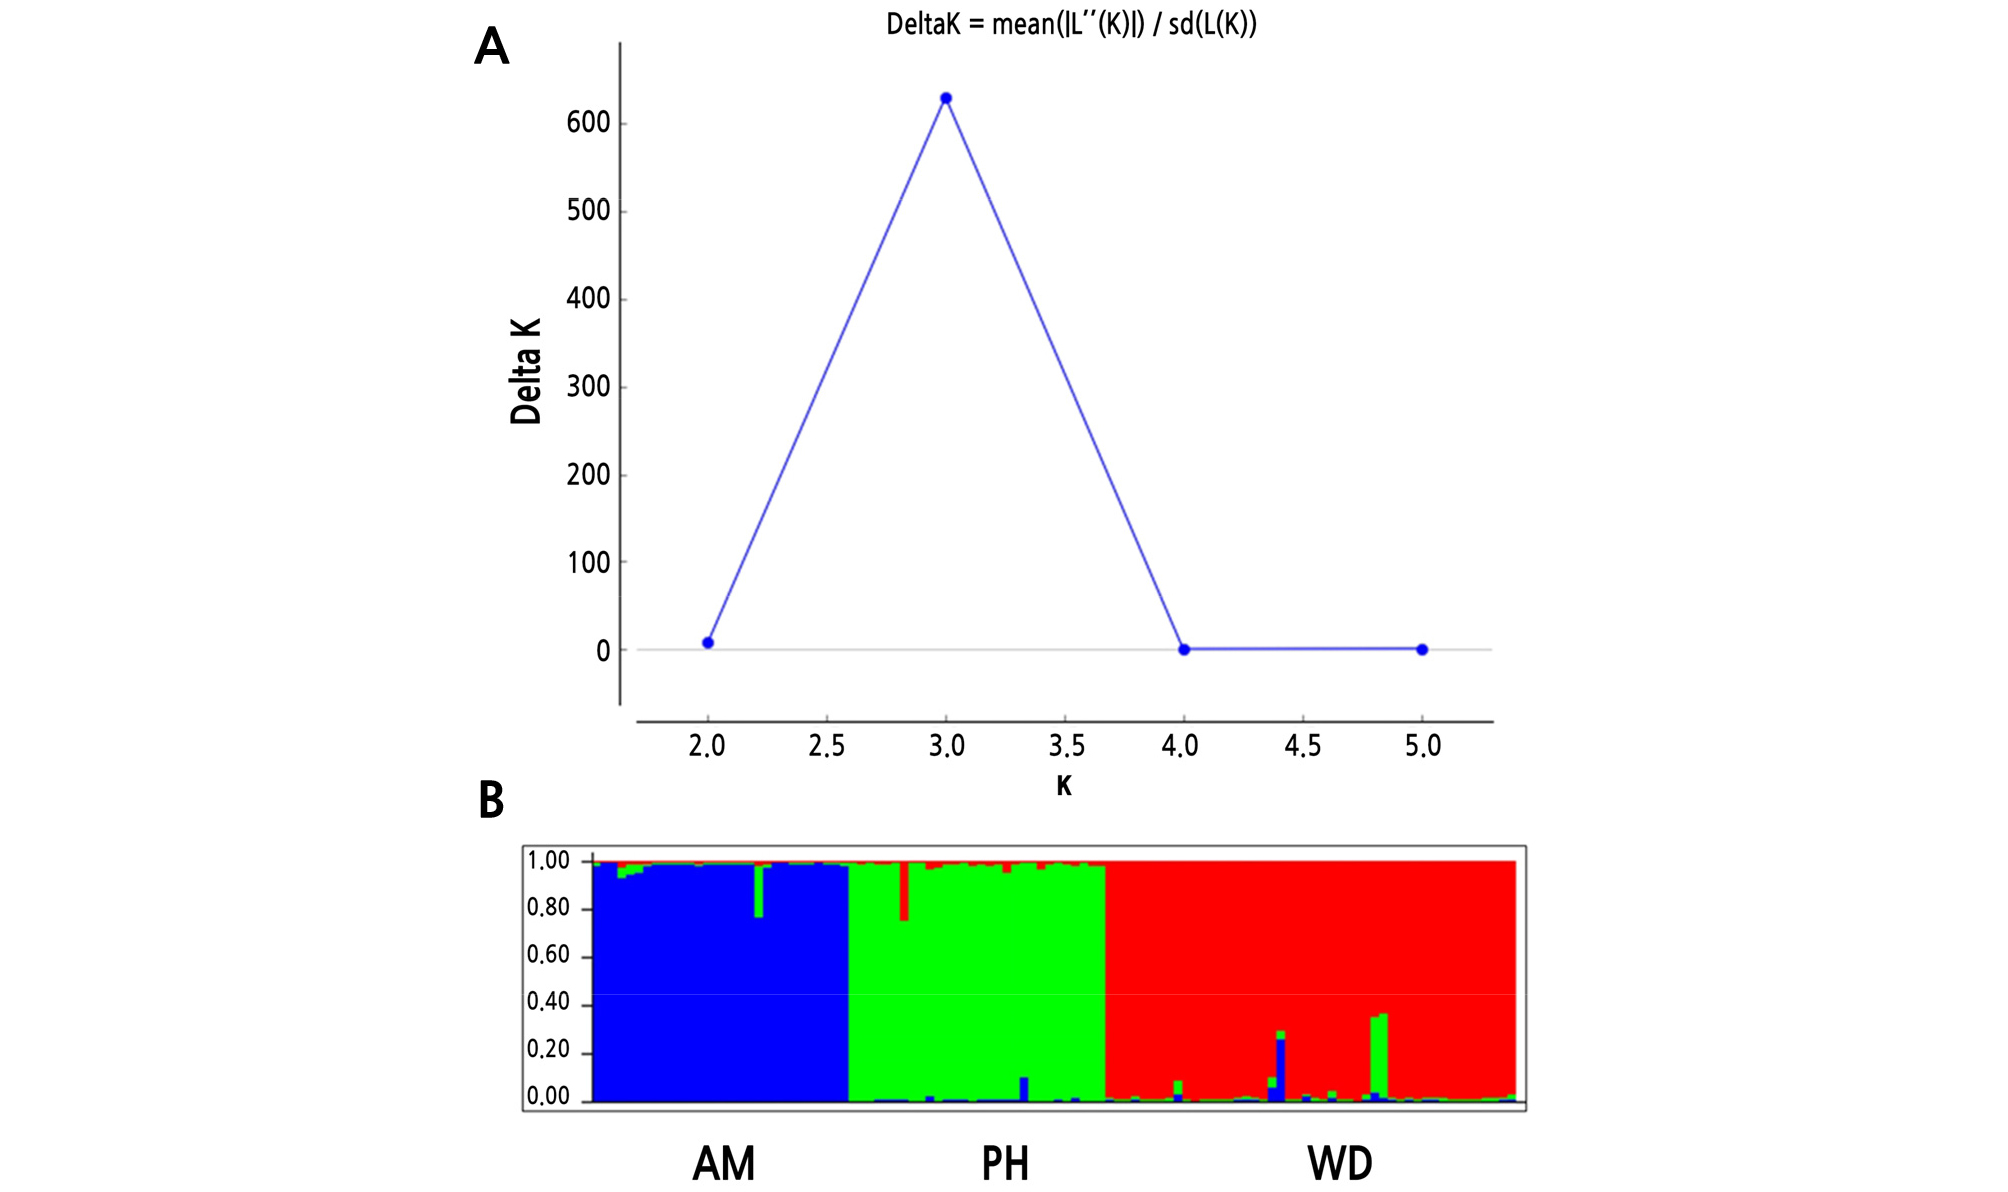
AMOVA revealed that 69% of the total variation originated from the difference among individuals within populations, and that 31% was due to differences among populations (Table 5), which was similar to the results from Hibiscus tiliaceus (31.3%) (Takayama et al., 2008),and much higher than that of C. inophyllum (14.5%) (Hanaoka et al., 2014). In the previous study on the K. paniculata population in Korea based on isozyme analysis, a high level of genetic differentiation was also found compared to tree species with similar distribution (Lee et al., 1997). PCoA at the population level showed a clearly distinct pattern. The first two principal coordinates explained 65.22% and 34.78%, respectively (Fig. 3). Pairwise FST values ranged from 0.101 to 0.168 (Table 6). Analysis with the Evanno et al. (2005) method based on STRUCTURE outputs showed that the value of ∆K was the largest at K = 3, as the most likely number of clusters (Fig. 4). The high genetic differentiation and distinct pattern among three K. paniculata populations indicated that gene flow might be quite rare among these populations. That might be due to its characteristic seed dispersal by gravity and drifting on the water, which is not enough for gene flow among populations discontinuously distributed over relatively long distances (Nybom, 2004). In fact, these populations are fragmented along the coast, and are at least about 230 km apart from each other when measured in a straight line (Fig. 1).
Table 5.
Distribution of genetic variations of three K. paniculata populations from analysis of molecular variance (AMOVA)

Table 6.
Pairwise genetic differentiation index values among the three populations
| Populations | AM | PH | WD |
| AM | 0.000 | - | - |
| PH | 0.166 | 0.000 | - |
| WD | 0.168 | 0.101 | 0.000 |
In conclusion, this study provided information regarding novel microsatellite markers and their genetic characteristics analyzed in the three natural monument populations of K. paniculata in Korea. Although the analyzed populations are designated as natural monuments and managed by legal protection, their genetic diversity falls short of expectations. This means that appropriate conservation strategies are needed to maintain the genetic diversity of these populations. Considering low levels of allelic diversity and high levels of genetic differentiation, ex situ conservation to collect the genotypes including all alleles distributed in each population are recommended. On the other hand, in order to prevent the reduction of genetic diversity due to genetic drift, introducing new genotypes from other populations also needs to be considered. In addition to the populations analyzed here, several populations are sporadically distributed inland. More detailed studies including the inland populations are expected to lead to appropriate measures to conserve genetic resources of K. paniculata in Korea. In this respect, microsatellite markers developed in this study will be useful for further conservational genetic studies. In addition, K. paniculata is one of the economically important species as an ornamental tree and a honey tree. Recently, many efforts are being made to select more suitable individuals according to their intended use. In this process, these markers will be effectively applicable for identifying selected breeding lines, individuals, and cultivars.
