Horticultural Science and Technology. 30 April 2016. 324-330
https://doi.org/10.12972/kjhst.20160033

ABSTRACT


MAIN

  • 서 언

  • 재료 및 방법

  •   식물재료

  •   아티초크 whole-cell 추출물 제조

  •   FT-IR 스펙트럼과 데이터 전처리 및 다변량 통계분석

  • 결과 및 고찰

  •   주요 아티초크의 FT-IR 스펙트럼 비교 분석

  •   FT-IR 스펙트럼 다변량 통계분석 및 대사체 수준 유연관계 비교

서 언

국화과 다년생 아티초크(Cynara cardunculus var. scolymus L.)는 미숙 꽃봉오리를 사용하는 채소류이며, 식이섬유와 항산화성 페놀 물질을 함유하고 있는 식물이다. 또한, 아티초크에 함유되어 있는 cynarin 성분은 콜레스테롤 저하, 신장과 간 대사 기능에 효과가 있는 것으로 알려져 있다(Francisco and Pedro, 2003; Wang et al., 2003; Seong et al., 2008; Adzet and Puigmacia, 1985).

아티초크는 주로 ‘Green Globe’, ‘Tempo’, ‘Cardoon’ 그리고 ‘Imperial Star’ 품종이 온화한 지중해 연안지역에서 재배된다. 이러한 다양한 품종을 식별하는 방법은 AFLP(amplified fragment length polymorphism), M-AFLP(microsatellite-amplified fragment length polymorphism), S-SAP(sequence-specific amplification polymorphism) 그리고 QTL(quantitative trait loci) 등을 이용하여 유전적 다양성 분석과 품종 구분이 이뤄지고 있다(Acquadro et al., 2005; Lanteri et al., 2006; Portis et al., 2012). 이러한 방법들은 정확한 유전적 분석을 통해 품종에 대한 정밀한 분석이 가능하지만, 분석에 대한 복잡성 그리고 많은 시간과 비용이 소요되는 한계점을 가지고 있다.

최근 오믹스 연구기법과 대사체학 연구가 활발히 진행되면서 대사체 수준에서 시료간의 양적, 질적 차이를 구명하고 있다. Fourier transform infrared(FT-IR) spectroscopy, proton nuclear magnetic resonance(HNMR) spectroscopy 및 mass spectrometry(MS) 등이 대사체 연구에 사용되고 있으며 분석 데이터를 이용하여 각종 시료의 식별 및 대사체 마커 개발에 활용이 되고 있다(Krishnan et al., 2005). 특히, FT-IR 스펙트럼은 스펙트럼상에 아미노산이나 단백질, 지방산, 그리고 탄수화물계통의 화합물 등 다양한 정보를 포함하고 있고 다변량 통계분석을 이용하면 신속하고 정확하게 품종 구분할 수 있다(Gallardo-Velázquez et al., 2009). FT-IR 분석 기술을 이용하여 미생물종의 유연관계를 식별하고(Goodacre et al., 1998; Timmins et al., 1998; Wenning et al., 2002), 돌연변이 선발(Chen et al., 1998; Stewart et al. 1997), 고등식물의 종 구분(Kim et al., 2004), 두과작물 품종 식별(Song et al., 2012) 등에 활용이 가능하다고 보고된 바 있다

따라서 본 연구는 FT-IR 스펙트럼의 데이터에 다변량통계분석 기법을 이용하여 제주특별자치도에서 재배될 수 있는 아티초크 10 품종의 대사체 수준에서 신속한 품종 식별 체계를 확립하고, 우수한 계통 선발을 위한 품종 식별 기술을 구축하고자 한다.

재료 및 방법

식물재료

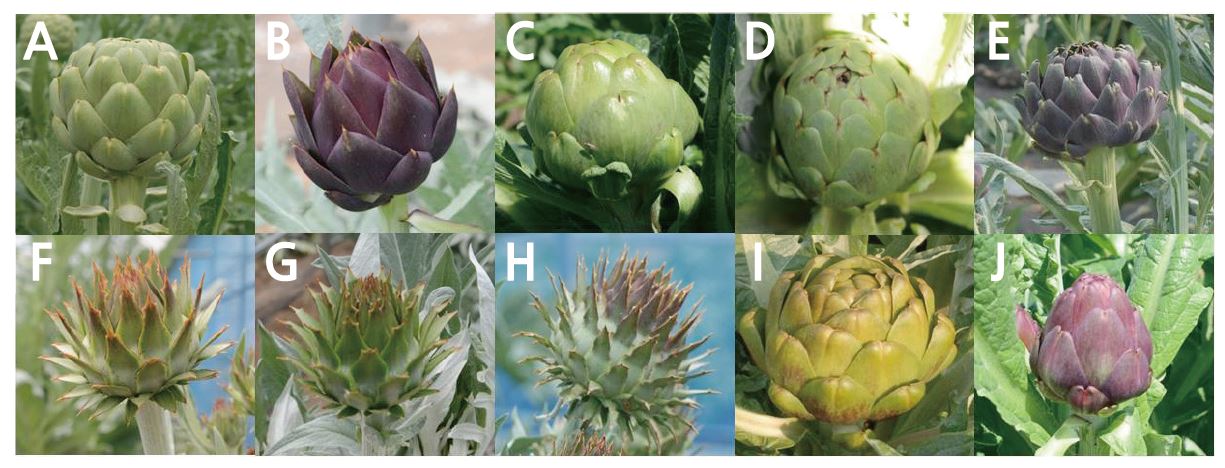
본 연구는 국립원예특작과학원 온난화대응농업연구소에서 포장 내 무가온하우스에서 재배되고 있는 아티초크(Cynara cardunculus var. scolymus L.) 10종의 품종을 사용하였다. 연구에 사용된 아티초크는 고정종인 ‘Green Globe’, ‘Violettodi chioggia’, ‘Nun 4011 AR’, ‘Madrigal’, ‘Tempo’, ‘Romagna’, ‘Intentid’, ‘Cardoon’, ‘Imperial Star’ 그리고 ‘Opera’으로 8말에 파종하여 9월말에 정식하였고, 4월말에 각 품종별 5개의 라인 잎을 3반복으로 시료를 준비하여 대사체 분석에 이용하였다(Fig. 1). 각각의 잎 시료는 동결건조하여 막자와 막자사발을 이용하여 분말 형태로 분쇄하였다. 분쇄된 잎 시료는 -70℃ 초저온냉동고에 보관하여 사용하였다.

http://static.apub.kr/journalsite/sites/kshs/2016-034-02/N0130340213/images/figure_KSHS_34_02_13_F1.jpg

Fig. 1. Artichoke (Cynara cardunculus var. scolymus L.) plants used in this study. (A) Green Globe, (B) Violetto di Chioggia, (C) Nun 4011 AR, (D) Madrigal, (E) Tempo, (F) Romagna, (G) Intentid, (H) Cardoon, (I) Imperial Star, (J) Opera.

아티초크 whole-cell 추출물 제조

1.5mL Eppendorf tube에 10종의 아티초크 잎 시료 분말 20mg을 넣고 20%(v/v) methanol 200μL을 첨가하여 시료와 용액이 잘 섞이도록 vortexing하였다. 준비된 시료는 50℃ water bath에서 20분간 추출하였고, 추출된 시료는 13,000rpm에서 15분간 원심분리하였다. 원심분리 후 상층액을 새로운 tube에 옮기고, 추출물 찌꺼기를 완전히 제거하기 위해 다시 한번 13,000rpm에서 5분간 원심분리하여 상층액을 새로운 tube로 옮겼다. FT-IR 스펙트럼 분석에 사용하기 위해 추출된 추출물은 −20℃에서 냉동 보관하여 사용하였다(Song et al., 2014).

FT-IR 스펙트럼과 데이터 전처리 및 다변량 통계분석

FT-IR(Fourier transform infrared) 스펙트럼 조사는 Tensor 27(Bruker Optics GmbH, Ettlingen, Germany)과 DTGS(Deuterated triglycine sulfate) 검출기를 사용하였다(Song et al., 2014). 추출된 각각의 시료는 5μL씩 3반복으로 384-well ZnSe plate에 분주하여, 37℃ hot plate에서 약 20-30분간 건조한 후 HTS-XT (Bruker Optics GmbH) 고효율 자동화 장치를 이용하여 스펙트럼을 측정하였다. 스펙트럼은 4000-400cm-1 범위에서 4cm-1 간격으로 128회 반복 측정되었고, 측정된 스펙트럼의 평균 스펙트럼을 분석에 사용하였다. Bruker 에서 제공하는 OPUS Lab(ver. 6.5, Bruker Optics Inc.)를 사용하여 FT-IR 스펙트럼 조사 및 데이터 변환을 하였고, baseline 교정을 위해 FT-IR 스펙트럼 분석 영역의 양 끝점(800-1800cm-1)의 흡광도를 0으로 조정하였다. 실험상의 오차를 최소화하기 위하여 각 스펙트럼을 동일 면적으로 normalization을 실시하였으며, mean centering 과정을 거쳐 2차 미분하여 스펙트럼의 전처리 과정을 실시하였다.

가공된 FT-IR 스펙트럼 데이터는 NIPALS 알고리즘(Wold, 1966)을 이용하여 R 프로그램(version 3.1.2)을 사용하여 PCA(Principal component analysis)와 PLS-DA(Partial least squares discriminant)분석을 수행하였다(Fiehn et al. 2000; Trygg et al. 2007). PCA 및 PLS-DA 분석을 통해 얻어진 score를 이용하여 HCA(hierarchical clustering analysis) 분석하였으며 유사도 지수로 UPGMA(unweighted pair group method with arithmetic mean analysis)를 사용한 Euclidean distance를 측정하여 각 시료의 유연관계를 덴드로그램으로 나타냈다

결과 및 고찰

주요 아티초크의 FT-IR 스펙트럼 비교 분석

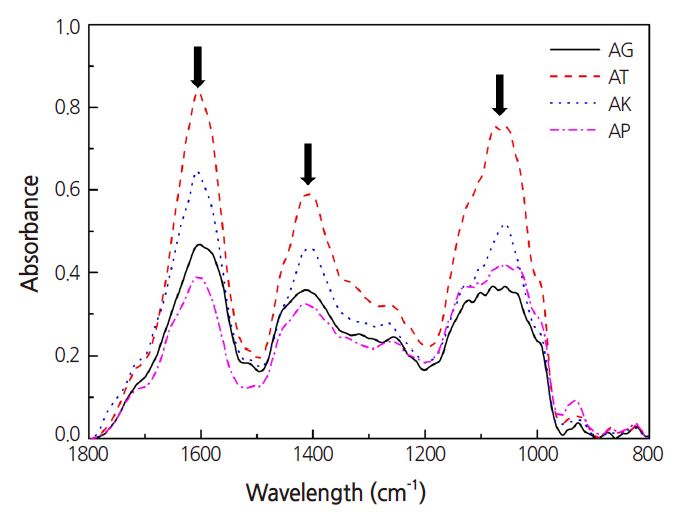
아티초크로부터 전세포추출물의 FT-IR 스펙트럼 데이터는 다변량통계분석을 통해 아티초크 작물의 대사체 수준에서 유연관계를 규명하고 품종 식별을 분석하였다. ‘Green Globe’, ‘Violetto di chioggia’, ‘Nun 4011 AR’, ‘Madrigal’, ‘Tempo’, ‘Romagna’, ‘Intentid’, ‘Cardoon’, ‘Imperial Star’ 그리고 ‘Opera’ 등 아티초크 작물들은 FT-IR 스펙트럼상에서 대사체의 양적, 질적 패턴 변화가 나타났다(1700-1500, 1500-1300, 1100-950cm-1)(Fig. 2). FT-IR 스펙트럼의 1700-1500, 1500-1300, 1100-950cm-1 주요 부위는 각각 특정 화합물들을 나타내는데, 주로 Amide I 과 II을 포함하는 아미노산 및 단백질계열의 화합물들의 질적, 양적 정보를 나타내고(P = O, C = O, N-H, C-C 그리고 C = C), phosphodiester group을 포함한 핵산 및 인지질의 정보가 반영이 되고(CH2와 P = O), 단당류나 복합 다당류를 포함하는 carbohydrates 계열의 화합물들이 질적, 양적정보가 반영(C-O, C-C 그리고 C-O-C)되어 나타낸다(Parker, 1983; Dumas and Miller, 2003; Wolkers et al., 2004; Yee et al., 2004; D’Souza et al., 2008; Lopez-Sanchez et al., 2010). 이처럼 FT-IR 스펙트럼 상의 질적, 양적 차이가 아티초크 품종이 함유하고 있는 아미노산이나 단백질, 지방산, 그리고 탄수화물계통의 화합물들의 질적, 양적 차이가 현저하게 나타남을 의미한다. 따라서, FT-IR 스펙트럼 분석은 아티초크의 주요 대사체의 질적, 양적 변화를 분석하여 계통 선발 수단으로 신속한 활용이 가능할 것이다.

http://static.apub.kr/journalsite/sites/kshs/2016-034-02/N0130340213/images/figure_KSHS_34_02_13_F2.jpg

Fig. 2. Representative FT-IR spectral from artichoke leaves of main cultivar. FT-IR spectral ranges showed quantitative information of protein/amide I, II (1500-1700 cm-1), phosphodiester group (1300-1500 cm-1), and sugar compound (950-1100 cm-1). AG, Green Globe; AT, Tempo; AK, Cardoon; AP, Imperial Star. *n = 3

FT-IR 스펙트럼 다변량 통계분석 및 대사체 수준 유연관계 비교

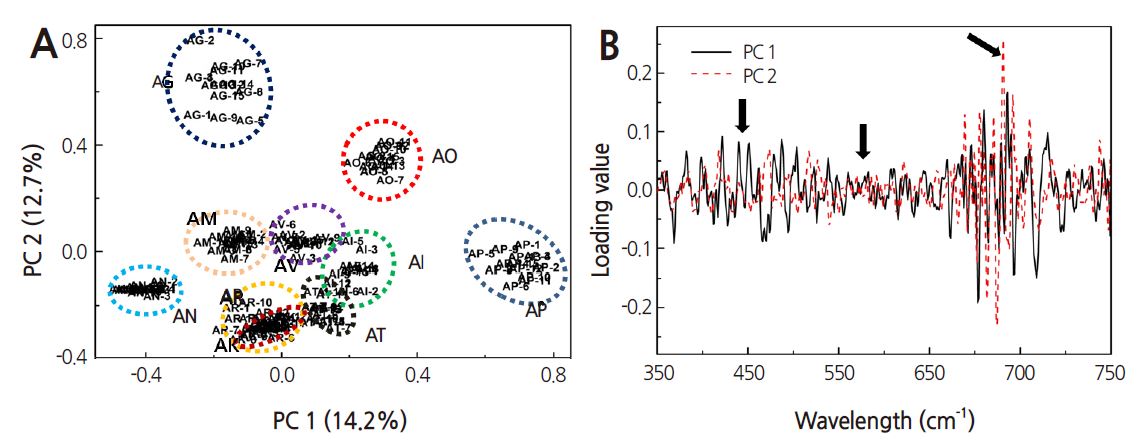
10품종 아티초크의 FT-IR 스펙트럼 데이터를 PCA 분석한 결과 PC 1과 2의 설명력이 14.2%와 12.7%로 각각 나타났다(Fig. 3A). 전체 아티초크 품종 중 ‘Romagna’와 ‘Cardoon’ 품종이 대사체 수준에서 유사성이 높게 나타났고, 두개의 아티초크 품종을 제외한 나머지 품종들은 각각의 그룹을 형성하였다. 하측으로 ‘Romagna’와 ‘Cardoon’를 중심으로 ‘Nun 4011 AR’, ‘Madrigal’, ‘Violetto di chioggia’, Intentid’ 그리고 ‘Tempo’ 품종이 분포하면서 각각의 그룹을 형성하고 있고, 외각으로 ‘Green Globe’, ‘Opera’ 그리고 ‘Imperial Star’가 그룹을 형성하여 나타났다. 이처럼, ‘Romagna’, ‘Cardoon’, ‘Nun 4011 AR’, ‘Madrigal’, ‘Violetto di chioggia’, ‘Intentid’ 그리고 ‘Tempo’가 대사체 정보가 비슷한 것으로 판단되고, ‘Green Globe’, ‘Opera’ 그리고 ‘Imperial Star’ 품종과는 차이를 나타냈다. 또한, 아티초크 품종 중에서 가장 많이 재배되고 있는 ‘Green Globe’와 ‘Cardoon’이 상, 하로 분포하는 것으로 보아 서로 다른 대사체 수준에서도 품종 분류가 가능할 것으로 판단된다. 두과작물에서도 PCA 분석을 통해 대사체 수준에서 계통 분류가 이뤄졌고(Song et al., 2012), 아프리칸 얌 또한 품종간 분류가 가능하다고 보고되었다(Song et al., 2014). 이 결과들은 아티초크 10개의 품종 중에서 ‘Cardoon’과 ‘Green Globe’가 계통분류학적으로 유연관계가 낮고, 서로간에 대사체 수준의 차이가 뚜렷하게 나타나는 것으로 보아 대사체 수준에서 마커 탐색에 가장 중요한 품종으로 작용할 것으로 판단된다

10품종 아티초크의 대사체 수준 식별에 중요하게 작용한 FT-IR 스펙트럼 부위를 확인하였다(Fig. 3B). FT-IR loading value를 확인한 결과, PC 1과 2를 분류하는 중요한 기준은 1650-1550과 1100-950cm-1 부위임을 알 수 있었다(Fig. 3B). 1650-1550과 1100-950cm-1 부위는 FT-IR 스펙트럼상에서 차이를 나타냈던 부위(Fig. 2)와 일치하였고, 이 부위가 나타내는 amide I, II와 carbohydrates 계열의 화합물들이 양적, 질적 차이를 보이면서 아티초크 대사체 수준 식별에 가장 중요한 역할을 하는 것으로 알 수 있었다(Schulz and Baranska, 2007)(Fig. 3B).

http://static.apub.kr/journalsite/sites/kshs/2016-034-02/N0130340213/images/figure_KSHS_34_02_13_F3.jpg

Fig. 3. PCA score plot (A) and loading value plot (B) of PCA analysis from FT-IR data of artichoke leaf. Dotted shapes represent significant FT-IR spectral region for metabolic discrimination of each artichoke plant. AG, Green Globe; AI, Intentid; AK, Cardoon; AM, Madrigal; AN, Nun 4011 AR; AO, Opera; AP, Imperial Star; AR, Romagna; AT, Tempo; AV, Violetto di chioggia.

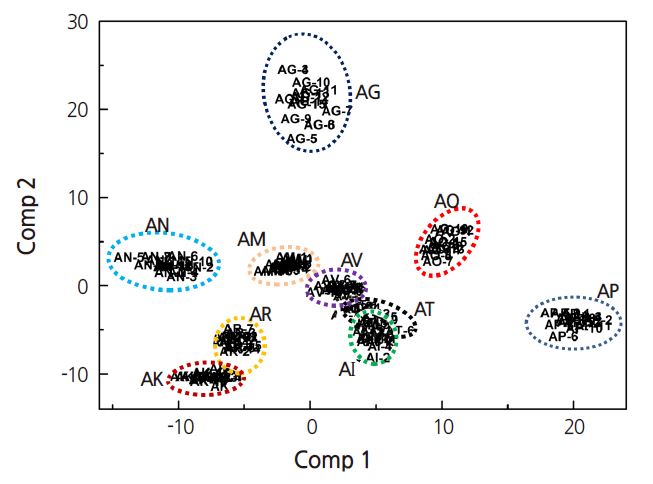
PLS-DA 분석의 경우 PCA 분석 보다 아티초크의 종간 식별이 뚜렷하게 나타났다(Fig. 4). PLS-DA score plot을 보면 Violetto di chioggia’, ‘Tempo’, ‘Intentid’ 그리고 ‘Madrigal’ 4품종이 중앙에 그룹을 형성하면서 4개의 품종이 비슷한 대사체 정보를 나타내는 것으로 판단된다. 또한, ‘Cardoon’과 ‘Green Globe’가 뚜렷하게 나눠졌고, ‘Romagna’와 ‘Nun 4011 AR’ 품종이 ‘Cardoon’ 품종과 가까이에 위치하면서 ‘Romagna’와 ‘Nun 4011 AR’ 품종이 ‘Cardoon’ 품종과 유사한 품종임을 알 수 있었다(Fig. 4). 10품종의 아티초크 중에서 ‘Imperial Star’ 품종이 가장 멀리 단독으로 그룹을 형성하는 것으로 보아 ‘Cardoon’과 ‘Green Globe’ 품종과는 다른 대사체 정보를 나타냄을 알 수 있었다(Fig. 4). 이 결과, FT-IR 스펙트럼 데이터를 이용한 PLS-DA 분석으로 아티초크 간의 종 구분이 가능함을 알 수 있었다

http://static.apub.kr/journalsite/sites/kshs/2016-034-02/N0130340213/images/figure_KSHS_34_02_13_F4.jpg

Fig. 4. PLS-DA score plot of FT-IR data from artichoke leaf. Dotted shapes represent significant FT-IR spectral region for metabolic discrimination of each artichoke plant. AG, Green Globe; AI, Intentid; AK, Cardoon; AM, Madrigal; AN, Nun 4011 AR; AO, Opera; AP, Imperial Star; AR, Romagna; AT, Tempo; AV, Violetto di chioggia.

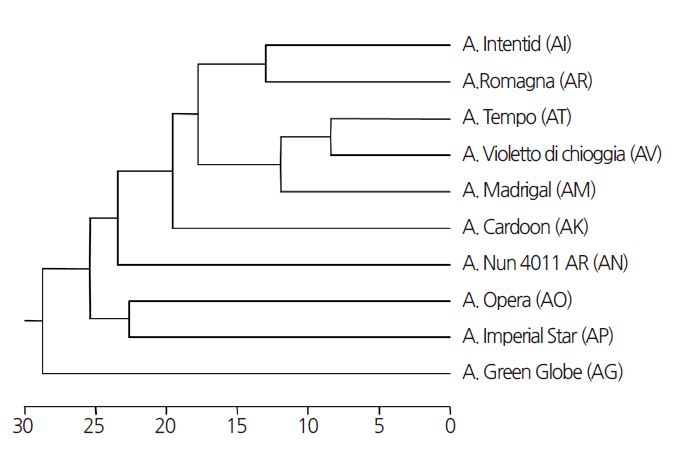
HCA dendrogram 분석 결과를 보면 ‘Cardoon’ 품종이 중앙에 위치하고, ‘Green Globe’ 품종이 가장 아래쪽으로 나타나는 것을 볼 수 있다(Fig. 5). 또한, ‘Tempo’, ‘Violetto di chioggia’와 ‘Madrigal’품종이 유연관계가 높고, ‘Opera’와 ‘Imperial Star’ 품종, ‘Intentid’와 ‘Romagna’ 품종이 각각 높은 유연관계를 형성하는 것으로 나타났다. 하지만, 중앙에 ‘Cardoon’과 ‘Nun 4011 AR’ 품종이 위치하고 ‘Green Globe’ 품종이 아래쪽으로 나타나면서 이 3개의 품종을 이용하면 대사체 분석을 통한 품종 분류가 가능할 것으로 판단되다. 이상의 연구 결과로 판단할 때 아티초크의 FT-IR 스펙트럼 다변량통계분석을 이용한 대사체수준에서 아티초크의 품종 구분이 가능함을 알 수 있었다. 또한, 현재까지 대사체 분석을 통해 아티초크에서 품종 구분을 실시한 경우가 없어 비교가 불가능하지만, 다른 작물에서는 대사체 분석을 통해 품종 식별을 한 사례가 보고되어 있다. 특히, 두과작물에서 식물 종 구분이 가능하다고 보고되었다(Song et al., 2012). 두과작물의 경우 품종간 대사체 수준에서 FT-IR 스펙트럼의 질적, 양적 차이가 품종을 구분하는데 중요한 역할을 하고, 이 FT-IR 스펙트럼의 부위들이 아티초크에서 중요하게 작용한 FT-IR 스펙트럼과 일치하는 것을 볼 수 있다. 또한, 바위솔에서 FT-IR 스펙트럼 데이터를 이용한 PLS 분석이 종간 유연관계가 개체간에 대사물질에 대한 차이를 알 수 있었고, 분류학적 유연관계가 거의 일치하고, 92.9% 높은 예측의 정확도를 나타났다고 보고된 바 있다(Kim et al., 2011). 그리고 아프리칸 얌에서도 대사물질과 기능성성분이 관계가 높다고 보고된 바 있다(Song et al., 2014).

http://static.apub.kr/journalsite/sites/kshs/2016-034-02/N0130340213/images/figure_KSHS_34_02_13_F5.jpg

Fig. 5. Hierarchical dendrogram of FT-IR data from artichoke leaf. AG, Green Globe; AI, Intentid; AK, Cardoon; AM, Madrigal; AN, Nun 4011 AR; AO, Opera; AP, Imperial Star; AR Romagna; AT, Tempo; and AV, Violetto di chioggia.

따라서 본 연구에서 확립된 대사체 수준에서 아티초크의 품종 식별 기술은 품종, 계통의 신속한 선발 수단으로 활용이 가능할 것으로 기대되며 육종을 통한 품종개발 가속화에 기여 할 수 있을 것으로 예상된다.

Acknowledgements

본 논문은 농촌진흥청 연구과제(과제번호: PJ009393) 지원에 의해 이루어진 것임.

References

1
Acquadro A, Portis E, Lee D, Donini P, Lanteri S (2005) Development and characterization of microsatellite markers in Cynara cardunculus L. Genome 48:217-225. doi:10.1139/g04-111
2
Adzet T, Puigmacia M (1985) High-performance liquid chromatography of caffeoylquinic acid derivatives of Cynara scolymus L. leaves. J Chromatogr 348:447-452. doi:10.1016/S0021-9673(01)92486-0
3
Chen L, Carpita NC, Reiter WD, Wilson RH, Jeffries C, McCann MC (1998) A rapid method to screen for cell-wall mutants using discriminant analysis of Fourier transform infrared spectra. Plant J 16:385-392. doi:10.1046/j.1365-313x.1998.00301.x
4
D'Souza L, Devi P, Shridhar MPD, Naik CG (2008) Use of Fourier Transform Infrared (FTIR) Spectroscopy to Study Cadmium-Induced Changes in Padina Tetrastromatica (Hauck) Anal. Chem Insights 3:135-143
5
Dumas P, Miller L (2003) The use of synchrotron infrared microspectroscopy in biological and biomedical investigations. Vib Spectrosc 32:3-21. doi:10.1016/S0924-2031(03)00043-2
6
Fiehn O, Kopka J, Drmann P, Altmann T, Trethewey R, Willmitzer L (2000) Metabolite profiling for plant functional genomics. Nat Biotechnol 18:1157-1161. doi:10.1038/81137
7
Francisco AA, Pedro GV (2003) The health and nutritional virtues of artichokes: from folklore to science. Acta Hortic 660:25-31. doi:10.17660/ActaHortic.2004.660.1
8
Gallardo-Velázquez T, Osorio-Revilla G, Loa MZ, Rivera-Espinoza Y (2009) Application of FTIR-HATR spectroscopy and multivariate analysis to the quantification of adulterants in Mexican honeys. Food Res Int 42:313-318. doi:10.1016/j.foodres.2008.11.010
9
Goodacre R, Timmins EM, Burton R, Kaderbhai N, Kell DB, Rooney PJ (1998) Rapid identification of urinary tract infection bacteria using hyperspectral whole-organism fingerprinting and artificial neural networks. Microbiology 144:1157-1170. doi:10.1099/00221287-144-5-1157
10
Kim SW, Ban SH, Chung H, Cho SH, Chung HJ, Choi PS, Yoo OJ, Liu JR (2004) Taxonomic discrimination of higher plants by multivariate analysis of Fourier transform infrared spectroscopy data. Plant Cell Rep 23:246-250. doi:10.1007/s00299-004-0811-1
11
Kim SW, Kwon YK, Seo JM, Woo TH, Liu JR (2011) Prediction and discrimination of taxonomic relationship within Orostachys species using FT-IR spectroscopy combined by multivariate analysis. J Plant Biotechnol 38:9-14. doi:10.5010/JPB.2011.38.1.009
12
Krishnan P, Kruger NJ, Ratcliffe RG (2005) Metabolite fingerprinting and profiling in plants using NMR. J Exp Bot 56:255-265. doi:10.1093/jxb/eri010
13
Lanteri S, Acquadro A, Comino C, Mauro R, Mauromicale G, Portis E (2006) A first linkage map of globe artichoke (Cynara cardunculus var. scolymus L.) based on AFLP, S-SAP, M-AFLP and microsatellite markers. Theor Appl Genet 112:1532-1542. doi:10.1007/s00122-006-0256-8
14
Lopez-Sanchez M, Ayora-Canada MJ, Molina-Diaz A (2010) Olive fruit growth and ripening as seen by vibrational spectroscopy. J Agric Food Chem 58:82-87. doi:10.1021/jf902509f
15
Parker FS (1983) Applications of infrared, Raman and resonance Raman spectroscopy in biochemistry. Plenum Press, NY, USA
16
Portis E, Scaglione D, Acquadro A, Mauromicale G, Mauro R, Knapp SJ, Lanteri S (2012) Genetic mapping and identification of QTL for earliness in the globe artichoke/cultivated cardoon complex. BMC Res Notes 5:252. doi:10.1186/1756-0500-5-252
17
Schulz H, Baranska M (2007) Identification and quantification of valuable plant substances by IR and Raman spectroscopy. Vib Spectrosc 43:13-25. doi:10.1016/j.vibspec.2006.06.001
18
Seong KC, Kim CH, Lee JS, Um YC, Kang KH (2008) Selection of Artichoke (Cynara scolymus L.) for Non-Heated Cultivation in Jeju Island. J Bio-Environ Control 17:293-296
19
Song SY, Ha TJ, Jang KC, Kim IJ, Kim SW (2012) Establishment of rapid discrimination system of leguminous plants at metabolic level using FT-IR spectroscopy with multivariate analysis. J Plant Biotechnol 39:121-126. doi:10.5010/JPB.2012.39.3.121
20
Song SY, Jie EY, Ahn MS, Kim DJ, Kim IJ, Kim SW (2014) Discrimination of african yams containing high functional compounds using FT-IR fingerprinting combined by multivariate analysis and quantitative prediction of functional compounds by PLS regression modeling. Korean J Hortic Sci Technol 32:105-114. doi:10.7235/hort.2014.13094
21
Stewart D, Yahiaoui N, McDougall GJ, Myton K, Marque C, Boudet AM, Haigh J (1997) Fourier-transform infrared and Raman spectroscopic evidence for the incorporation of cinnamaldehydes into the lignin of transgenic tobacco (Nicotiana tabacum L.) plants with reduced expression of cinnamyl alcohol dehydrogenase. Planta 201:311-318. doi:10.1007/s004250050072
22
Timmins ÉM, SHowell SA, Alsberg BK, Noble WC, Goodacre R (1998) Rapid differentiation of closely related Candida species and strains by pyrolysis-mass spectrometry and Fourier transform-infrared spectroscopy. J Clin Microbiol 36:367-374
23
Trygg J, Holmes E, Londstedt T (2007) Chemometrics in metabonomics. J Proteomes Res 6:467-479. doi:10.1021/pr060594q
24
Wang M, Simon JE, Aviles IF, Zheng Q, Tadmor Y (2003) Analysis of antioxidative phenolic compounds in artichoke (Cynara scolymus L.). J Agric Food Chem 51:601-608. doi:10.1021/jf020792b
25
Wenning M, Seiler H, Scherer S (2002) Fourier-transform infrared microspectroscopy, a novel and rapid tool for identification of yeasts. Appl Environ Microbiol 68:4717-4721. doi:10.1128/AEM.68.10.4717-4721.2002
26
Wold H (1966) Estimation of principal components and related models by iterative least squares. In KR Krishnaiah, ed, Multivariate Analysis. Academic Press, NY, USA, pp 391-420
27
Wolkers WF, Oliver AE, Tablin F, Crowe JH (2004) A fourier transform infrared spectroscopy study of sugar glasses. Carbohydr Res 339:1077-1085. doi:10.1016/j.carres.2004.01.016
페이지 상단으로 이동하기