Introduction
Materials and Methods
Experimental Plant Material and Mineral Nutrition Supply
Plant Environmental Condition
Plant Growth Measurements
Evaluation of Total Phenol Content and Antioxidant Capacity
Analysis of Total Phenolic Compounds
Statistical analysis
Results and Discussion
Plant Growth Parameters
Introduction
Carrots are one of the most extensively cultivated vegetables in the world. The total production of carrots in Jeju Island, Korea, is approximately 50%, with crop cultivation mainly in the winter season (KOSIS, 2015). It is well known that carrot roots contain many functional components, including vitamins A, C, E, B1, B2, and B6, α-carotene, β-carotene (the precursor of vitamin A), and rutin (Shin and Bae, 2001; Lee et al., 2015). Carrot leaves also contain functional components such as fatty acids. It has been reported that unsaturated fatty acids are mainly contained in green vegetables (Almeida et al., 2009). Carrot leaves are consumed in the form of dry tea which does not make full use of their nutritional value.
Plant factories are systems whereby control is exerted over the environmental factors necessary for plant growth, such as light, temperature, humidity, carbon dioxide (CO2), and mineral nutrient composition. These controlled environments enable rapid, year-around mass production of crops (Cha et al., 2012). Recently, the number of crops grown in plant factories has been gradually increasing, with the majority of crops produced being leafy vegetables such as ice plant (Cha et al., 2014) and sowthistle (Qin et al., 2008; Cho et al., 2012). However, plant factories are not universally applicable because of the associated high running costs. In recent years, the adoption of fusion technologies that integrate automation technology into agriculture has increased (Lee and Cha, 2015). In addition, as climate change is threatening the stable production of agricultural crops, there is a growing interest in alternative means of cultivation (Heo et al., 2010; Lee and Cha, 2015; Lee et al., 2016).
As a consequence of global warming, changes in the water temperature of the equatorial oceans are now causing anomalous climate conditions worldwide (Neelin, 1990). Recent years have seen an increase in the frequency of El Nino events, and the World Meteorological Organization has indicated that 2016 was the hottest year in the history of meteorological observations. In addition, the Korea Meteorological Administration has stated that the climate of Korea is changing as a consequence of the El Nino phenomenon (KMA, 2016), with winters tending to be warmer and wetter compared to that in previous years. Such changes have important implications for crop cultivation.
Under optimal growth conditions, plants grow rapidly throughout the year and do not display negative responses to unfavorable environmental conditions. Moreover, it is possible to exert environmental control in a purposeful manner so as to produce not only high yielding but also high quality crops (Morimoto et al., 1995). Plant factories are mainly based on hydroponics systems because these minimize external pollution. In general, the optimum culture concentration for the production of leafy vegetables during hydroponic cultivation is equivalent to an electrical conductivity (EC) of approximately 1.0-2.0 dS·m-1. When plants are grown in an optimal environment, their growth rate tends to be faster compared to that of plants grown under normal growth conditions. Therefore, it is desirable that the culture nutrient solution concentration is maintained at an optimum level for plant growth and development. Ikeda et al. (1992) reported that the growth rate of lettuce grown under optimal conditions was eight times faster than that under normal conditions. This rapid growth rate is a major cause of physiological disorders related to mineral nutrition (Ikeda et al., 1992; Um et al., 2010).
For the successful cultivation of crops in plant factories, experiments have been conducted on the appropriate plant density, the composition and concentration of culture nutrient solutions, the economic efficiency of crops, and the appropriate amount of light (Cha et al., 2012; Cha et al., 2014). In this study, we accordingly sought to determine the appropriate concentration of culture nutrient solution for the cultivation of carrot leaves growing in a fully controlled environment.
Materials and Methods
Experimental Plant Material and Mineral Nutrition Supply
The plant material used was carrot cultivar ‘Yangmyeon 5 chon’ (KOREGON Co., Korea). The experiment was conducted from April 18, 2016 to May 20, 2016. Seeds were sown in a urethane sponge (2.5 × 2.5 × 2.5 cm) and seedlings were transplanted to a growing bed once two leaves had emerged. The hydroponic culture system consisted of a three-layer thin-film hydroponic (NFT) system (240 × 60 × 200 cm: L × W × H) with a tank volume of 110 L and a culture volume of 90 L. The supply of mineral nutrition was started when the true leaves had emerged, and the pH and EC of the culture nutrient solution were measured every 1 to 2 d and adjusted as necessary.
Plant Environmental Condition
Light intensity was measured by using a quantum sensor (LI-190; Li-cor, Lincoln, Nebraska, USA). The temperature and relative humidity were measured using a temperature and relative humidity sensor (HMP45AC; Campbell Scientific, Logan UT, USA), and CO2 concentration was measured using a CO2 sensor (GMP222, Vaisala, Helsinki, Finland) (Fig. 1). Temperature and relative humidity in the plant factory were controlled by an ON/OFF system using a controller (SDM-CD16AC, Campbell Scientific, Logan UT, USA). The temperature was maintained at 20-26°C using an air conditioner (HP-N239L; Samsung Electronics Co., Ltd., Korea) and heaters (HV-7800; Hanvit System Co., Ltd., Korea, and NH-5; Hwajeun Eng., Korea), and humidity was controlled using a dehumidifier (SG-M220S-4; Shinan Green-Tech Co., Ltd., Korea).
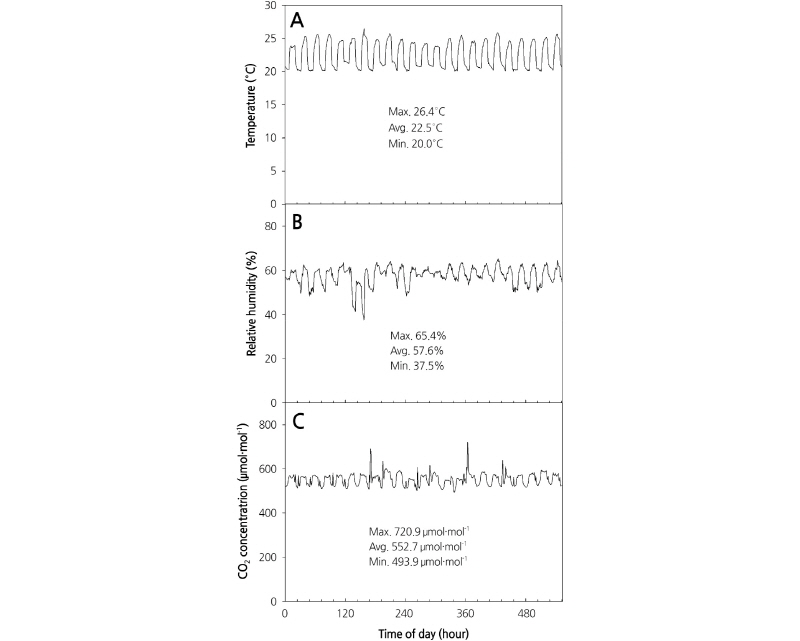
CO2 concentrations were maintained at 500-720 μmol·mol-1 using underground air (Kim et al., 2007). An air circulation fan (SGA-120, Shinan Green-Tech Co., Ltd., Korea) was used to maintain the air flow. A sensor was installed 1.5 m from the bottom and CO2 concentration was controlled according to a set value using the average of value measured at three plant factories. Light intensity, temperature, relative humidity, and CO2 concentration data were collected for 10 min every hour using a data collection device (CR-1000; Campbell Scientific, Logan UT, USA). The composition of culture nutrient solution used was a developmental medium prepared by analyzing the plants and adjusting the cation ratio.
Plant Growth Measurements
Leaf length, leaf area, plant fresh weight, and plant dry weight were measured for plants grown in each concentration of culture nutrient solution. Roots developed in the form of fibrous roots rather than a single taproot, and therefore root data were omitted.
Evaluation of Total Phenol Content and Antioxidant Capacity
Carrot shoots were collected on 33 days after the initiation of treatment and the leaves were lyophilized. The lyophilized samples were thereafter stored in a dark incubator at 4°C until analysis. Total phenolic content was determined by using a slightly modified Folin-Ciocalteu method (Ainsworth and Gillespie, 2007). The lyophilized samples were ground into a powder and samples (approximately 4 mg, 5 replicates) were mixed with 4 mL of 80% acetone and sonicated for 15 min (Sk5210HP; Hangzhou Nade Scientific Instruments, Zhejiang, China). The extract solution was maintained under dark conditions at 4°C for 12 h and then centrifuged at 3,000 × g for 2 min. The supernatant of the sample was used for analysis. The subsequent procedure followed that described by Lee and Oh (2015). The unit is expressed as gallic acid-equivalent (mg) per gram of dry weight (mg GAE/g DW). Antioxidant activity was measured using 2,2′-azino-bis (3-ethylbenzothiazoline- 6-sulfonic acid) (ABTS; Sigma-Aldrich, St. Louis, Mo., USA) (Miller and Rice-Evans, 1996). The solution extracted with 80% acetone was treated at -20°C for 12 h. The subsequent process followed that described by Lee and Oh (2015). A standard curve was prepared using 6-hydroxy-2,5,7,8-tetramethylchroman-2-carboxylic acid (Trolox; Sigma-Aldrich, St. Louis, Mo., USA) and the used unit was Trolox-equivalent antioxidant capacity (mM) per dry weight (mM TEAC·g-1 DW).
Analysis of Total Phenolic Compounds
A sample of lyophilized material (approximately 0.1 g, 5 replicates) was mixed with 1.5 mL of acetonitrile containing 0.5% HCl and hydrolyzed in a water bath at 80°C. The hydrolyzed solution was then subjected to ultrasonic extraction for 30 min (Sk5210HP; Hangzhou Nade Scientific Instruments, Zhejiang, China). The extract solution was then centrifuged at 3,000 × g for 20 min and the supernatant was filtered using a 0.22 μm syringe filter (Noble Bio, Hwaseong, Korea). Polyphenol compounds in the extract solution were analyzed using a high-performance liquid chromatograph system (YL9100; Younglin, Anyang, Korea). The polyphenol compounds were isolated using an ACE-5-AQ column (4.6 × 250 mm; Advanced Chromatography Technologies Ltd., Reading, UK) equipped with a guard column. The column temperature was 30°C and the injection volume was 10 μL. Solvents A and B were water containing 100% acetonitrile and 0.5% acetic acid, respectively. The solution gradient conditions were as follows: solvent A acetonitrile 0-10% (10 min), 10-20% (30 min), 20-30% (40 min), 30-40% (50 min), 40-80% (60 min), 80-0% (61 min), and 0-0% (70 min). The flow rate was 0.8 mL·min-1 and the absorbance was measured at 320 nm using standard chlorogenic acid (Sigma-Aldrich, St. Louis, MO, USA) and kaempferol (Sigma-Aldrich, St. Louis, Mo., USA). The units were expressed in mg per 100 g of dry weight (mg/100 g DW).
Statistical analysis
The experimental design was a randomized block design and statistical analysis was performed using the SAS statistical package (Statistical Analysis, Ver. 9.3, Cary, NC, USA). Significance was determined using Duncan’s multiple rage test (DMRT) at a 95% confidence level.
Results and Discussion
Plant Growth Parameters
Changes in the fresh and dry weights of carrot shoots at 14 and 23 days after planting (DAP) are shown in Fig. 2. Although carrot shoot fresh and dry weights at 14 DAP were unchanged by growing under varying concentrations of culture nutrient solution (Fig. 2A and 2B), significant differences were observed among different treatments at 23 DAP. Fresh and dry weight were highest in plants grown in the EC 3.0 dS·m-1 culture nutrient solution, whereas there were no significant differences in the weights of plants grown in the EC 2.0 and EC 4.0 dS·m-1 solutions. These results are consistent with those previously reported for Eruca sativa L. (salad rocket), whereby a high concentration culture nutrient solution significantly affected growth (D’Anna et al., 2003). However, in contrast, endive grown under a high concentration of culture nutrient solution did display enhanced growth (Kowalczyk et al., 2016).
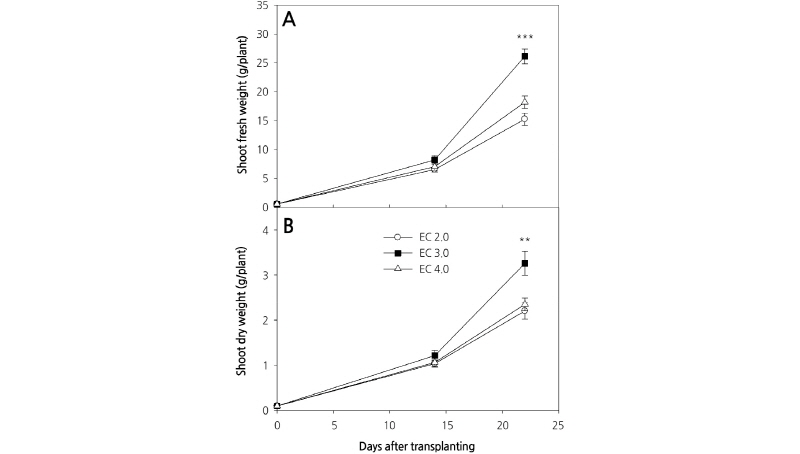
Previous experiments using a protected cultivation system indicated that the highest plant growth rate was obtained with a culture nutrient solution concentration of EC 1.0 dS·m-1. Moreover, plant growth rates were significantly lower with culture nutrient solution concentrations greater than EC 3.0 dS·m-1. However, our results indicate that the growth rate was highest at EC 3.0 dS·m-1, suggesting that the concentration of culture nutrient solution for optimal growth can differ according to the growing system used.
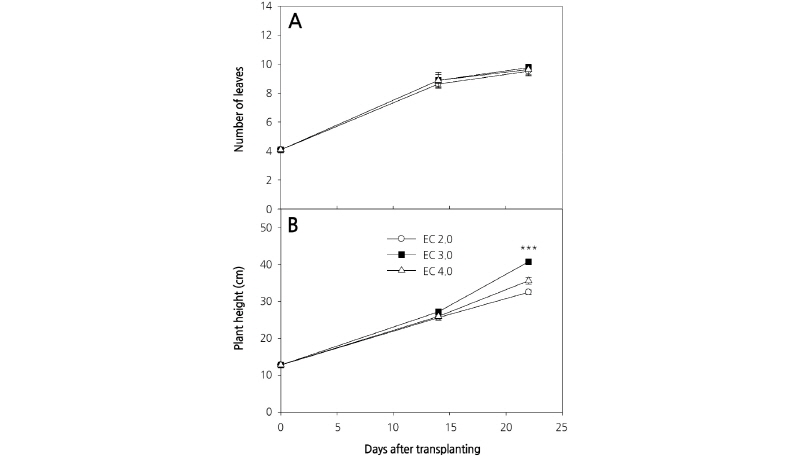
We observed an increase in the number of carrot leaves during the experimental period, although there were no significant differences among the three culture nutrient solution treatments (Fig. 3A). Plant heights between treatments also were not significantly different at 14 DAP; however, different culture nutrient solution treatments had a significant effect on plant height at 23 DAP (Fig. 3B). This result is in contrast to those of D’Anna et al. (2003), who reported that there was no difference in the heights of E. sativa plants grown in EC 2.8 dS·m-1 and EC 3.8 dS·m-1 culture nutrient solutions. Plant height is an important determinant of crop harvesting time in plant factories with limited cultivation space. Leaf area was comparable between treatments at 14 DAP; however, at 23 DAP, there was a significant difference in the leaf area of plants grown in the different culture nutrient solutions (Fig. 4). Comparable to shoot fresh weight, leaf area increased rapidly following 14 DAP and the greatest and least leaf area at 23 DAP was measured in those plants grown with EC 3.0 dS·m-1 and EC 2.0 dS·m-1 culture nutrient solutions, respectively. Preliminary experiments were conducted using an EC 1.0 dS·m-1 culture nutrient solution on the basis of greenhouse experiments; however, unlike in the greenhouse, the plants grown hydroponically displayed severe chlorosis. Therefore, the concentration of the culture nutrient solution was increased in this experiment (data not shown).
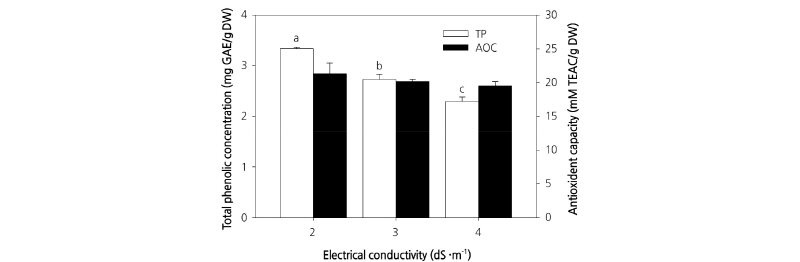
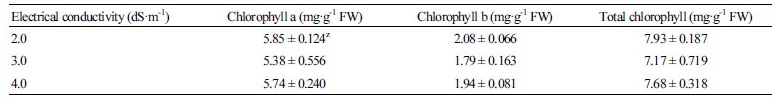
In contrast to previous experiments, we observed no significant differences in chlorophyll a, chlorophyll b, and total chlorophyll contents among plants treated with different culture nutrient solution concentrations (Table 1). Total phenol content was significantly different between plants grown under different culture nutrient solution treatments, with the highest content measured in plants grown in the EC 2.0 dS·m-1 culture nutrient solution (Fig. 5). However, as described above, the highest dry weight was obtained for plants grown in the EC 3.0 dS·m-1 culture nutrient solution. Therefore, the total phenol content would be affected based on differences in dry weight. Furthermore, in addition to being affected by culture nutrient solution concentration, total phenol content has been shown to increase with an increase in temperature (Sakamoto and Suzuki, 2015). In contrast to phenol content, the sulfur oxidizing ability representing antioxidant activity did not show any significant differences among the various EC treatments (Fig. 5). Recently, there have been a number of studies conducted on the antioxidant activities and functional components of different vegetable crops (Yu et al., 2006). In many preliminary studies, radical scavenging activity has been found to increase in proportion to polyphenol content (Park, 2000; Lee et al., 2005). Although the present study showed that total polyphenol content was highest with EC 2.0 dS·m-1, other studies have observed no difference in antioxidant activity among plants treated with culture nutrient solution of different concentrations. These results suggest that antioxidant activity remains relatively static from the beginning of plant growth to the end of harvest.
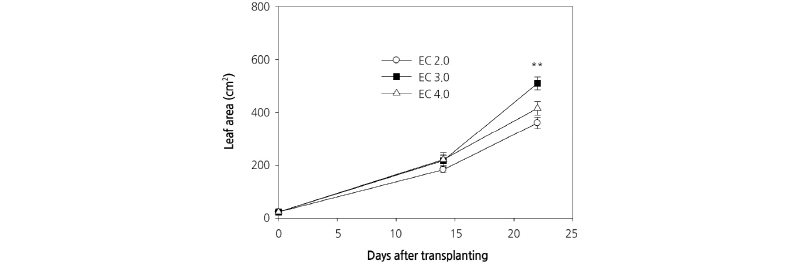
Table 1. Chlorophyll content of carrot leaves grown under different levels of electrical conductivity (EC) at 23 days after planting
 | |
zMean ± SE (n = 6). | |
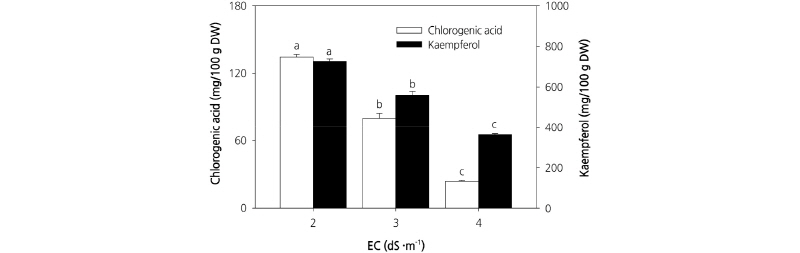
The results for chlorogenic acid and kaempferol content in response to different treatments are shown in Fig. 6. The contents of both chlorogenic acid and kaempferol were highest in plants grown at EC 2.0 dS·m-1 and lowest in plants grown at EC 4.0 dS·m-1. Chlorogenic acid is a polyphenolic compound formed through an ester bond between coffeic acid and quinic acid (Clifford, 2000). It is used as a preservative and flavoring agent that prevents the decay of food in container packages, and has be shown to contribute to the prevention of cancer and cardiovascular diseases caused by oxidative damage in vivo. Chlorogenic acid in the human diet is found primarily in coffee, potatoes, burdock, and sweet potato (Fang et al., 2005). However, here we observed that carrot leaves contain both chlorogenic acid and kaempferol, and thus have potential as a functional food. Although the phenol content per gram of dry weight was highest in plants grown under the EC 2.0 dS·m-1 treatment, it would be more appropriate to cultivate carrot at EC 3.0 dS·m-1 since plants grown at this concentration have a higher dry weight. The results of the present study indicate that an EC 3.0 dS·m-1 culture nutrient solution combined with a cultivation period of 20-25 d is optimal for cultivating carrot leaves in a plant factory. Carrot leaves grown under such conditions have potential as a functional food because they are rich in phenols.