

Introduction
Materials and Methods
Experimental Site and Plant Material
13CO2 Feeding Experiment
Separation of Carbohydrates and Determination of 13C Atom% in Carbohydrates
Gas Exchange Parameters and Chlorophyll Fluorescence Parameters Measurements
Statistical Analysis
Results
Seasonal Variation in δ13C in Different Organs on the Girdled Shoots
Seasonal Variation of δ13C, 13Camount, and 13CPCT in the Carbohydrates from Different Organs on the Girdled Shoots
Seasonal Variation of Leaf Photosynthetic Parameters
Analysis of the Correlation between Carbohydrate Assimilation and Photosynthetic Parameters in Leaves
Discussion
Characteristics of Carbohydrate Assimilation in Walnut
Characteristics of Carbohydrate Transport in Walnut
Characteristics of Carbohydrate Utilization in Walnut
Conclusions
Introduction
Photosynthates are the material and energy basis for biosphere formation and sustainable development (Xu, 2013). Plant photosynthates include many substances, such as oxygen, carbohydrates, lipids, and organic acids (Pan, 2001). Carbohydrates are the most important photosynthates that largely determine the synthesis of most other organic compounds in plants (Yuan et al., 2015), and their transportation and distribution play a key role in plant growth, development, and yield (Li et al., 2007). Change in the distribution pattern of carbohydrates in plant organs affects the relative growth rates of plant organs in a short time scale (Lacointe, 2000), whereas in a long time scale, it affects the leaf area index, rate of nutrient and water uptake by roots, carbon turnover of the roots, species composition of communities, etc. (Malhi et al., 2004). In other words, changes in the distribution of carbohydrates in plant organs and their influence on plant growth affects plant life cycle strategies, community structure, and evolutionary strategies (Niklaus et al., 2001; Taiz and Zeiger, 2010). Carbohydrate allocation in plants is affected and regulated by a series of physiological processes on time scales, including photosynthesis (Christiaens et al., 2015; Farhat et al., 2016; Pociecha et al., 2016), respiration (Asao and Ryan, 2015; Heim et al., 2015; O`leary et al., 2017), environmental factors (Grechi et al., 2007; Chen et al., 2008; Yang et al., 2009), and plant ontogeny (Litton et al., 2004; Weiner, 2004; Wang et al., 2008). The process of carbohydrate allocation is extremely complex. The production efficiency of fruit trees as solar collectors depends on receiving and conversion of light energy and subsequent transport, storage, and utilization efficiency of carbohydrates (Lenz, 1979). Therefore, a thorough and systematic understanding of the process of carbohydrate assimilation, transport, and utilization in fruit trees is not only necessary, but also essential for the improvement of economic yield and fruit quality of fruit trees. In the literature on carbohydrate assimilation and distribution, there are more studies on carbohydrate assimilation and distribution in pulpy fruit trees than in nut species.
Walnut (Juglans regia L.) is one of the few nut trees in horticultural crops. However, little attention has been paid to the characteristics of carbohydrate assimilation and distribution during the development of nuts in fruit trees aimed at harvesting seeds (Christiaens et al., 2015; Farhat et al., 2016; Pociecha et al., 2016). Nut yield and their main quality characteristics are dependent on the contents of carbohydrates formed by leaf photosynthesis (Asao and Ryan, 2015). Generally speaking, plant carbohydrate supply depends on photosynthesis (Xu, 2013). Carbon assimilation, the third stage of plant photosynthesis following the formation of assimilating power, is the conversion of CO2 from the air into sugar and other organic substances by means of ATP and NADPH catalyzed by a series of enzymes in the chloroplast matrix. To date, reports on carbohydrate assimilation in walnuts mainly focused on the process of carbohydrate assimilation based on gas exchange analysis and chlorophyll fluorescence induction kinetics technology (Zhang et al., 1993; Scartazza et al., 2001; Wang, 2003; Liao et al., 2007; Yao et al., 2011). However, few studies on the process of carbohydrate assimilation in walnuts using isotope tracer technology are available (Maillard et al., 1994; Lacointe et al., 1995; Moscatello et al., 2017). Carbohydrate allocation in walnut seedlings was only reported in the autotrophic stage (Maillard et al., 1994) and the sapling stage (Lacointe et al., 1995; Moscatello et al., 2017). However, there are few reports on carbohydrate allocation in long-term scales in walnut at the full fruit stage.
Considering this, in the present study, we investigated the characteristics of carbohydrate assimilation and distribution in walnut at different stages of fruit growth and development. Based on a 13C isotope tracer technique, we analyzed the daily changes and seasonal changes of 13C abundance (δ13C), 13C content (13Camount), and new fixed 13C percentage (13CPCT) in different organs and different carbohydrates on growth and development of walnut fruits. We aimed to deepen our understanding of the carbohydrate distribution pattern of walnut.
Materials and Methods
Experimental Site and Plant Material
The present study was carried out in a walnut orchard located in Southern Xinjiang, China (41°11'06.31"-41°12' 47.74"N, 79°12'12.76"-79°13'57.87"E; 1394 m a.s.l.). The experimental site has a warm temperate continental arid climate, with a mean annual temperature of 9.4°C and an average yearly rainfall of 91.5 mm. Uniform 10-year-old walnut trees (Juglans regia ‘Xinxin2’) were grown at a distance of 5 m × 6 m in east-west oriented rows. After fruit setting, 15 walnut plants with the same management measures, same site conditions, and without diseases and insect pests were selected as sample plants for the experiment.
On the south side of the periphery of each tree crown, 1.4 to 1.7 m away from the ground, 15 sun-exposed fruit-bearing shoots with the same growth potential, length (265–275 mm), and diameter (9.5–10.5 mm) were selected and marked for feeding with 13CO2. In consideration of the effects of leaf-to-fruit ratio on leaf photosynthesis, all the fruit-bearing shoots were artificially adjusted to one fruit and three mature leaves retained by picking leaves and/or removing fruits. We girdled the shoot base after defoliation and/or defruiting in order to prevent carbohydrate exchange between girdled shoots and belowground tree parts. At 10 mm from the base of each fruit-bearing shoot, a complete circle of phloem tissues (about 5 mm wide) was removed with a grafting knife without affecting the xylem. The girdles were preserved for the entire growing season by discarding any scar tissue at 15-day intervals. Immature leaves as well as apical and auxiliary buds were removed from the girdled shoots to ensure that assimilates mainly flowed to the fruit.
13CO2 Feeding Experiment
During the growing season of 2018, on five cloudless days (42 d, 65 d, 85 d, 105 d, and 125 d after the full bloom of female flowers), three leaves of each fruit-bearing shoot were covered with a polythene plastic bag with good transmittance (5.0 L). The covered leaves were supplied with about 1% (v/v) of 13CO2 generated from 6.300 g of Na213CO3 (99% 13C atoms) by addition of 40% (w/v) sulphuric acid from 11 a.m. to 12 a.m. under natural light conditions. The girdled fruit-bearing shoots were harvested 0, 24, and 48 h after the end of the 13CO2 feeding, and they were separated into leaves, carpopodiums, and fruits (peels and kernels) and freeze-dried in liquid nitrogen.
Separation of Carbohydrates and Determination of 13C Atom% in Carbohydrates
Sugars were extracted from samples with 80% (v/v) ethanol. In order to obtain neutral sugars, the sugar extracts were passed through an ion-exchange column. Crude starch in the ethanol-insoluble fraction was quantified as described by Zheng et al. (2003). The contents of neutral sugars were determined by HPLC with an attached RI detector (Model: RI-930, Japan Spectroscopic Co., Ltd., Tokyo). The determined sugars were sucrose, glucose, and fructose. Carbon isotope content was determined using an elemental analyzer (Flash 2000 HT O/H-NC, Thermo Fisher Scientific, Inc., USA) coupled with an isotope ratio mass spectrometer (Finnigan Delta V Advantage, Thermo Fisher Scientific, Inc.) in the joint Laboratory of Stable Isotope Ratio Mass Spectrometry, Shenzhen HuaKe Precision Testing Technology, Inc. and the Graduate School at Shenzhen, Tsinghua University.
δ13C (‰) was calculated as follows:
where Rs is the ratio of 13C to 12C in the samples and in carbohydrates, and RPDB is the ratio of 13C to 12C isotopic abundances in Pee Dee Belemnite.
TC was calculated as follows:
where TC is the total carbon content (µg·g-1 DW) in the carbohydrates in the sample. Mmon is the content (mg·g-1 DW) of monosaccharides (fructose and glucose) in the sample; Mdis is the content (mg·g-1 DW) of disaccharides (sucrose) in the sample; and Msta is the content (mg·g-1 DW) of starch in the sample.
13Camount (µg·g-1 DW) in carbohydrates in the samples was calculated as follows:
where 13Camount is the 13C content of carbohydrates in the sample (µg·g-1 DW); δ13C is the 13C abundance in sugar or starch in the sample (‰); and TC is the total carbon content (µg·g-1 DW) in the carbohydrates in the sample.
13CPCT (%) was calculated as:
where 13Ct is the total amount of 13C in the carbohydrates of the sample after 13CO2 feeding, and 13Cck isthe total amount of 13C in the carbohydrates of the samples before 13CO2 feeding.
Gas Exchange Parameters and Chlorophyll Fluorescence Parameters Measurements
During the 13CO2 feeding experiment, photosynthetic parameters were determined on the leaves of girdled fruit-bearing shoots that had been tagged without feeding 13CO2. Three fruit-bearing shoots from each tree and six single-tree replications were constantly used on each day of measurement. The portable photosynthesis system (LI-6400XT; LI-COR, USA) was utilized to measure net photosynthetic rate (Pn, in µmol CO2 m-2·s-1), stomatal conductance (Gs, in mol H2O m-2·s-1), intercellular CO2 concentration (Ci, in µmol CO2 mol-1), transpiration rate (Tr, in mmol H2O·m-2·s-1), leaf temperature (Tleaf, in °C), and photosynthetic effective radiation (PARi, in µmol·m-2·s-1). The fluorescence monitoring system (FMS-2, Hansatech, England) was used to measure maximum quantum yield of photosystemⅡphotochemistry (Fv/Fm), effective quantum yield of photosystemⅡ photochemistry (ФPSII), apparent electron transport rate (ETR), and non-photochemical dissipation of absorbed light energy (NPQ), referring to methods described by Zhang (2018, 2019).
Statistical Analysis
Pearson correlation was used to calculate the correlation coefficients between photosynthetic parameters, and a bilateral method was used to test the correlation between photosynthetic parameters. Pearson correlation was used to calculate the correlation coefficients among Pn, δ13C in walnut leaves, and δ13C, 13Camount, and 13CPCT in carbohydrates in walnut leaves at 0 h after feeding. The correlation between Pn and these parameters was tested by bilateral method. SPSS 22.0 software was used for statistical analysis, Microsoft Excel 2007 was used for data collation and calculation, and Sigmaplot 10.0 software was used for drawing.
Results
Seasonal Variation in δ13C in Different Organs on the Girdled Shoots
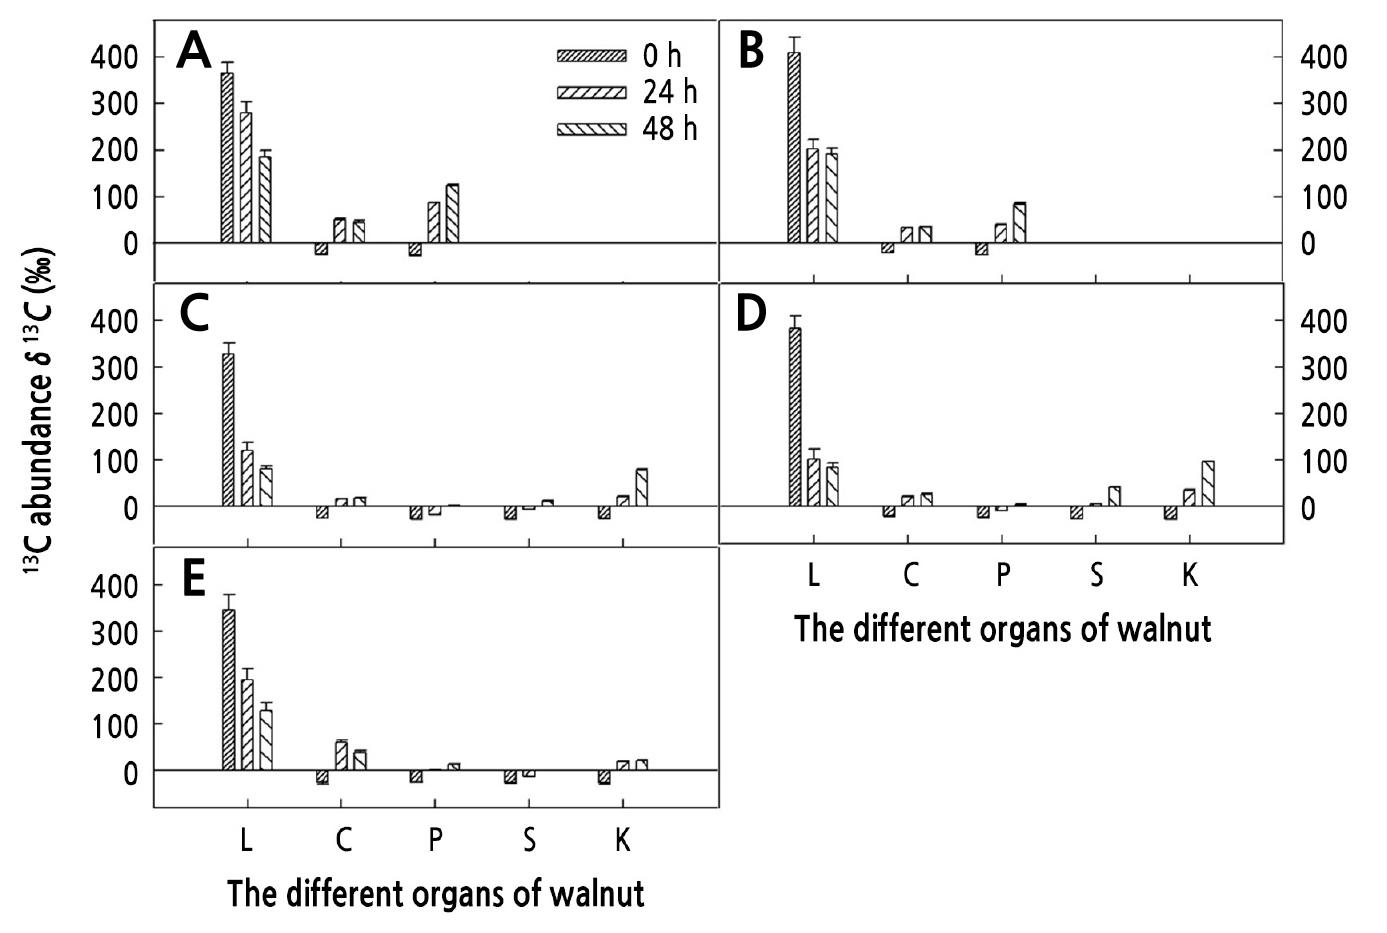
In the period from 42 to 65 d after full bloom (Fig. 1A and 1B), the volume of the walnut fruits increased rapidly and the ovules were filled with liquid. Within 0–48 h after the end of feeding, δ13C in leaves gradually decreased, whereas δ13C in the carpopodium increased at first and then decreased, and δ13C in fruit gradually increased. At 0 h after the end of feeding, δ13C in leaves was the highest at 369.10‰ (42 d after full bloom) and 409.00‰ (65 d after full bloom). Within 0–24 h after the end of feeding, δ13C in fruit increased rapidly. In the period from 65 to 85 d (Fig. 1B and 1C), the seed coat was gradually lignified and the liquid in the ovule gradually solidified in gel form. Within 0–48 h after the end of feeding, δ13C in leaves gradually decreased. The δ13C in green peel, seed coat, and kernel gradually increased, and the increase in δ13C in the kernels was the greatest. Compared with the δ13C in the kernels at 0 h after feeding, the δ13C in the kernels increased 103.39% at 48 h after feeding. In the period from 85 to 105 d (Fig. 1C and 1D), the septum was formed, the seeds contained seed chambers, and the cotyledons gradually turned white. Within 0–48 h after the end of feeding, δ13C in leaves gradually decreased. The δ13C in peel, seed coat, and kernel gradually increased, and the largest increase of δ13C in kernels was 122.43‰. At 125 d (Fig. 1E), δ13C gradually decreased within 0–48 h after feeding, δ13C in the carpopodium, peel, seed coat, and kernel gradually increased, and the largest increase of δ13C in the carpopodium was 63.60‰.
Seasonal Variation of δ13C, 13Camount, and 13CPCT in the Carbohydrates from Different Organs on the Girdled Shoots
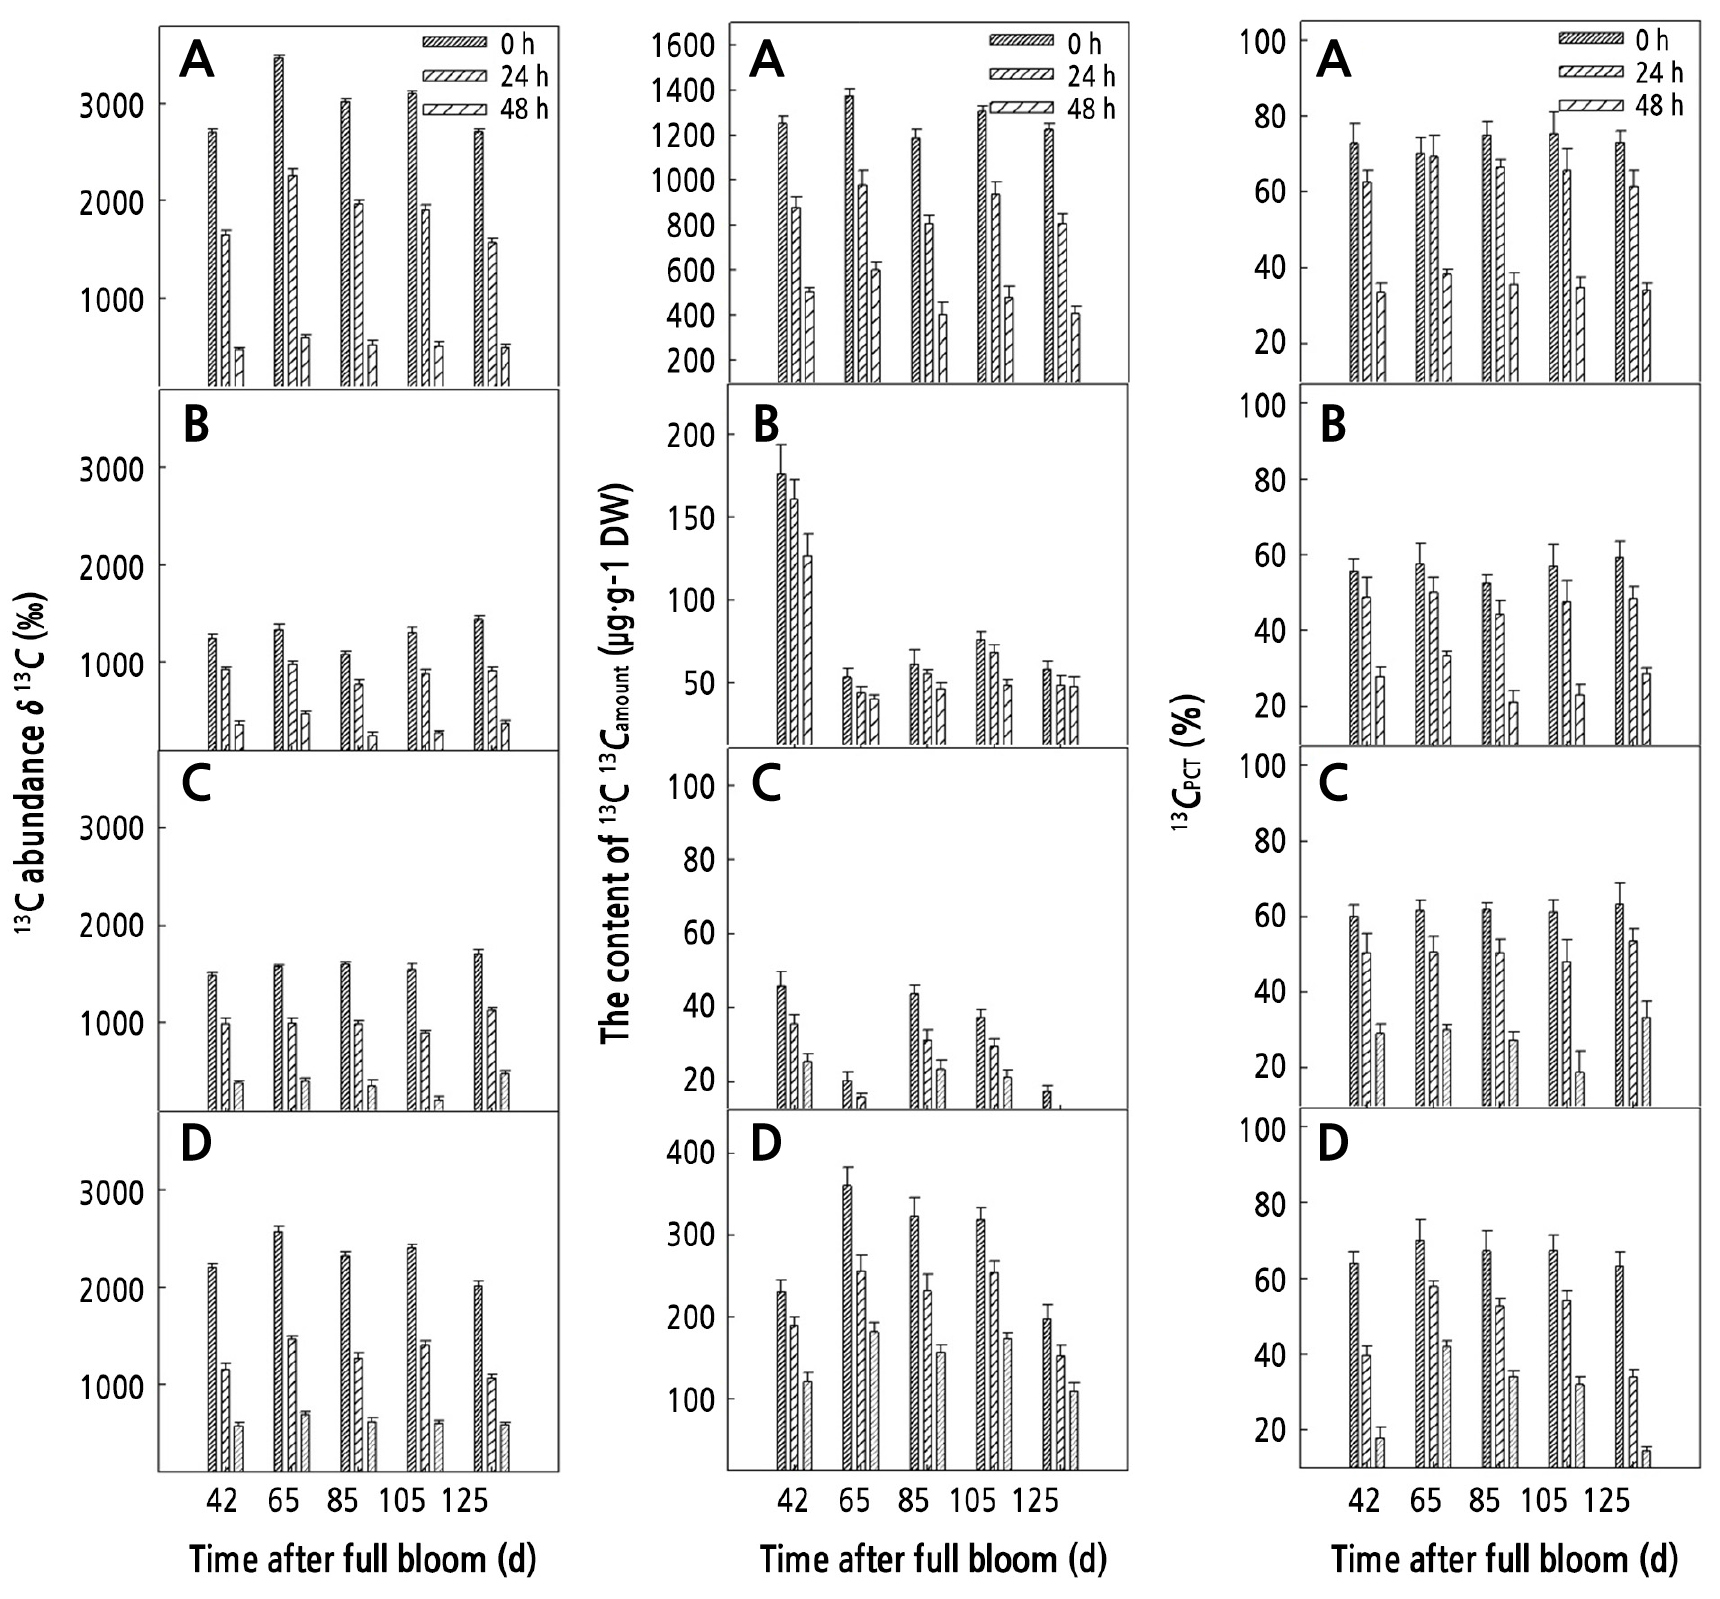
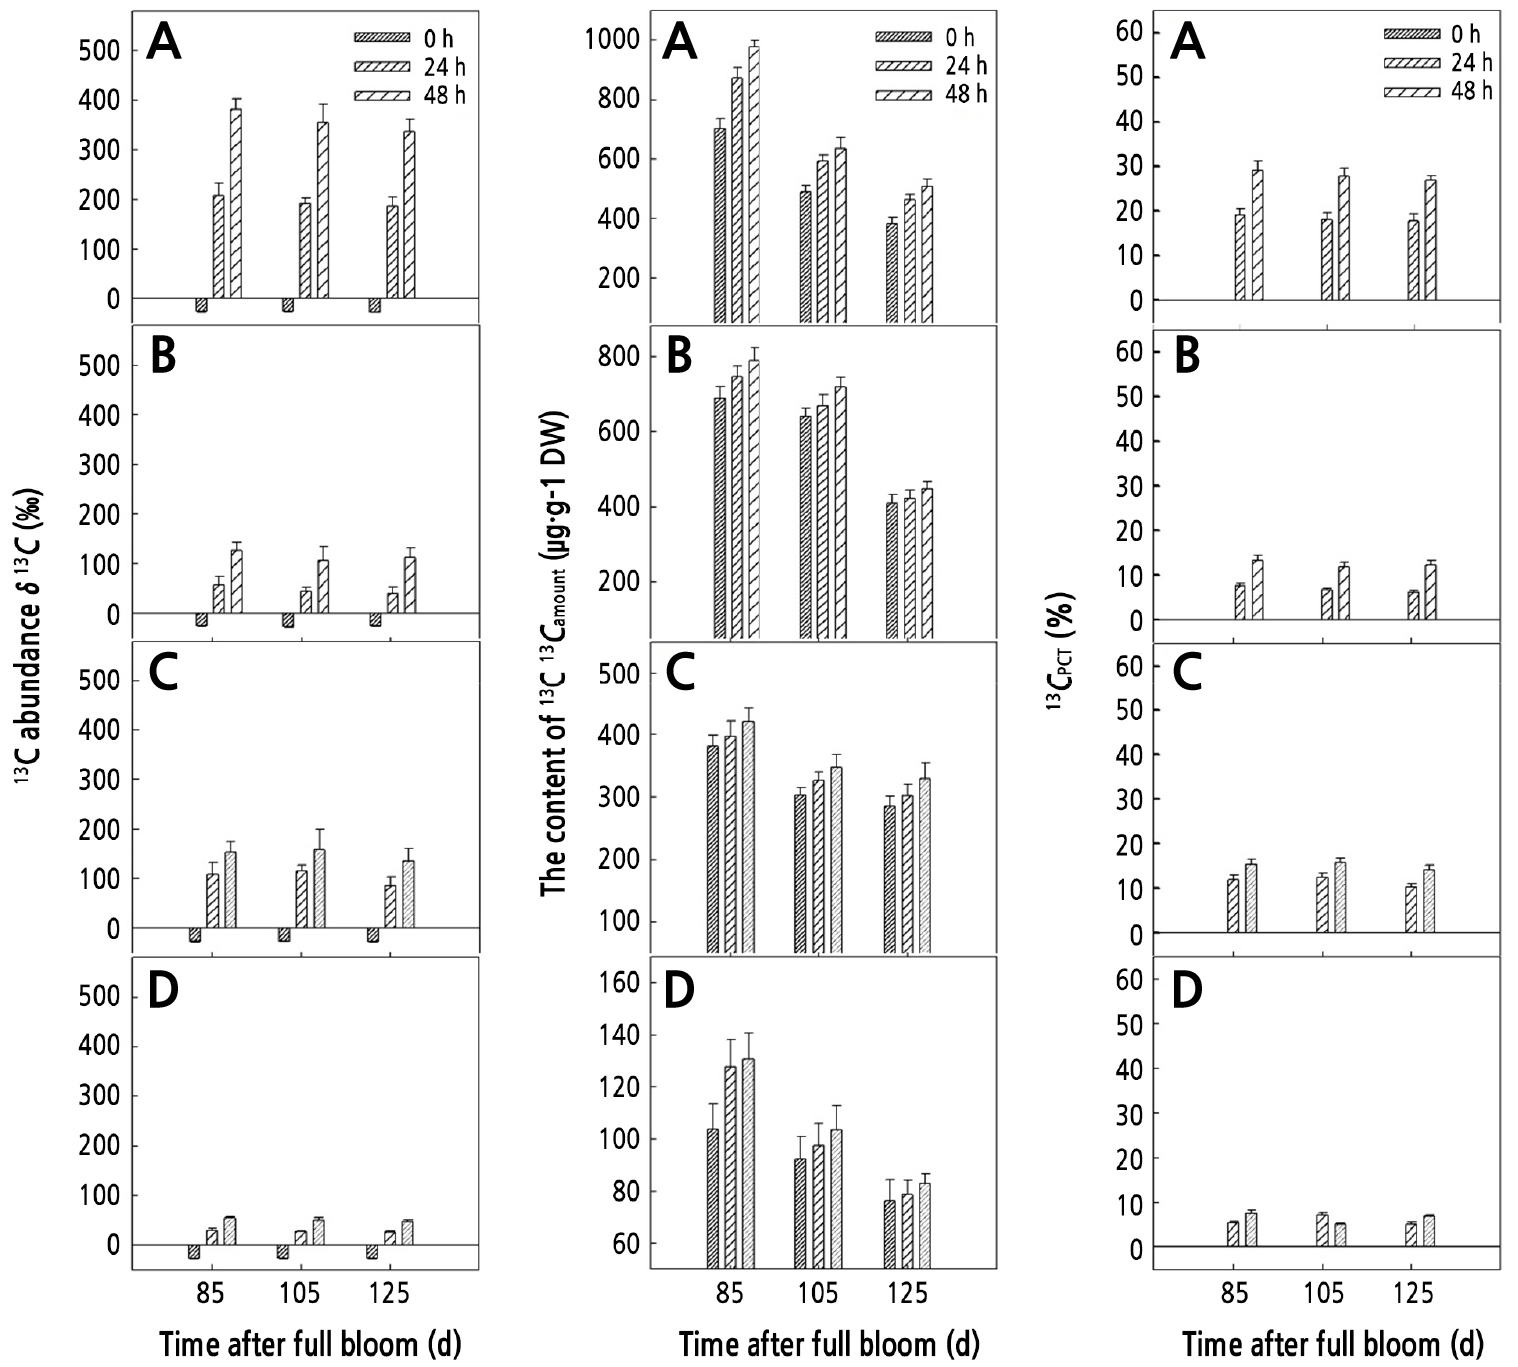
During the growth and development of walnut fruits, we observed a decrease in δ13C, 13Camount, and 13CPCT in sucrose, glucose, fructose, and starch from the leaves within 0–48 h after feeding. At 0 h after the end of feeding, δ13C, 13Camount, and 13CPCT of sucrose reached the maximum values among all the carbohydrates in the leaves, which are 3001.83‰, 1247.17 µg·g-1 DW, and 70%, respectively. δ13C, 13Camount, and 13CPCT in starch were second only to those in sucrose, which were 2301.77‰, 285.34 µg·g-1, and 60%. Compared with the data at 0 h after the end of feeding, δ13C, 13Camount, and 13CPCT in leaf sucrose at 48 h after the feeding decreased the most at 82.55%, 58.19%, and 40.63%, respectively. δ13C and 13Camount in leaf starch decreased by 73.36% and 50.48% (Fig. 2).
During the growth and development of walnut fruits, within 0–48 h after feeding, δ13C, 13Camount, and 13CPCT in sucrose, glucose, and fructose of the carpopodium increased at first and then decreased, whereas δ13C, 13Camount, and 13CPCT in starch increased gradually (excepting 42 d). At 24 h after the end of feeding, δ13C, 13Camount, and 13CPCT in sucrose were the highest at 807.65‰, 221.25 µg·g-1 DW, and 42.94%–49.78%, respectively. δ13C in starch was the lowest with an average value of 351.65‰. 13Camount in glucose and fructose increased slowly by 58.38 µg·g-1 DW and 60.72 µg·g-1 DW, respectively. At 48 h after the end of feeding, δ13C, 13Camount, and 13CPCT in leaf sucrose decreased the most at 47.36%, 18.41%, and 31.37%, respectively. δ13C in glucose decreased by 45.39% (Fig. 3).
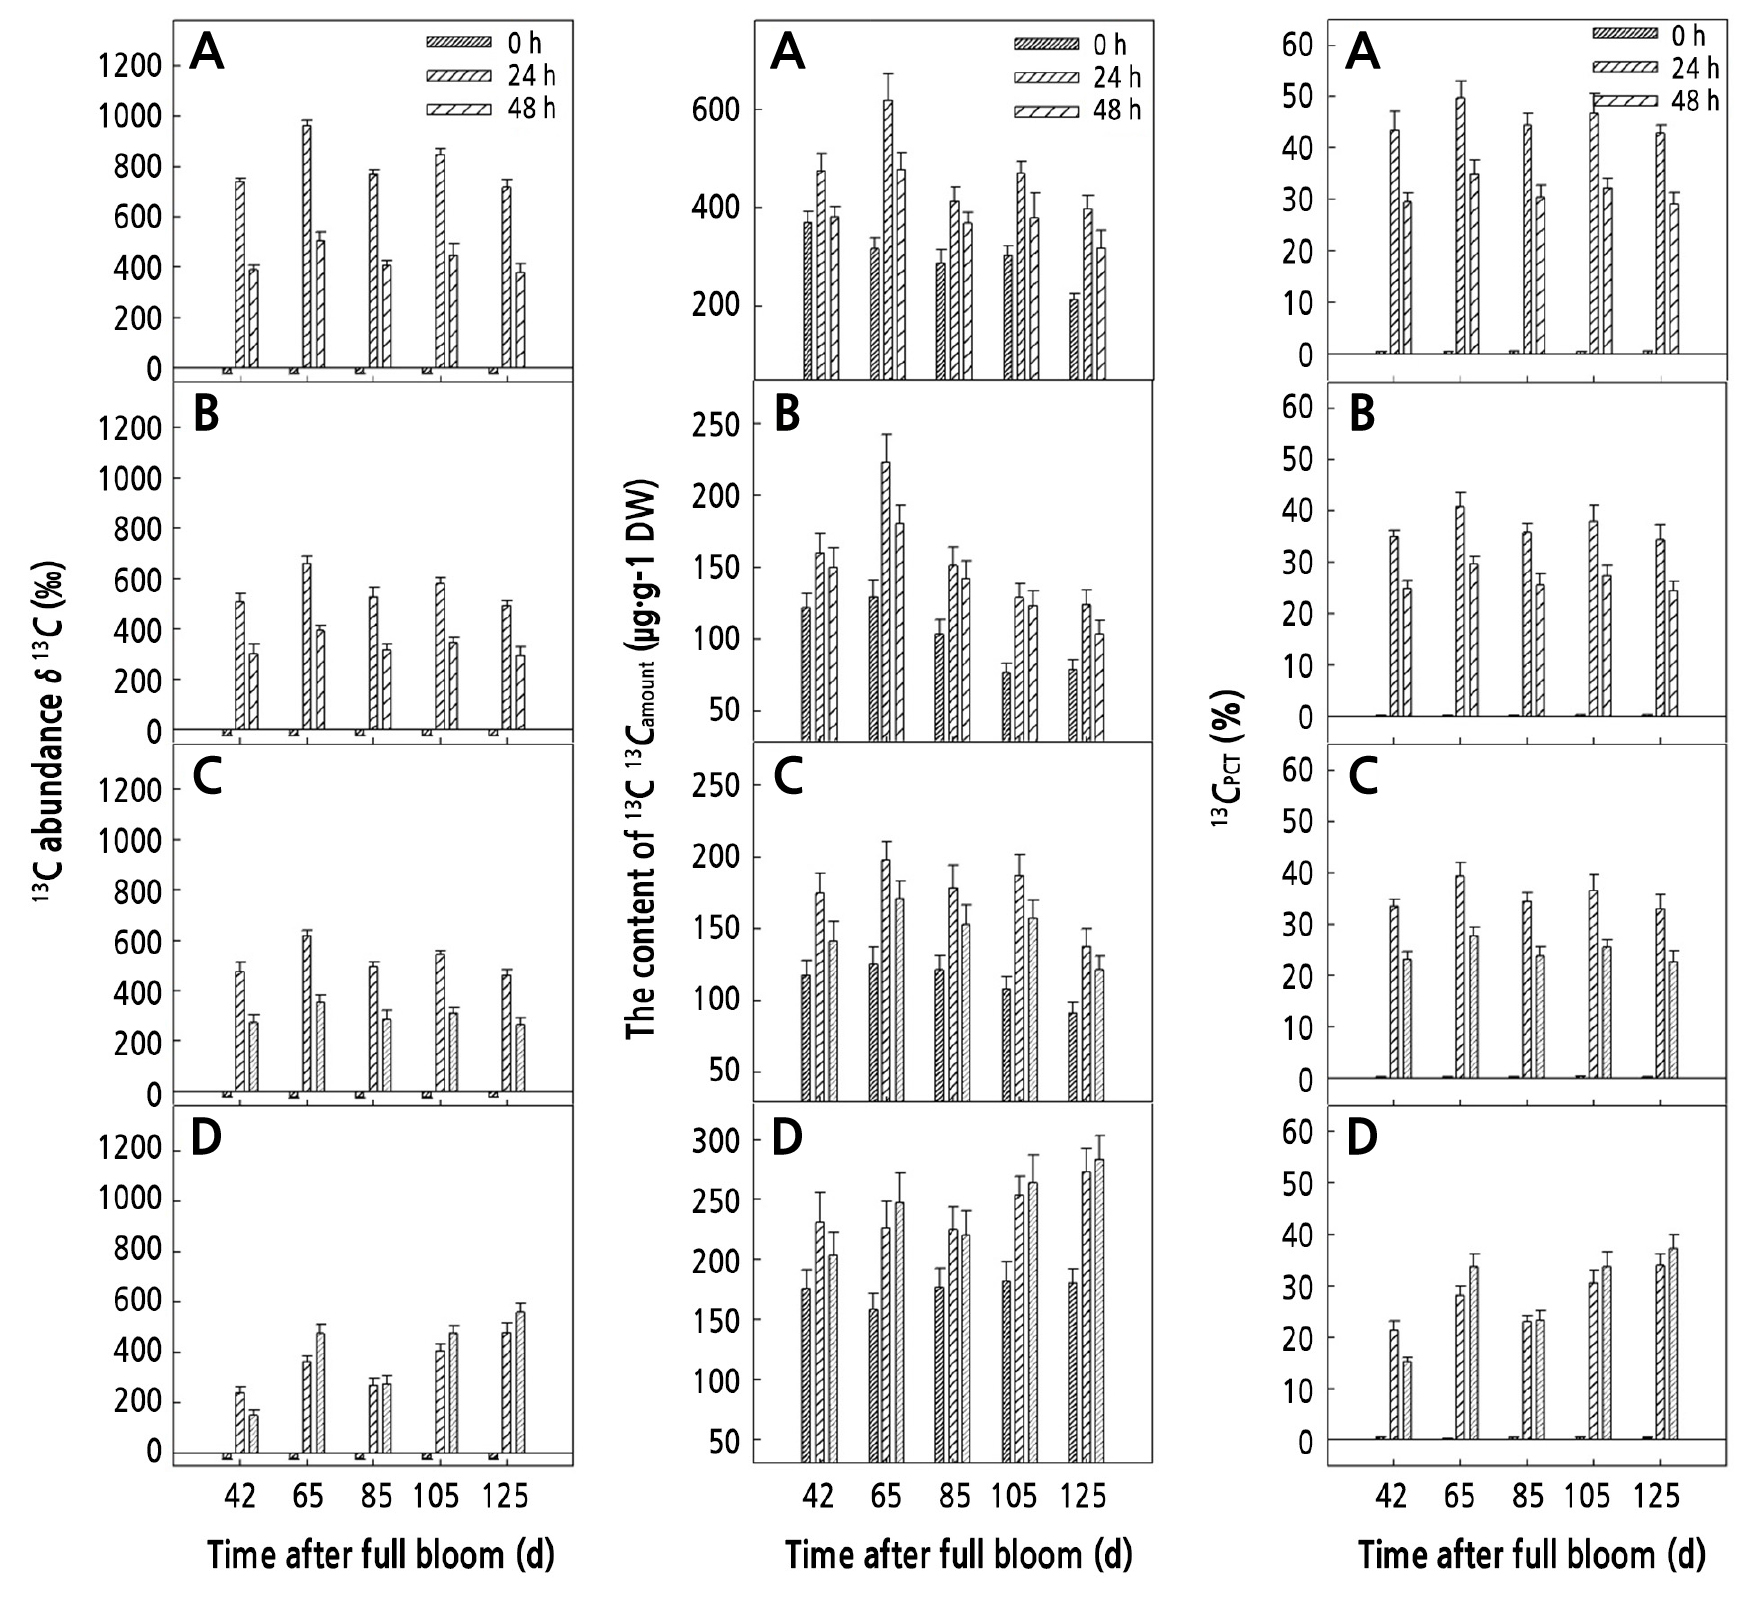
During the growth and development of walnut fruits, from 42 to 65 d, δ13C, 13Camount, and 13CPCT in sucrose from the peel increased at first and then decreased within 0–48 h after feeding, but δ13C, 13Camount, and 13CPCT in glucose and fructose continued to increase until 48 h after feeding and reached the highest level at 48 h after feeding, and the mean values of δ13C (402.81‰), 13Camount (524.80 µg·g-1 DW), and 13CPCT (22.56%) in fructose were higher than those in sucrose (245.21‰, 200.19 µg·g-1 DW, and 19.83%). From 85 to 125 d, δ13C, 13Camount, and 13CPCT in sucrose from the peel increased at first and then decreased within 0–48 h after feeding, and these contents were always higher in sucrose than those in glucose and fructose. On the other hand, δ13C, 13Camount, and 13CPCT in starch were low (Fig. 4).
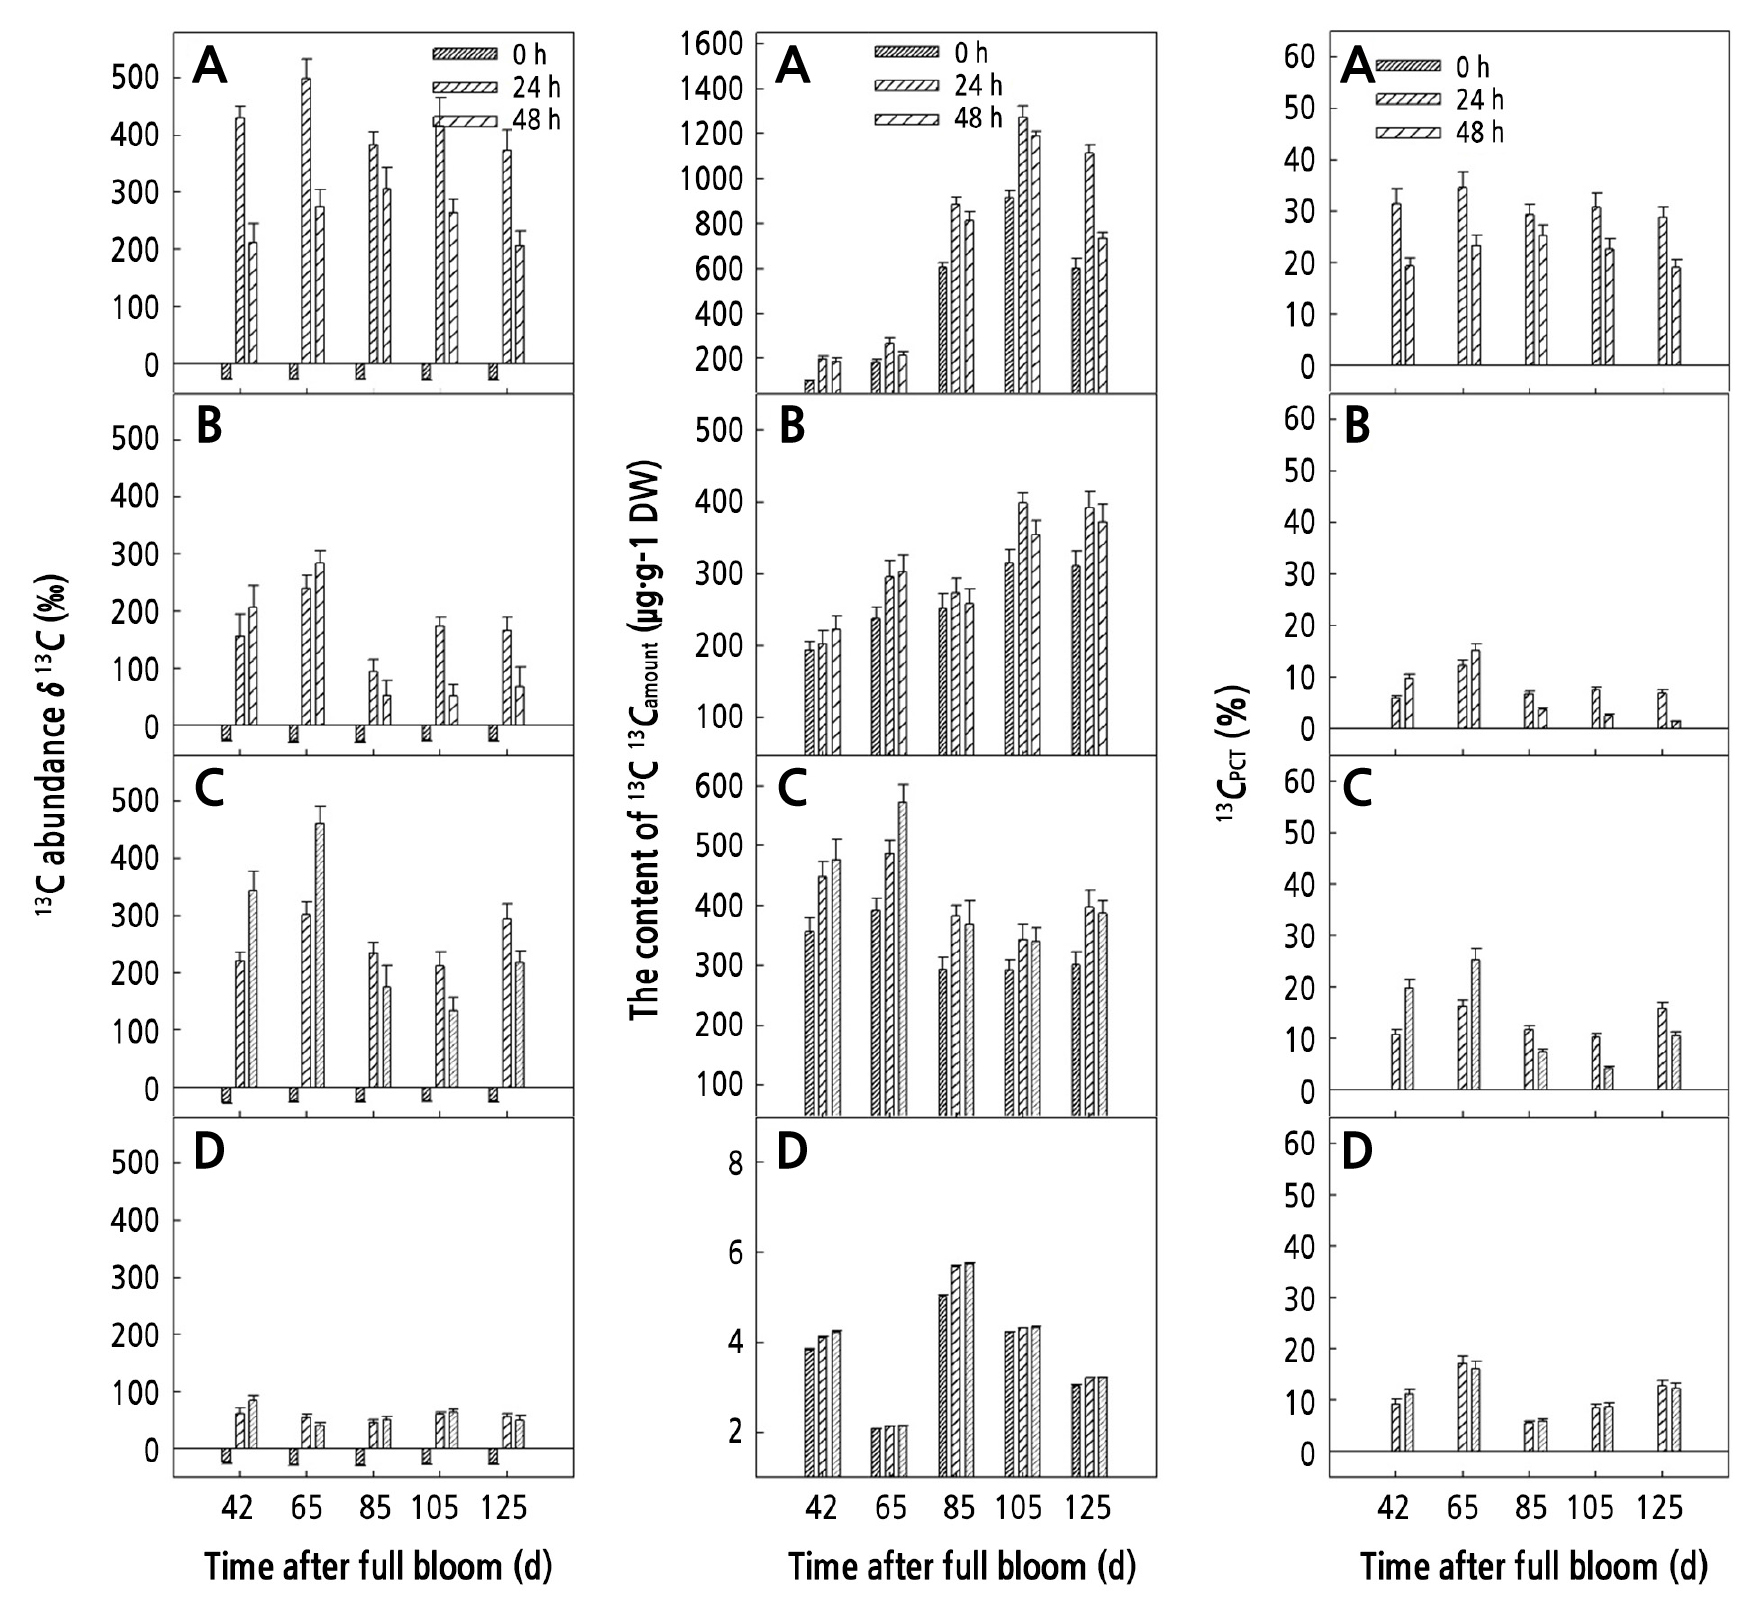
During the growth and development of walnut fruits, from 85 to 125 d, δ13C, 13Camount, and 13CPCT in sucrose, glucose, fructose, and starch from the kernel gradually increased within 0–48 h after feeding. At 48 h after the end of feeding, the highest values of δ13C, 13Camount, and 13CPCT were observed in sucrose, which were 357.94‰, 706.94 µg·g-1 DW, and 27.95%. The δ13C in starch was the lowest with an average value of 51.13‰, 79.38µg·g-1 DW, and 7.25% (Fig. 5).
Seasonal Variation of Leaf Photosynthetic Parameters
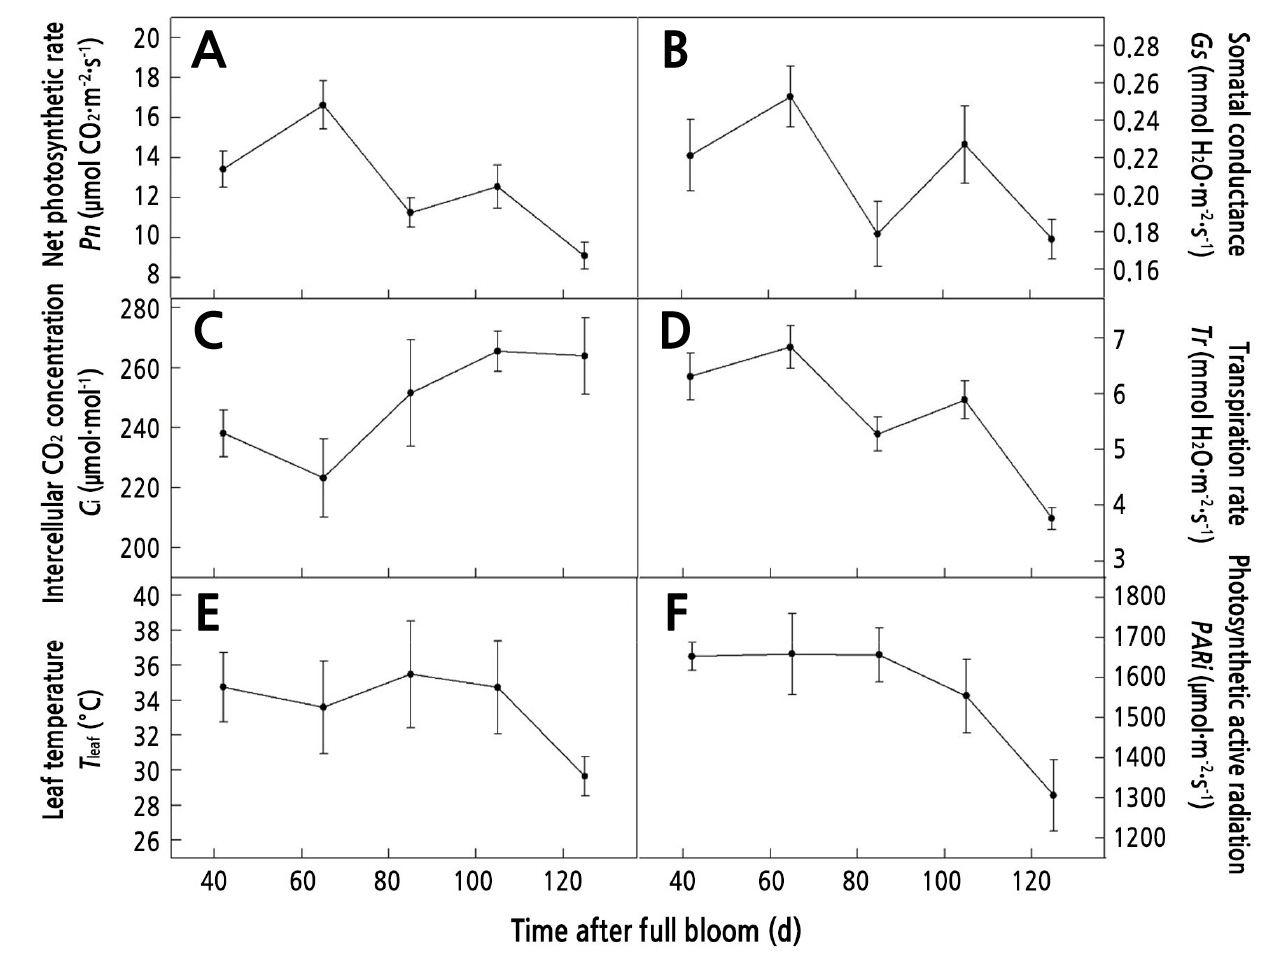
In the process of walnut fruit growth and development, Pn, Gs, and Tr in walnut leaves showed a trend of "ascending descending ascending descending", and the peak values appeared at 65 and 105 d after full bloom, respectively (Fig. 6A, 6B, and 6D). Ci decreased at first and then increased, and the lowest value of Ci (33.587 ± 2.631 µmol·mol-1) was recorded 65 d (Fig. 6C); Tleaf showed a decreasing trend at first and then it increased, and the peak value appeared at 85 d (Fig. 6E). PARi showed a trend of gradual decrease, and it remained at a high level during the period from 42 to 85 d, after which it rapidly decreased (Fig. 6F).
The seasonal trends of ФPSII, Fv/Fm, and ETR increased first and then decreased, and they reached their maximum values at 65 d. NPQ showed a trend of gradual increase (Fig. 7).
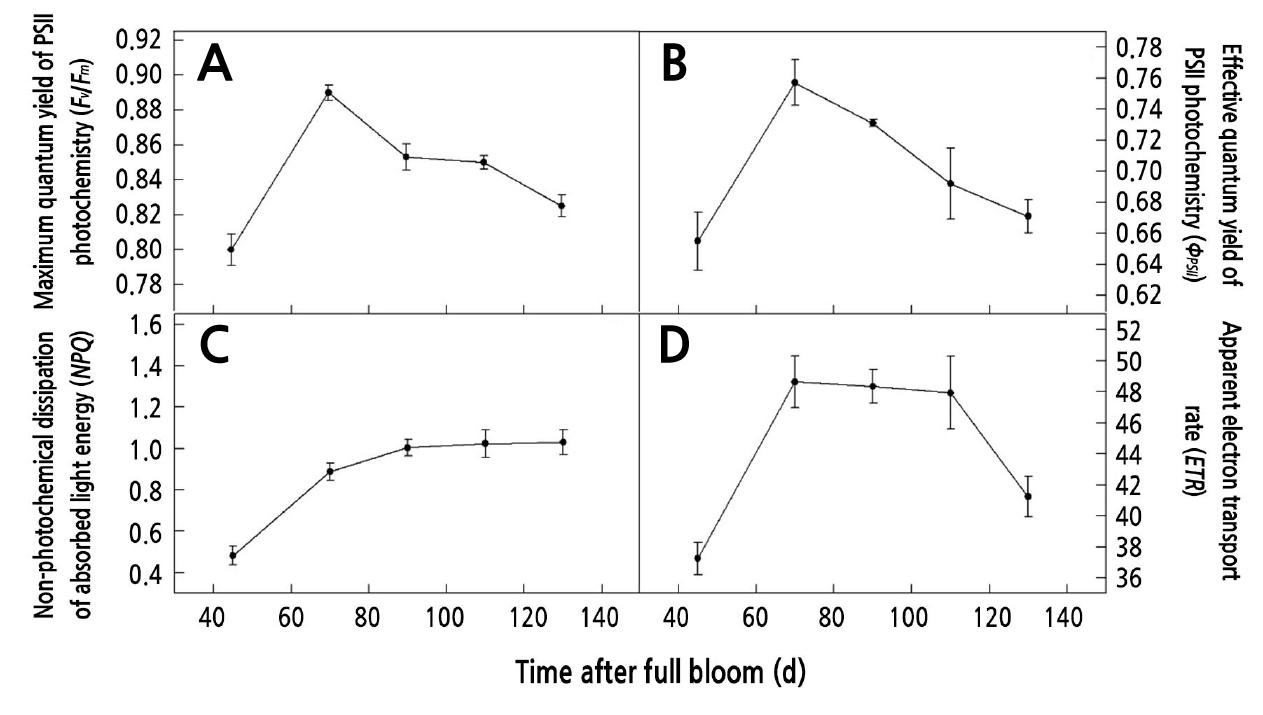
Fig. 7.
Seasonal variation of maximum quantum yield of photosystemⅡ photochemistry (Fv/Fm) (A), effective quantum yield of photosystemⅡphotochemistry (ФPSII) (B), non-photochemical dissipation of absorbed light energy (NPQ) (C), and apparent electron transport rate (ETR) (D) in walnut leaves (means ± SE, n =3).
Analysis of the Correlation between Carbohydrate Assimilation and Photosynthetic Parameters in Leaves
The results of the correlation analysis showed that Pn was positively correlated with Gs and Tr (p < 0.05), Gs was positively correlated with Tr (p < 0.05), Tleaf was positively correlated with PARi (p < 0.05), and Fv/Fm was positively correlated with ФPSII and ETR (p < 0.05) (Table 1). Pn was highly positively correlated with δ13C of leaves and δ13C in sucrose from the leaves (p < 0.01), and Pn was positively correlated with 13Camount and 13CPCT in sucrose from the leaves (p < 0.05). δ13C of leaves was highly positively correlated with δ13C in sucrose from leaves (p < 0.01) and positively correlated with 13Camount and 13CPCT in sucrose from leaves (p < 0.05) (Table 2).
Table 1.
Correlation coefficient of photosynthetic parametersz in walnut leaves
| Gs | Ci | Tr | Tleaf | PARi | Fv/Fm | ФPSII | NPQ | ETR | |
| Pn | 0.929* | -0.849 | 0.944* | 0.595 | 0.732 | 0.478 | 0.527 | -0.418 | 0.294 |
| Gs | -0.645 | 0.884* | 0.452 | 0.537 | 0.397 | 0.317 | -0.368 | 0.218 | |
| Ci | -0.743 | -0.376 | -0.662 | -0.260 | -0.478 | 0.580 | -0.018 | ||
| Tr | 0.758 | 0.866 | 0.328 | 0.383 | -0.523 | 0.249 | |||
| Tleaf | 0.917* | 0.449 | 0.530 | -0.138 | 0.588 | ||||
| PARi | 0.265 | 0.445 | -0.476 | 0.309 | |||||
| Fv/Fm | 0.928* | 0.580 | 0.929* | ||||||
| ФPSII | 0.394 | 0.844 | |||||||
| NPQ | 0.669 |
zPn represses net photosynthetic rate; Gs represses stomatal conductance; Ci represses intercellular CO2 concentration; Tr represses transpiration rate; Tleaf represses leaf temperature; PARi represses photosynthetic effective radiation; Fv/Fm represses photosystem II photochemistry; ФPSII represses effective quantum yield of photosystem II photochemistry; ETR represses apparent electron transport rate; and NPQ represses non-photochemical dissipation of absorbed light energy. ** indicates that the correlation is extremely significant at the 0.01 level; * indicates that the correlation is significant at the 0.05 level.
Table 2.
Correlation coefficient of carbohydrate assimilation and Pn in walnut leaves
|
Determination indexz | δ13C | Sucrose | Glucose | Fructose | Starch | ||||||||||||
| δ13C | 13Camount | 13CPCT | δ13C | 13Camount | 13CPCT | δ13C | 13Camount | 13CPCT | δ13C | 13Camount | 13CPCT | ||||||
| Pn | 0.975** | 0.964** | 0.918* | 0.926* | -0.07 | 0.075 | -0.038 | -0.625 | 0.008 | -0.616 | 0.851 | 0.756 | 0.721 | ||||
| δ13C | 0.967** | 0.932* | 0.916* | -0.002 | 0.192 | 0.037 | -0.722 | 0.077 | -0.712 | 0.807 | 0.702 | 0.651 | |||||
| Sucrose | δ13C | 0.937* | 0.837 | 0.190 | 0.099 | 0.223 | -0.549 | -0.158 | -0.544 | 0.749 | 0.587 | 0.576 | |||||
| 13Camount | 0.735 | 0.166 | -0.142 | 0.199 | -0.474 | -0.193 | -0.455 | 0.881 | 0.718 | 0.747 | |||||||
| 13CPCT | -0.337 | 0.363 | -0.302 | -0.830 | 0.361 | -0.827 | 0.730 | 0.733 | 0.617 | ||||||||
| Glucose | δ13C | -0.133 | 0.999** | 0.409 | -0.786 | 0.401 | -0.253 | -0.532 | -0.398 | ||||||||
| 13Camount | -0.108 | -0.681 | 0.636 | -0.707 | -0.322 | -0.243 | -0.443 | ||||||||||
| 13CPCT | 0.364 | -0.764 | 0.357 | -0.228 | -0.508 | -0.381 | |||||||||||
| Fructose | δ13C | -0.718 | 0.999** | -0.446 | -0.521 | -0.338 | |||||||||||
| 13Camount | -0.720 | 0.011 | 0.262 | 0.056 | |||||||||||||
| 13CPCT | -0.419 | -0.494 | -0.307 | ||||||||||||||
| Starch | δ13C | 0.953 | 0.971** | ||||||||||||||
| 13Camount | 0.974** | ||||||||||||||||
Discussion
Characteristics of Carbohydrate Assimilation in Walnut
In most plants, when carbon is fixed in source leaves by photosynthesis, the fixed carbon first appears in the form of phosphor saccharides. Monosaccharide phosphates can form starch and be stored in chloroplasts. Starch is the main form in which plants store carbohydrates at night. Meanwhile, monosaccharide phosphate can also be transported from chloroplasts to cytosol, and sucrose can be synthesized from it. Sucrose is the main form in which carbohydrates are transported from source to sink tissues, and it is also the main form in which the photosynthate products are exported from chloroplasts to cytoplasm. Therefore, the synthesis pathways of starch and sucrose are mutually competitive (Cai et al., 2012). In the present study, the significant positive correlation between Pn and δ13C of leaves at 0 h after the end of feeding indicated that the amount of carbohydrate assimilation in walnut leaves depended on the Pn of the leaves. Pn could be used as an important index for measuring the photosynthetic capacity of walnut leaves. At 0 h after feeding, the highest levels of δ13C, 13Camount, and 13CPCT were observed in leaf sucrose, followed by leaf starch, and the δ13C, 13Camount, and 13CPCT in leaf sucrose were positively correlated with δ13C of leaves and Pn, indicating that the main product of walnut leaf assimilation is sucrose, followed by starch.
In the present study, at 42–65 d after full bloom, increasing Gs, decreasing Ci, a high level PARi, moderate Tleaf, and high photosynthetic activity of leaves (Fv/Fm, ФPSII, and ETR remained at a high level) made it easy to reach a high level of Pn. At 85 d after full bloom, Pn and Gs decreased, while Ci increased. According to Farquhar and Sharkey (1982), when Pn and Gs decreased and Ci changed little or was higher, the decrease of Pn was mostly caused by nonstomatal restriction, and the increase of Ci after stomatal closure might be related to the decrease of photochemical activity or biochemical activity (such as 1,5-diphosphate-ribulose). Previous studies have shown that the dry climate in summer reduces Pn in walnut leaves (Tanner, 1980; Patrick, 1997; Lalonde et al., 2003), and autumn rain increases Pn (Lalonde et al., 2003). In the present study, the results showed that Pn in the leaves of field walnut picked up at 105 d after full bloom, which might be the result of the tree body recovering after drought.
The results of the present study also showed that the starch in leaves collected at 0 h after feeding was strongly marked by 13C, and the starch marked by 13C was reduced by 73.36% at 48 h after feeding. The decrease in 13Camount in leaf starch was accompanied by the increase of 13Camount in sucrose in all organs. This was probably because most of the 13C in leaves was temporarily fixed in starch. When 13C components are metabolized, the decomposition of 13C starch may be used for the synthesis of sucrose, indicating that starch was the main assimilation product being accumulated and metabolized in walnut leaves. We also found that the starch in mature leaves is of special significance as a temporary storage form of carbon assimilation.
Characteristics of Carbohydrate Transport in Walnut
Previous studies have shown that a large amount of 14CO2 or 13CO2 in plant leaves was fixed in sugar and transported to other organs within 24 h (Hofstra and Nelson, 1969; Gordon et al., 1997; Okano et al., 1983). Similar results were obtained in the present study because, at 24 h after feeding, δ13C, 13Camount, and 13CPCT in sucrose, glucose, fructose, and starch from the walnut leaves decreased rapidly, whereas δ13C, 13Camount, and 13CPCT in sucrose, glucose, fructose, and starch from the carpopodium, peel, and kernel increased rapidly compared to at 0 h after feeding. Previous studies have shown that assimilated carbon in plants is mainly transported in the form of sucrose from the leaves to other sink organs, and it can be measured using 14CO2 or 13CO2 tracing methods or by direct analysis of plant phloem exudates (Zimmermann et al., 1975).
In the present study, we found that at 0 h after feeding, δ13C, 13Camount, and 13CPCT in sucrose from the walnut leaves were always higher than those in other carbohydrates. However, at 48 h after feeding, δ13C, 13Camount, and 13CPCT in sucrose of walnut leaves decreased the most. Meanwhile, the highest levels of δ13C and 13CPCT were observed in sucrose from the carpopodium, peel, and kernels at 24 h after feeding. These results indicated that the photosynthetic products of walnut were rapidly exported from the leaves in the form of sucrose and transported into fruit through the carpopodium. Because of the accumulation, transformation, and transport of carbohydrates in the carpopodium and fruit, the marked carbohydrate content changed significantly after feeding compared to that before feeding. In the present study, within 0–24 h after the end of feeding, δ13C, 13Camount, and 13CPCT in sucrose, fructose, and glucose from the carpopodium increased. In the period from 24 to 48 h after the end of feeding, decrease in δ13C, 13Camount, and 13CPCT in sucrose, fructose, and glucose from the carpopodium was accompanied by an increase in starch. In addition, the decrease in δ13C, 13Camount, and 13CPCT in sucrose was significant, whereas δ13C, 13Camount, and 13CPCT in fructose and glucose decreased slightly. It can be hypothesized that sucrose can be catabolized into glucose and fructose after being transported from the leaves to the carpopodium, and then it can be converted into starch and accumulated in the carpopodium. The decomposition of sucrose into glucose and fructose can reduce the sucrose concentration in the carpopodium and increase the sugar concentration gradient between the source and the library, which is beneficial to the transfer of sucrose to the fruit of the library. High sucrose decomposition enzymes in sugar beet (Beta vulgaris L.) petiole (Zhou et al., 2008) and jujube (Ziziphus jujuba M.) carpopodium (Chen, 2014) also showed strong sucrose decomposition activity in the carbohydrate transport organization.
Characteristics of Carbohydrate Utilization in Walnut
The results of the present study showed that walnut fruits were in the fast-growing stage in the period from 42 to 65 days after full bloom, and the main distribution center of 13C was the fruit. The transportation and distribution of large amounts of carbohydrates provided the material and energy basis for cell division and fruit development. Meanwhile, we observed that during the first 48 h after feeding, δ13C, 13Camount, and 13CPCT in sucrose from the peel increased at first and then decreased, whereas δ13C, 13Camount, and 13CPCT in fructose and glucose increased gradually, and at 48 h after feeding, δ13C, 13Camount, and 13CPCT in fructose and glucose were higher than those in sucrose. These results indicated that carbohydrates were mainly transported in the form of sucrose to the peel and then catabolized into fructose and glucose. Studies have shown that high hexose level is a necessary condition for maintaining cell division ability (Wobus and Weber, 1999).
In the period from 85 to 125 days after full bloom, the walnut fruit were in the stage of oil transformation. The distribution centers of carbohydrates on the girdled fruit-bearing shoots were kernels and seed coat. It could be observed that the seed coat of walnut fruits gradually lignified, and the jelly-like substance in the kernel gradually solidified to form fat. Meanwhile, it could be observed that in the first 48 h after feeding, δ13C, 13Camount, and 13CPCT in sucrose, fructose, and glucose all increased at first and then decreased. Moreover, δ13C, 13Camount, and 13CPCT in sucrose were higher than those in other carbohydrates, which indicated that sucrose was the main type of carbohydrate accumulated in the peel. This is because in the later stage of tissue development, a certain level of sucrose is necessary for inducing the differentiation of storage tissue cells. The results of the present study also showed that in the first 48 h after feeding, δ13C, 13Camount, and 13CPCT in sucrose, fructose, and glucose from the kernel gradually increased, and δ13C, 13Camount, and 13CPCT in sucrose were always higher than those of other carbohydrates. Sucrose concentration was the basis of substance transformation in kernels, which indicated that in the kernels, carbohydrates mainly accumulated in the form of sucrose, and a high concentration of sucrose was the basis of material transformation in kernels. At 125 days, carbohydrates on the girdled shoot were continually allocated to the kernel, and carbohydrate accumulation in the carpopodium increased, indicating that carbohydrates started to be stored and accumulated in the carpopodium.
Conclusions
We found that the main product of photosynthesis in walnut leaves was sucrose, and it was also the main form of photosynthate exported from leaves and transported to other organs. The main form of carbohydrate transport in the carpopodium was sucrose as well, and after entering the carpopodium, its concentration reduced as it was catabolized into fructose and glucose. From 42 to 65 days after full bloom, walnut fruits were in a fast-growing period, and sucrose in the green peel catabolized into glucose and fructose, which provided the material and energy basis for cell division and formation of fruit cells. From 85 to 105 days after full bloom, walnut fruits were in the stage of oil transformation, and sucrose was accumulated in the green peel and kernel of the fruit. The high concentration of sucrose was the basis for the transformation of the oil in the kernel.
