

Introduction
Materials and Methods
Plant Materials
Greenhouse Environment
Plant Growth
Model Description
Model Validation
Statistical Analysis
Results and Discussion
Environment in the Greenhouse
Growth of Cut Roses in Domestic Greenhouse Conditions
Comparison between Measured and Estimated Leaf area using the Leaf Area Equation
Validation of the Shoot Growth Model
Modification of Leaf Area Model
Validation of Shoot Growth using a Modified Model
Introduction
Cut roses are one of the most important cut flowers in the global flower market. In 2019, the cultivation area of cut roses in Korea was 247 ha, which accounted for 20% of the total domestic cut flower cultivation area (MAFRA, 2020). In Korea, 90% of cut roses are cultivated in greenhouses using the soil-less culture arching technique with rock wool media (Kim and Lee, 2008; MAFRA, 2020).
The growth of cut roses is influenced by microclimate conditions such as temperature, light, and CO2 in greenhouses (Lentz, 1998; Dayan et al., 2002). Pasian and Lieth (1994) reported that light affects rose growth and development. Temperature and light also affect the physiological characteristics of cut roses, such as bent necks, blind shoots, and bullheads (Sarkka, 2003; Seo and Kim, 2013). Thus, it is important for growers to understand the relationship between environmental factors (light and temperature) in the greenhouse and the growth responses of cut roses (Shi et al., 2019).
In general, the optimal temperature for greenhouse cultivation of cut roses is known to be 24–27°C in the day and 18°C at night (RDA, 2012). Photosynthesis of roses is affected by temperature. Between 18 and 30°C, the net photosynthetic rate of roses increases with increasing temperature. However, above 37°C, the net photosynthetic rate decreases sharply. Above 40°C, permanent damage occurs with rapid wilting and drying out (Kim and Lieth, 2012).
Low temperature after flower budding causes decreased dark respiration and increased ribulose-1,5-bisphosphate carboxylase-oxygenase (RuBisCo) and N contents in leaves, which results in increased dry mass, net assimilation rate, and relative growth rate (Shin et al., 2001; Ushio et al., 2008). Low temperature at night greatly affects rose growth. The optimal night temperature in cut roses is about 18°C, and low night temperature below 18°C causes increases in powdery and downy mildew, blind shoots, and number of flowering days and decreases in productivity (Kamp, 1948; Zink, 1950). Under a night temperature lower than the optimal night temperature, the dry mass accumulation rate and radiation use efficiency decrease because of decreases in the assimilation rate of carbon and carbohydrate distribution (Kim and Lee, 2008).
The yield of crops grown in a greenhouse depends largely on the amount of light intercepted by plants (Fjeld et al., 1994). In general, the light saturation point of a rose plant for photosynthesis is 851 µmol m-2 s-1 PAR (37 klux), but there are differences among varieties (RDA, 2012). The optimal daily integral light of rose plants is 12–15 mol·d-1 (Mortensen et al., 1992). There is a positive correlation between productivity and accumulated light intensity. More than 75% of biomass production in rose plants can be obtained by light interception (Mor and Halevy, 1980). Therefore, among environmental factors, light has the greatest effect on the growth of rose plants in greenhouses (Jiao and Grodzinski, 1998; Blom and Tsujita, 2003). Also, light quality can affect the development of roses. Red light promotes bud break by weakening apical dominance and promotes flower development by activating the sink strength of flower buds, but far-red light has the opposite effect (Cline, 1991).
The plant growth model is an analysis of plant response to major environmental factors that affect plant growth such as light, temperature, CO2, and humidity, and it can predict changes in plant growth that follow changes in the environment. Therefore, the plant growth model can be a valuable tool for making decisions on culture conditions to increase productivity and optimize microclimate control. Also, it can be used as basic data for an automated environmental control system in greenhouses (Challa, 2002; Fourcaud et al., 2008).
As protected cultivation has become modernized, it is easier to control environmental factors in the greenhouse because environmental data can be obtained in real time. Thus, growers are using sophisticated computers and automated complex environmental control systems in the greenhouse (Dayan et al., 2002). However, complex environmental control systems cannot set autonomously optimal environmental conditions for optimal plant growth. Hence, the applicability of the plant growth model in greenhouses has been increasing (Kim, 2005; Kim, 2013). This study was conducted to validate and modify the applicability of the shoot growth model of cut roses developed by a previous study under the cultivation environment in Korea.
Materials and Methods
Plant Materials
Four cultivars of standard cut roses were used as plant materials. Two domestic cultivars, ‘Antique Curl’ and ‘Beast’, are from cut rose greenhouses located at Noejo-ri, Jori-eup (Farm A), and two foreign cultivars, ‘Ahoi’ and ‘Fuego’, are from cut rose greenhouses located at Galhyun-ri, Tanhyun-myun (Farm B) in Paju, Gyeonggi-do, Korea. These four cultivars were cultivated by the soil-less culture arching technique with rock wool media. Seventy-two flowering shoots of each cultivar were cut at the same height (above the first five leaflet) and labeled on the same day.
Greenhouse Environment
The environmental data of the greenhouses (Farm A and B) were measured from September 7 to November 3, 2017. Light intensity, temperature, and relative humidity were measured once per hour using a wireless data logger (WatchDog Micro Stations, Spectrum Technologies Inc., USA). Supplemental lighting was not applied during the experiment period.
Plant Growth
To measure the growth of cut roses during a flowering cycle, 72 flowering shoots of the 4 cultivars were pruned (above one five leaflet) on the same day. Then, 10 sprouting axillary buds from each cultivar were harvested once per week. Harvested shoots were separated as stems, leaves, or flowers. Then, shoot length and leaf number were measured. Total leaf area was measured with an LI-3100C Area Meter (LI-COR Biosciences, USA), and the dry weight of stem, leaves, and flower was measured after drying in a drying oven (HSD-38RM, Vision Scientific Co., Ltd, Korea) at 75°C for 72 hours.
Model Description
The model used in this study was developed by Kim and Lieth (2012) to predict growth of cut roses and nutrient uptake during a flowering cycling using temperature and a light function. This model was composed of three sub-models for shoot growth, root growth, and nutrient uptake.
The shoot growth model is based on the “short-cut” light use efficiency concept. Light use efficiency (LUE) is the ratio of dry mass and daily intercepted light (I) by plant canopy (Q) (Eq. 1 and 1.a) (Monteith, 1994). The extinction coefficient (k) for I was given as 0.65 (Goudriaan, 1994).
Therefore, shoot growth rate can be expressed by LUE and Q (Eq. 2). LUE can be assumed by an exponential equation (Eq. 3). Values of the parameter LUEmax,0 and “a” in Eq. 4 were given as 0.0203 and 0.1151 g (dry mass DM·MJ-1) in a previous study (Kim and Lee, 2002).
Then, the function of temperature that was used to calculate the relative rose growth ratio in the temperature range of 5 to 40°C was multiplied to give the shoot growth rate equation (Eq. 4). Finally, daily shoot growth rate was expressed as in Eq. 4.
Leaf area index (LAI) in Eq.1 was calculated by the Michaelis-Menten kinetics relationship between shoot DM and leaf area per shoot (Eq. 5) (Kim and Lieth, 2012). Maximal potential leaf area per shoot was 0.1211 m2 and theoretical shoot DM was 0.1232 g when the first leaf began to unfold in ‘Kardinal’ rose cultivar. Thus, LAI was simulated by function of shoot DM per unit area (m2).
Model Validation
The predicted shoot growth was calculated by the shoot growth model, which uses daily mean temperature, accumulative light, and predicted leaf area as in Eq. 5 during the experiment period. The model was validated by regression analysis between measured shoot growth per week and predicted shoot growth using Eq. 4.
Statistical Analysis
Statistical Analysis System (SAS) version 9.4 (SAS Institute Inc., Cary, NC, USA) was used to analyze the experimental data for multiple comparisons by analysis of variance (ANOVA) and to calculate the correlation efficient between measured and estimated data. Differences between means of treatments were assessed with Duncan’s new multiple range test (p < 0.05).
Results and Discussion
Environment in the Greenhouse
Environmental data in the greenhouse were measured by a data logger every hour. Daily mean temperature recorded during a flowering cycle from cutting to harvest was 23.8 ± 0.7°C at farm A and 23.6 ± 1.2°C at farm B. Mean daily accumulated light was 7.0 ± 2.0 MJ·d-1 at farm A and 7.5 ± 3.4 MJ·d-1 at farm B. Environmental conditions (temperature and light) of farms A and B showed no statistically significant differences during the experiment period.
Growth of Cut Roses in Domestic Greenhouse Conditions
Plant growth characteristics (shoot length, leaf number, leaf area, and dry mass) were measured by harvesting 10 shoots of each cultivar once a week, and the plant growth of the 4 cultivars at the harvest stage was compared by statistical analysis (Table 1). The comparison of plant growth characteristics at the harvest stage showed that all were greater in ‘Fuego’ than the other cultivars except for leaf number. In particular, the leaf area of ‘Fuego’ was 2 times higher than that of ‘Antique Curl’ on farm A. ‘Beast’ and ‘Ahoi’ showed no statistically significant differences in shoot length and total dry mass. ‘Beast’ and ‘Ahoi’ had intermediate growth characteristics between ‘Fuego’ and ‘Antique Curl’. In the case of ‘Antique Curl’, both leaf area and dry mass were lower than for the other cultivars (Table 1). As there was no difference in the environmental conditions between farm A and farm B, the growth differences of the four cultivars may be because of varietal characteristics. From these results, it may concluded that ‘Antique Curl’ is a small type rose and ‘Fuego’ is a large type rose.
Table 1.
Shoot length, leaf number, leaf area, and shoot dry mass of four cut rose cultivars at harvest
| Farm | Cultivar |
Shoot length (cm) | Number of leaves |
Leaf area (cm2) | Dry mass (g) | |||
| Stem | Leaf | Flower | Total | |||||
| A | Antique Curl | 82.5 bz | 12.2 c | 651.2 d | 4.7 b | 1.8 b | 2.6 c | 9.1 c |
| Beast | 78.7 bc | 18.6 a | 990.6 b | 5.1 b | 1.4 c | 4.0 b | 10.5 bc | |
| B | Ahoi | 76.0 c | 12.6 c | 818.8 c | 5.8 b | 2.3 a | 3.6 b | 11.7 b |
| Fuego | 90.8 a | 16.3 b | 1206.4 a | 8.3 a | 2.4 a | 5.1 a | 15.8 a | |
Comparison between Measured and Estimated Leaf area using the Leaf Area Equation
To validate the leaf area equation (Eq. 5) used in the shoot growth model, dry mass and leaf area of the four cultivars were measured every week. During the flowering cycle, the simulated leaf areas from the leaf area model in Eq. 5 were used in a comparison with measured data. The simulated patterns of the leaf area model matched well with measured leaf area in ‘Beast’ and ‘Ahoi’. However, for ‘Fuego’, the model underestimated the leaf area as dry mass increased. By contrast, the model overestimated the leaf area at all dry mass values for ‘Antique Curl’ (Fig. 1).
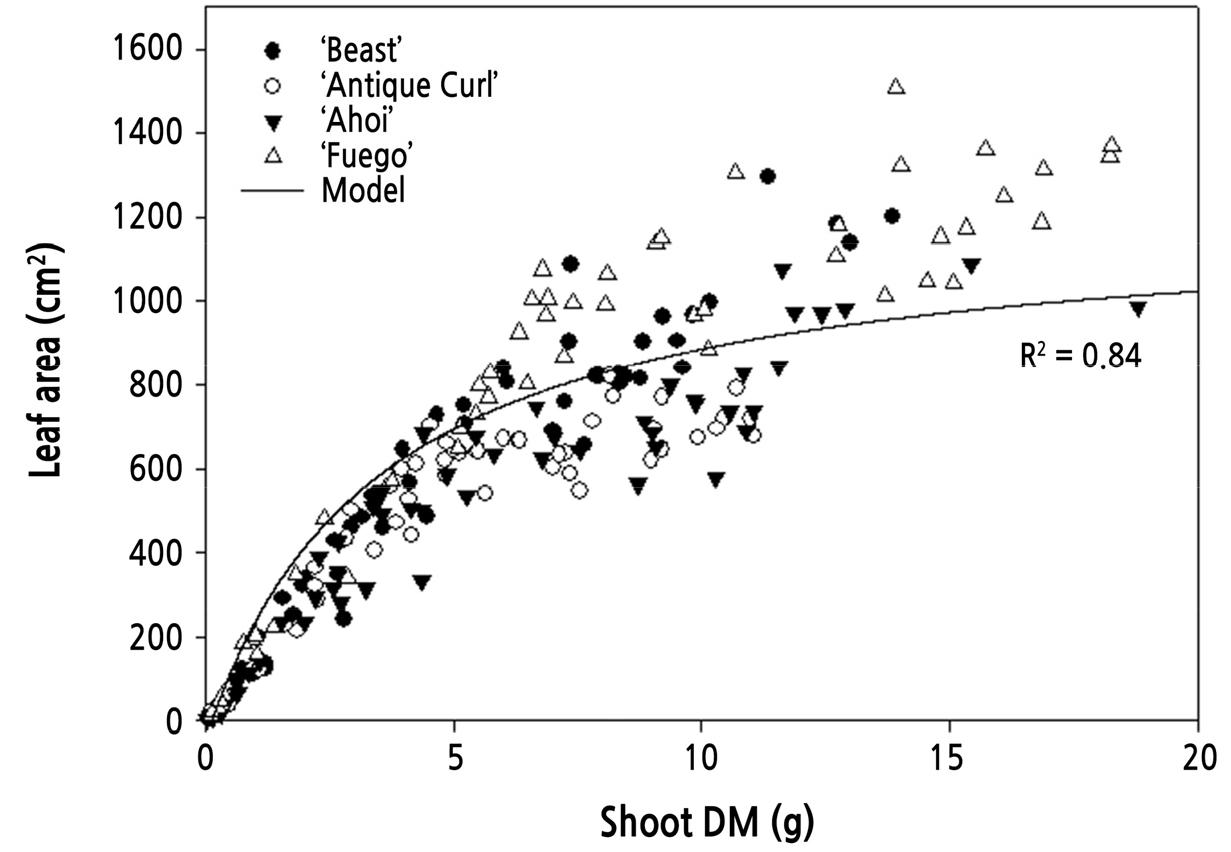
Fig. 1.
Correlation between measured and estimated leaf area of cut roses ‘Antique Curl’, ‘Beast’, ‘Ahoi’, and ‘Fuego’ using Eq. 5 (n = 280).
To validate the applicability of the leaf area equation (Eq. 5), the estimated leaf area data of all cultivars were compared with the measured data using linear regression analysis regardless of cultivar. Because of the leaf area characteristics of ‘Fuego’ and ‘Antique Curl’, the model overestimated when the measured leaf area was low and underestimated a little when the measured value was high. Although most of the estimated values matched well with the measured values (R2 = 0.84), it seemed that the leaf area equation needed to be modified to improve the model and to reduce the overestimation and underestimation in the two cultivars (Fig. 1).
Validation of the Shoot Growth Model
The shoot growth model in Eq. 4 simulated shoot growth (shoot dry mass) by inputting environmental data (daily mean temperature and daily accumulated light) and estimated leaf area using Eq. 5. The simulated patterns of shoot growth of the four rose cultivars were compared with the measured data from harvesting once a week (Fig. 2). The correlation was calculated by linear regression analysis between estimated shoot growth and mean shoot growth of each of the four cultivars.
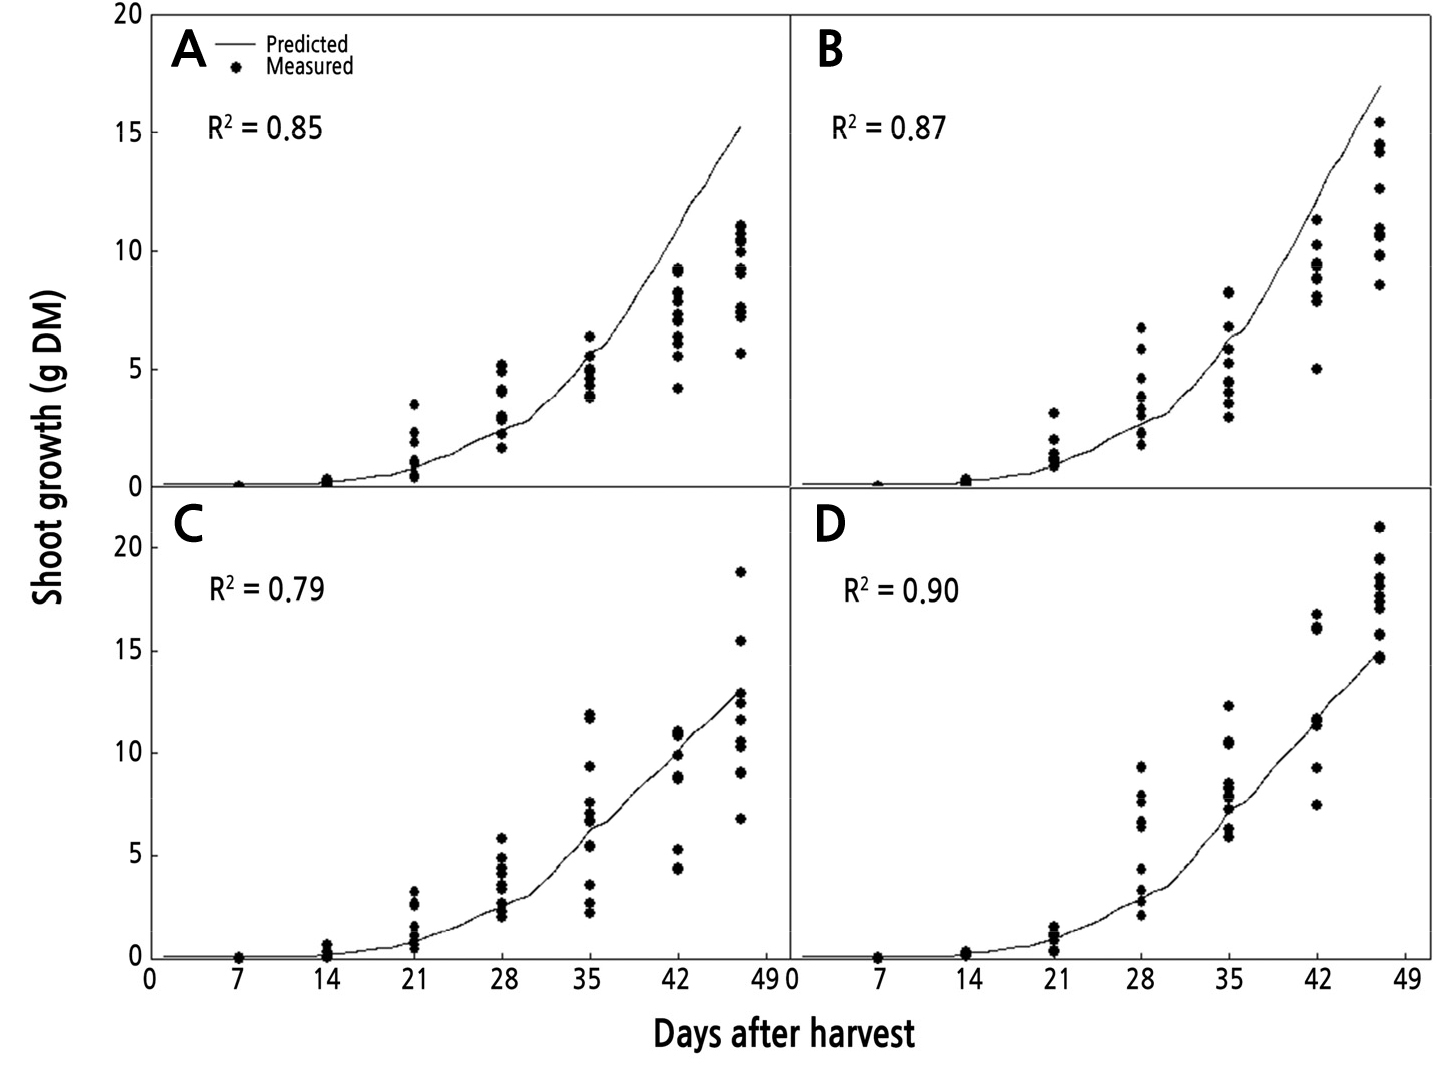
Fig. 2.
Comparison of measured and predicted shoot growth of cut roses ‘Antique Curl’ (A), ‘Beast’ (B), ‘Ahoi’ (C), and ‘Fuego’ (D) using Eq. 4. Data were measured every week during one flowering cycle (n = 10).
The results of the simulation of shoot growth using Eq. 4 showed that the shoot growth simulation of farm A was higher than that of farm B. Although there was no statistically significant difference in the environmental conditions between farm A and farm B during the experiment period, the relative growth rate by the temperature function was higher on farm A. This was because the optimal temperature was maintained during the early stage and the light intensity was higher from the 32nd day to harvest on farm A.
In the comparison between measured and estimated shoot growth, shoot growth for ‘Antique Curl’ was well estimated from cutting until the 35th day; however, from the 35th day to harvesting the shoot growth was overestimated (R2 = 0.85) (Fig. 2A). ‘Beast’ was even better estimated than ‘Antique Curl’ from cutting to harvest, but there was an overestimate shown at harvest (R2 = 0.87) (Fig. 2B). ‘Ahoi’ was well simulated in all growth phases, but a high deviation of the data caused a low coefficient of determination (R2 = 0.79) (Fig. 2C). ‘Fuego’ had the highest coefficient of determination value among the four cultivars (R2 = 0.90), and the whole simulation was well estimated. However, it showed an underestimate at the final harvesting stage (Fig. 2D). The results of the validation experiment showed that the existing model (Eq. 4) provides good simulation of the shoot growth of the four rose cultivars with a high coefficient of determination (Fig. 2). It is believed that this model can be applied to different cultivars and different farms by inputting only environmental factors (temperature and light). Thus, this model can predict shoot growth changes with changes in the environment and can provide support for growers in efficiently controlling the microclimate in greenhouses, such as supplemental light, screening, and heating, as well as managing harvest timing. Temperature and light are the most important factors that affect the growth of cut roses (Mor and Halevy, 1980; Park and Kim, 2019), and light control interacts with temperature control, i.e., supplemental lighting and heating using high-pressure sodium (HPS) lamps and shading screens for reducing the temperature (Sarkka, 2003). Therefore, to control these factors, it is important to understand the interaction between light and temperature. This model can be a valuable tool for controlling light and temperature more efficiently by predicting the growth of cut roses with changes in environmental factors (Park and Kim, 2019).
In addition, automated environmental control systems are the standard for modern greenhouses. These systems are based on using a crop growth model for estimating plant growth with changes in environmental conditions (Kim and Lieth, 2012). Thus, the shoot growth model can be used as basic data for software in an automated complex environmental controller by monitoring environmental conditions in real time and a criteria activator for optimal environmental control (Fig. 3).

However, the shoot growth model overestimated in the case of ‘Antique Curl’ and underestimated in the case of ‘Fuego’ at the harvest stage. Because the productivity of cut roses is determined by shoot growth at the harvest stage, overestimates and underestimates at the harvest stage can lead to less efficient environmental control. Eventually, this leads to negative effects on cut rose production and energy efficiency. Thus, a modification to increase the accuracy of the model at the harvest stage is necessary for increasing the applicability of the model in protected cultivation.
Modification of Leaf Area Model
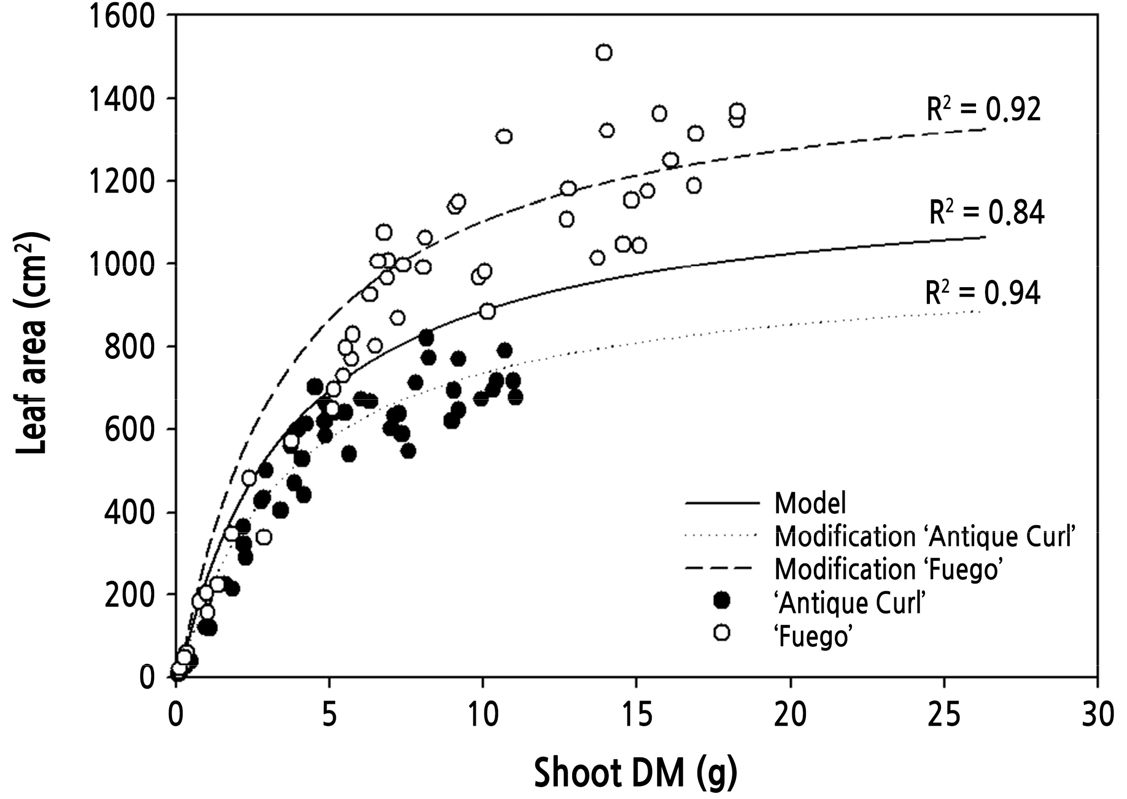
In the validation experiment of the leaf area equation, overestimation and underestimation were shown for ‘Antique Curl’ and ‘Fuego’, respectively. Overestimation and underestimation in the two cultivars (‘Antique Curl’ and ‘Fuego’) in the validation experiment were thought to be the result of overestimation and underestimation of the leaf area model. The maximum leaf area potential coefficient of ‘Kardinal’ rose plants in a previous study (Kim and Lieth, 2012) was 0.1211 m2. However, in this study, the maximum leaf area in ‘Antique Curl’ was 30% lower, and the maximum leaf area in ‘Fuego’ was 25% higher than the maximum leaf area potential value in the leaf area model with ‘Kardinal’ rose plants, which resulted in the overestimation and underestimation of the model. Thus, a simple modification of the maximum potential leaf area coefficient in the LA model (Eq. 5) was conducted to improve the accuracy of the prediction for shoot growth.
The maximum potential leaf area coefficient of Eq. 5 was modified to 0.1008 m2 in ‘Antique Curl’ and 0.1508 m2 in ‘Fuego’. Then, the predicted shoot growth using the modified model was compared with the measured shoot growth. The shoot growth model using the modified leaf area equation showed an improved performance for both cultivars compared with the existing model while maintaining a high coefficient of determination (Fig. 4). This result indicates that a simple modification of the maximum potential leaf area coefficient can improve the accuracy of the shoot growth model when applied to cultivars that have a maximum leaf area either smaller or greater than the maximum leaf area coefficient used by the existing leaf area model.
Validation of Shoot Growth using a Modified Model
By modification of the leaf area equation for ‘Antique Curl’ and ‘Fuego’, the modified leaf area model gave more accurate predictions than the existing leaf area model. Thus, the shoot growth model using the modified leaf area equation simulated the shoot growth of ‘Antique Curl’ and ‘Fuego’, and then the estimated values were used in a comparison with the measured shoot growth (Fig. 5). The shoot growth model using the modified equation provided an accurate estimation at the harvest stage while maintaining a high coefficient of determination in the two cultivars. However, the modified model underestimated the leaf area at the early growth stage in ‘Antique Curl’.
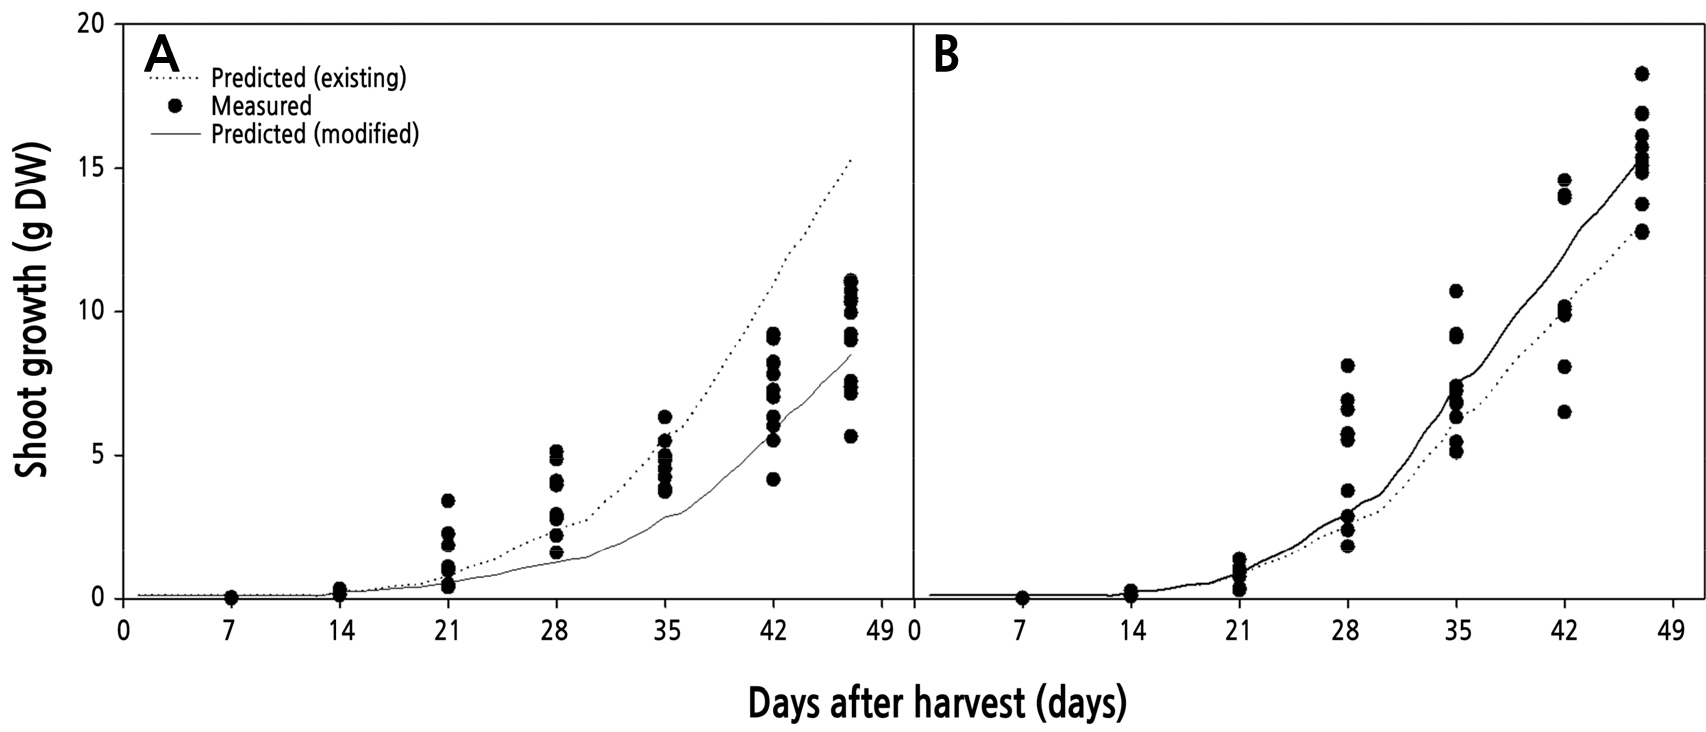
Fig. 5.
Comparison of measured and predicted shoot growth of cut roses ‘Antique Curl’ (A) and ‘Fuego’ (B) from Eq. 4. The predicted shoot growth by the modified model (Eq. 4) was explained using the existing and modified maximum potential leaf area coefficients. The existing coefficient (0.1211 m2) was altered to 0.1008 m2 in ‘Antique Curl’ (A) and to 0.1508 m2 in ‘Fuego’ (B) in Eq. 5. Data were measured every week during one flowering cycle (n = 10). The fitting of the modified model statistically resulted in R2 = 0.94 for ‘Antique’ and R2 = 0.98 for ‘Fuego’ (solid lines) compared to the existing model of R2 = 0.85 and 0.90, respectively (dotted lines).
In conclusion, the applicability of the rose shoot growth model developed by a previous study was validated as a means to support growers in controlling the microclimate in greenhouses, such as for temperature and light, which affect rose growth. The model also can be used as basic input data for software used in an automated environmental control system. The results of the validation showed that this model provided a good estimate of the shoot growth rate with a high coefficient of determination (R2 = 0.84, 0.87, 0.79, and 0.90) in four cultivars of standard roses at two rose farms. If the leaf area is smaller or larger than the maximum leaf area coefficient of the leaf area equation, a simple modification of the maximum leaf area coefficient value can increase the accuracy of the shoot growth model. This can be used to support growers in deciding which environmental control strategy can provide the optimal environment for high quality and high productivity (Fig. 3).
