Introduction
Materials and Methods
Plant material
Absolute fruit growth rate
Microscopy
Extraction of pectin
Pectin-methylesterase activity measurement
Polygalacturonase activity measurement
Meteorological data
Statistical analysis
Results
Changes in fresh weight during fruit growth and development
Pectin contents and enzymes activities during fruit growth and development
Correlation between meteorological variables and fruit growth
Discussion
Conclusion
Introduction
Fruit size is an important factor that determines the quality of the fruit. The final size is greatly impacted by changes in the biochemical and molecular processes that occur at every phase of fruit growth and development. Notably, fruit size is determined by changes in the cell number and size after rapid cell division at the beginning of fruit growth, followed by a long period of cell expansion. The rate, duration, and plane orientation of cell division as well as the direction and degree of cell expansion are key parameters that profoundly affect the final fruit size (van der Knaap and Østergaard, 2018). The final fruit size is also influenced by cell wall component assembly and disassembly processes involving pectin, hemicellulose, and cellulose (Goulao and Oliveira, 2008; Brahem et al., 2017; Lee et al., 2022). Lahaye et al. (2021) explained that fruit firmness declines with cell wall polysaccharide remodeling, which is disassembled by enzyme consortia and various non-enzymatic mechanisms during fruit growth and development. In European pears, stone cells contain high levels of cellulose, hemicellulose, and lignin, while parenchyma cells have high levels of pectin (Brahem et al., 2017). The characteristics of pears during their softening were compared, and it was found that European pears’ softening was closely related to changes in hemicellulose and pectin contents. In contrast, the softening of Chinese and Japanese pears was related to changes in hemicellulose and pectin contents, respectively (Hiwasa et al., 2004). Sirisomboon et al. (2000) showed that pectin constituents were related to texture in Asian pears. Therefore, pectin composition and organization alterations are vital during the growth and development of Asian pears.
Pectin can regulate porosity, water uptake, and swelling in the cell wall and cell-to-cell adhesion by acting as a hydrophilic filler in the interlayer space between cellulose and hemicellulose (Willats et al., 2001; Zdunek et al., 2014; Wormit and Usadel, 2018). Many cell-wall enzymes are involved in cell-wall architecture modifications during fruit growth and development (Brummell, 2006; Kwon et al., 2022; Torun and Uluisik, 2022), including the pectin-degrading enzymes polygalacturonase (PG), pectin methylesterase (PME), and pectate lyase. Generally, PME catalyzes the demethylesterification of homogalacturonan in a block-wise fashion, resulting in the stiffening of the cell wall. In contrast, random demethylesterification of homogalacturonan by PME promotes the action of PG, which loosens the cell wall. According to Kozioł et al. (2017), the PG activity is positively correlated with stiffness in ripe pears, regardless of the PME activity. According to studies of the role of PME and PG during fruit growth and maturation, it was found that their involvement in general depends on the crop variety (Zhang et al., 2020; Zhang et al., 2021; Byeon et al., 2022).
However, sufficient information is not available pertaining to how PME and PG activities affect Asian pears during their fruit growth and development stage. Therefore, this study aims to identify whether fruit size changes are affected by pectin content alterations or PME and PG activities during fruit growth and development of this fruit. To address, we examine the fruit shape variations, pectin contents, and the activities of pectin-degrading enzymes, i.e., PME and PG, during fruit growth and development.
Materials and Methods
Plant material
Fruits of Pyrus pyrifolia cv. Niitaka grown under standard management practices were harvested from a pear orchard (34°58'34.1"N 126°42'12.7"E; 25-30m above sea level; 0.83ha) for three consecutive seasons (2019, 2020, and 2021). The full bloom dates were April 9, 2019; April 8, 2020; and April 6, 2021. Fifteen fruits were randomly sampled from the same fruit-bearing position on trees trained to pergola systems at 15-day intervals from 30 to 180 days after full bloom (DAFB) in each year. The fruits were measured in terms of their weight, diameter, and length immediately upon harvest, and their cores and skin were removed. Samples were frozen in liquid nitrogen and kept at -60°C until further analysis. Unless otherwise stated, all experiments were performed in triplicate.
Absolute fruit growth rate
The absolute fruit growth rate (AGR) was estimated by the following relationship (Zibordi et al., 2009):
AGR (g d-1) = (Wt1 – Wt0) / (t1-t0),
where Wt1 and Wt0 are the estimated fruit weight (g) at a given time (t1) and at the previous sampling time (t0), respectively.
Microscopy
Fruits were fixed and embedded in paraffin wax. Specimen slides were prepared on a microtome (Shandon, Cheshire, England) with a thickness setting of 15 µm per slice. Specimens were stained with 0.5% toluidine blue O (Sakai, 1973). Bright-field microscopy images were obtained using light microscopy (Zeiss Axiostar Plus Microscope, Carl Zeiss MicroImaging, Inc., Germany).
Extraction of pectin
The pectin content was assayed as described by Yamaki et al. (1979) with a slight modification. To extract pectin, 300mg of a lyophilized and powdered sample was used. After removing soluble sugar, starch, and lignin, 1 mL of 0.05 M ethylene diamine tetra-acetic acid (EDTA) was added to the sample. Next, the sample was reacted at 80°C for 30 min and then centrifuged at 13,000 rpm for 15 min. The resulting pellet was washed in 1 mL of distilled water three times by centrifugation at 13,000 rpm for 15 min. The remaining residue was dried at 60°C for 24 h and then weighed. The pectin content was calculated by the following equation:
Pectin content (%) = [(A – B) / C] × 100,
where A is the sample weight before extraction (g), B is the sample weight after extraction (g), and C is the initial sample weight (g).
Pectin-methylesterase activity measurement
The PME activity was assayed as described by Ren et al. (2020) with a slight modification. To 200mg of the lyophilized sample, 1 mL of 1 M sodium chloride (pH 7.5), 1.5% (w/v) polyvinylpyrrolidone (PVP), and 1 mM phenylmethylsulfonyl fluoride (PMSF) were added and reacted at 4°C for 15 h, followed by centrifugation at 13,000 rpm for 15 min. Next, to 100 µL of the supernatant from the previous step, 100 µL of distilled water, 150 µL of 0.05% bromothymol blue dissolved in 0.1 M sodium phosphate buffer (pH 7.5)/EtOH (95%), and 600 µL of 0.5% pectin were added. After reacting the mixture at 37°C for 1 h, the absorbance was measured at 620 nm using a microplate reader (Mobi, MicroDigital Co., Ltd., Korea). The blank was subjected to procedures identical to those of the sample, except for the omission of the incubation step.
Polygalacturonase activity measurement
The PG activity was assayed as described by Chen et al. (2015) with a slight modification. First, 1.5 mL of 1 M sodium acetate buffer (pH 5.0), 0.5 M sodium chloride, 1 mM EDTA, 5% (w/v) PVP, and 1 mM PMSF were added to 200mg of the lyophilized sample. The mixture was reacted at 4°C for 15 h and then centrifuged at 13,000 rpm for 15 min. Next, 100 µL of 1% (w/v) pectin was added to 100 µL of the supernatant of the previous step and the resulting mixture was reacted at 50°C for one hour. Subsequently, 600 µL of the 3,5-dinitrosalicylic acid (DNS) reagent was added to the reaction mixture, which was boiled for 5 min and then centrifuged at 13,000 rpm for 3 min. The absorbance of the supernatant was measured at 540 nm using a microplate reader (Mobi, MicroDigital Co., Ltd., Korea). The blank was subjected to the same procedures except that incubation was conducted at 50°C.
Meteorological data
Daily maximum and minimum temperatures and precipitation levels were collected from 30 to 180 DAFB through automatic weather stations located in Naju-si, Korea. Daily mean temperatures were calculated as an average of daily observations (e.g., the average of daily maximum and minimum temperatures). The diurnal temperature ranges were calculated as the difference between daily maximum and minimum temperatures. To perform a correlation analysis with all of the fruit variables, daily meteorological data were converted to 15-day average values.
Statistical analysis
The results were analyzed using SAS 9.4 (SAS Institute Inc., Cary, NC, USA). Duncan’s multiple range test was used to examine statistical differences in values between years for the same growth stage and between fruit growth stages within the same year. Differences at p < 0.05 were considered significant. The analysis of the correlation heatmap was conducted using MetaboAnalyst 5.0 (https://www.metaboanalyst.ca).
Results
Changes in fresh weight during fruit growth and development
The fresh weight of the fruits sampled in 2019 and 2021 increased slightly until 105 DAFB, followed by a rapid increase to 165 DAFB, at which these values remained constant until maturity (Fig. 1A). Unlike the other two years, fruits sampled in 2020 showed a more pronounced increase in their fresh weight after 105 DAFB and reached their final weight at 135 DAFB. As shown in Fig. 1B, the fruit diameters in 2020 were greater than those in the other two years after 75 DAFB, reaching their maximum size at 150 DAFB. Fruits harvested in 2019 and 2021 were shown to undergo similar growth up to 135 DAFB, but differences in diameters were observed after 135 DAFB. The differences in fruit diameter were evident during development over the three years, but there were no size differences at maturity. A similar trend was also noted in the fruit length over the three years, akin to the fruit diameter (Fig. 1C). The maximum absolute fruit growth rate (AGR) was lower and occurred slightly later in the fruits from 2019 and 2021 compared to those of the fruits from 2020 during the season. Fruit AGR remained low from 45 to 75 DAFB and then gradually increased, reaching maximum levels at 135 DAFB in 2020 and 2021 and at 150 DAFB in 2019 (Fig. 1D). Microscopic observations revealed that the cell size increased to 165 DAFB in 2019 and 2021 and to 150 DAFB in 2020 (Fig. 1E).
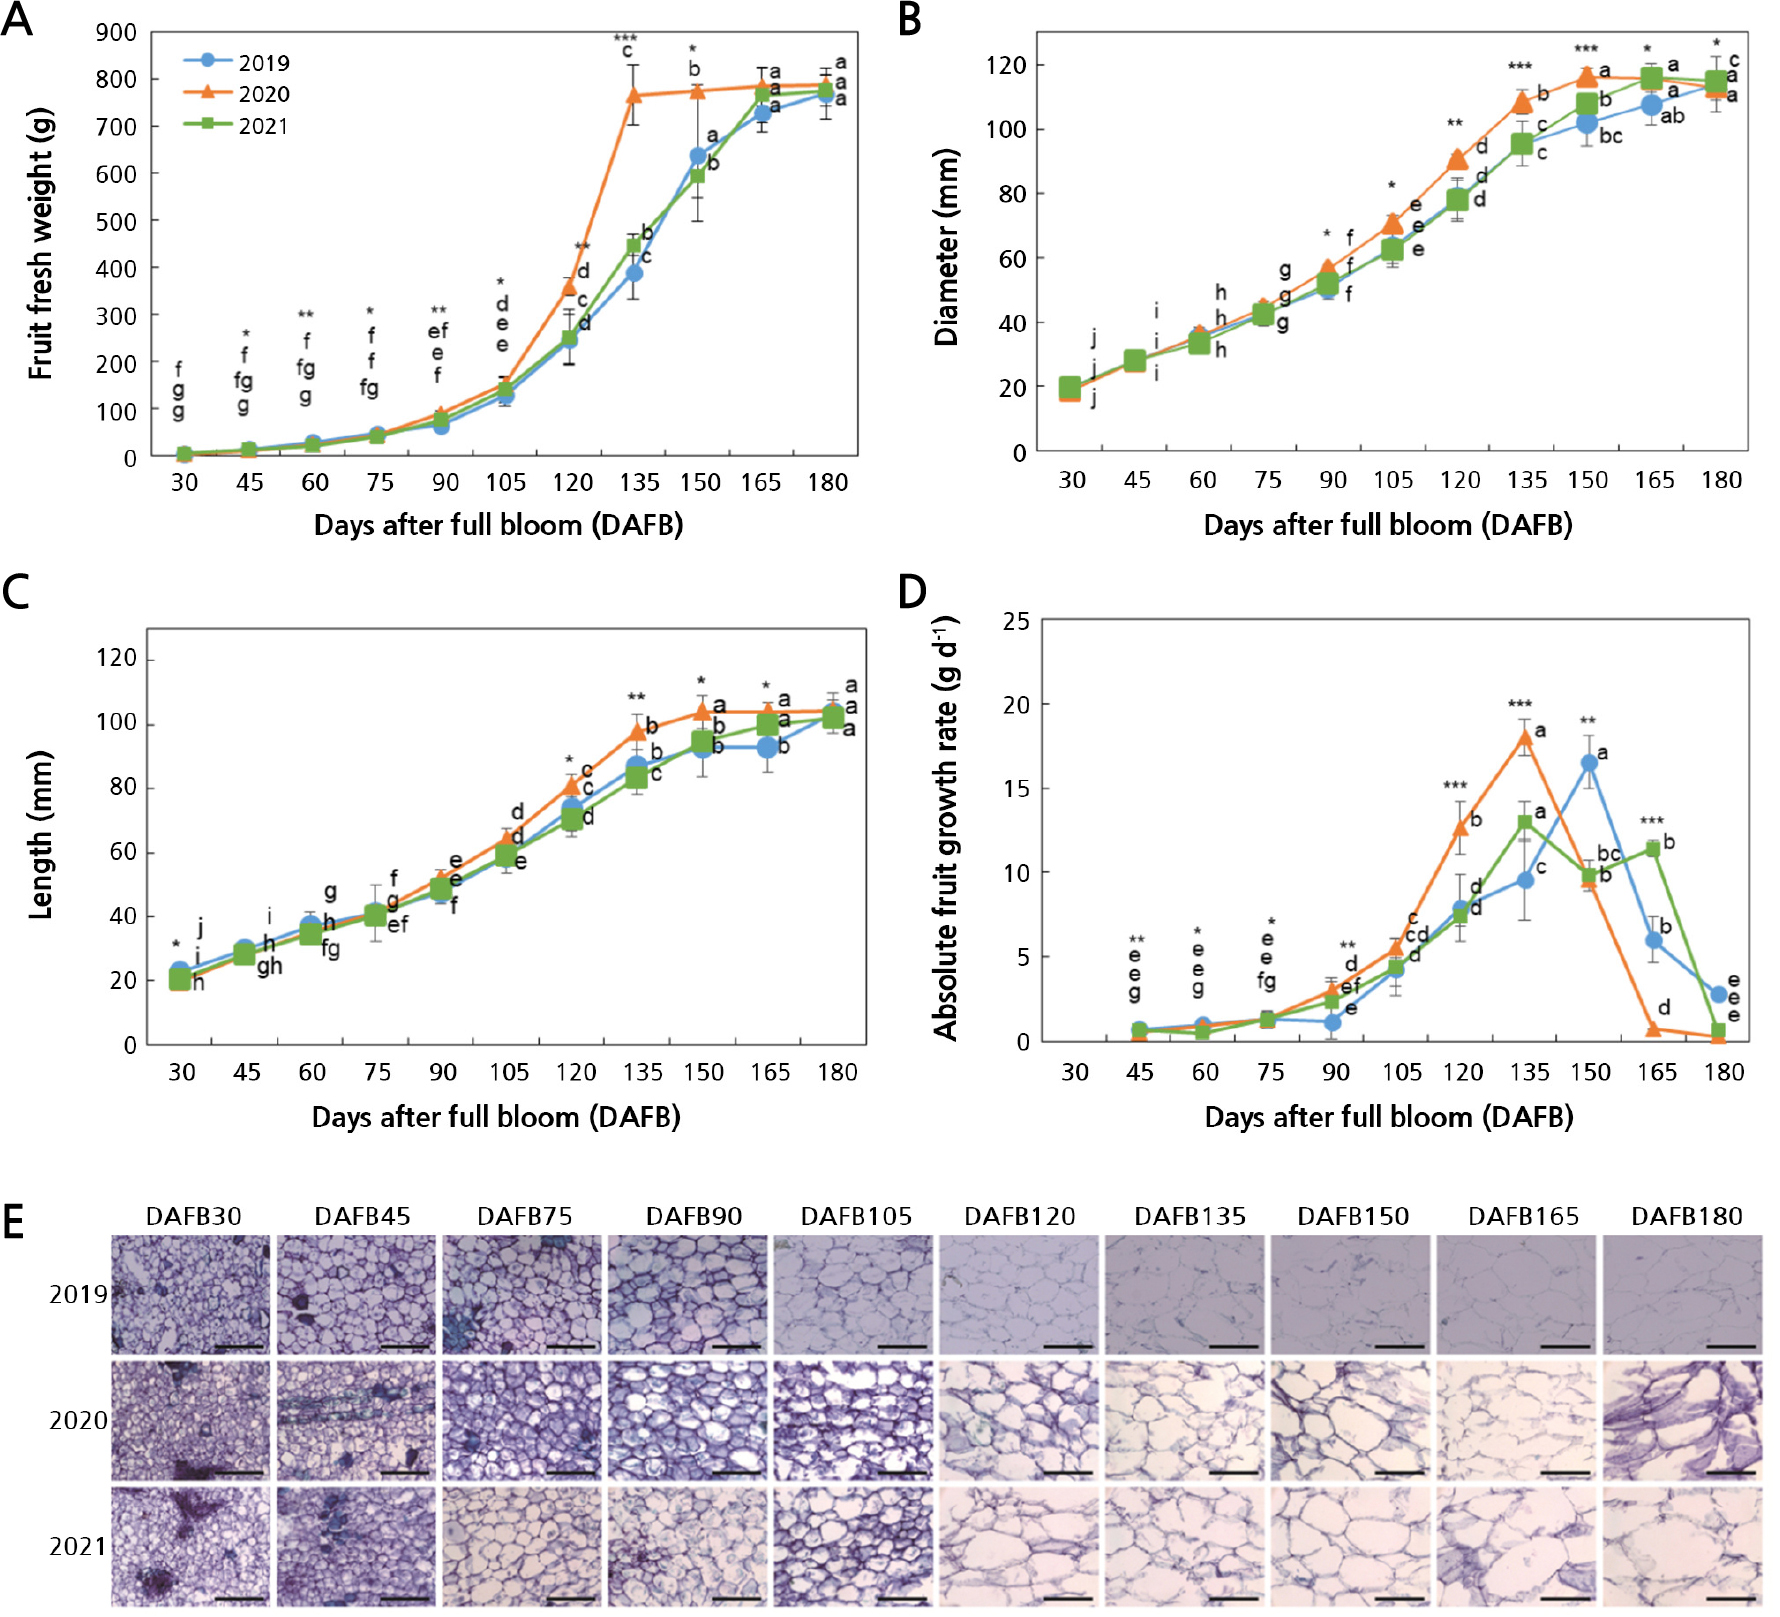
Fig. 1.
Changes in fruit fresh weights (A), diameters (B), lengths (C), absolute fruit growth rates (D), and cell sizes (E) during the development of Asian pears harvested from 2019 through 2021. Data represent the mean ± SD (n = 15). Different letters indicate significant differences across sampling times for each year (p < 0.05). Asterisks indicate significant differences among years at each sampling time (* p < 0.05, ** p < 0.01, *** p < 0.001). Scale bars represent 200 µm.
Pectin contents and enzymes activities during fruit growth and development
Pectin contents significantly differed from 30 to 180 DAFB (Fig. 2). In 2021, the pectin content started to decrease from 90 DAFB, while in 2019 and 2020, it began to decrease from 30 DAFB onward. However, the initial 2019 fruit pectin content was approximately three times higher than in the 2020 and 2021 fruits, remaining markedly higher throughout the development stage. From 30 to 90 DAFB, the pectin contents of the fruits in 2021 were higher than those in the fruits in 2020 during the same DAFB interval. No significant difference was found in the pectin content between the two years thereafter.
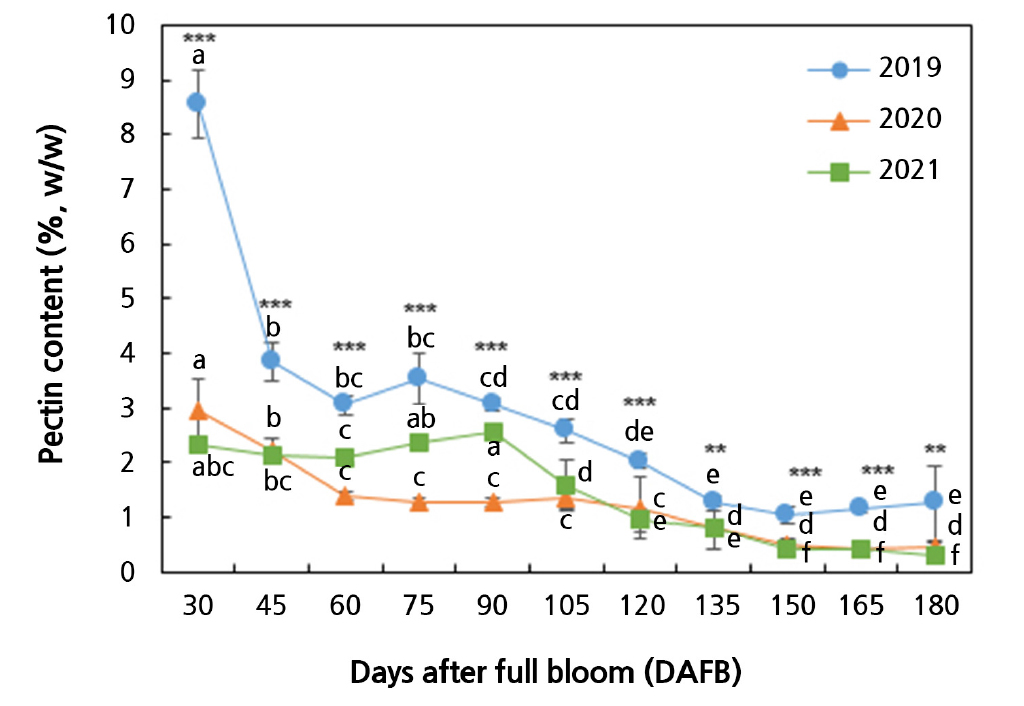
Fig. 2.
Changes of pectin contents during the development of Asian pears harvested from 2019 through 2021. Data represent the mean ± SD (n = 3). Different letters indicate significant differences across sampling times for each year (p < 0.05). Asterisks indicate significant differences among years at each sampling time (* p < 0.05, ** p < 0.01, *** p < 0.001).
The PME and PG activities were assayed to confirm whether the pectin content fluctuations during pear fruit development are associated with pectin-degrading enzymes (Fig. 3). While the PME activity tended to decrease continuously during fruit development, the PG activity decreased for a certain period and then increased. Specifically, PME activity was high during the early fruit development stage, whereas PG activity was elevated in the later stage. The time point of the rapid decrease in the PME activity differed over the three years considered in this study: 120 DAFB, 105 DAFB, and 90 DAFB in 2019, 2020, and 2021, respectively. In 2019 and 2020, the PG activities declined sharply between 30 and 75 DAFB, followed by a gentle increase until 120 DAFB. While the PG activity in 2020 declined gently from 120 DAFB until 180 DAFB, that in 2019 declined gently between 120 and 150 DAFB and then peaked at 165 DAFB, followed by another decline, again reaching the level observed at 150 DAFB. Comparatively, the 2021 PG activity decreased gradually between 30 and 90 DAFB and then increased until 165 DAFB. The PG activity began to increase at 75 and 135 DAFB in 2019, 75 DAFB in 2020, and 90 DAFB in 2021. The gradual increase in the PG activity with the decrease in the PME activity led to the intersection of these two factors. These intersections of the two enzyme activities were different over the three years considered herein. The time points when the increase in the PG activity intersected with the decrease in the PME activity were 150, 105, and 120 DAFB in 2019, 2020, and 2021, respectively.
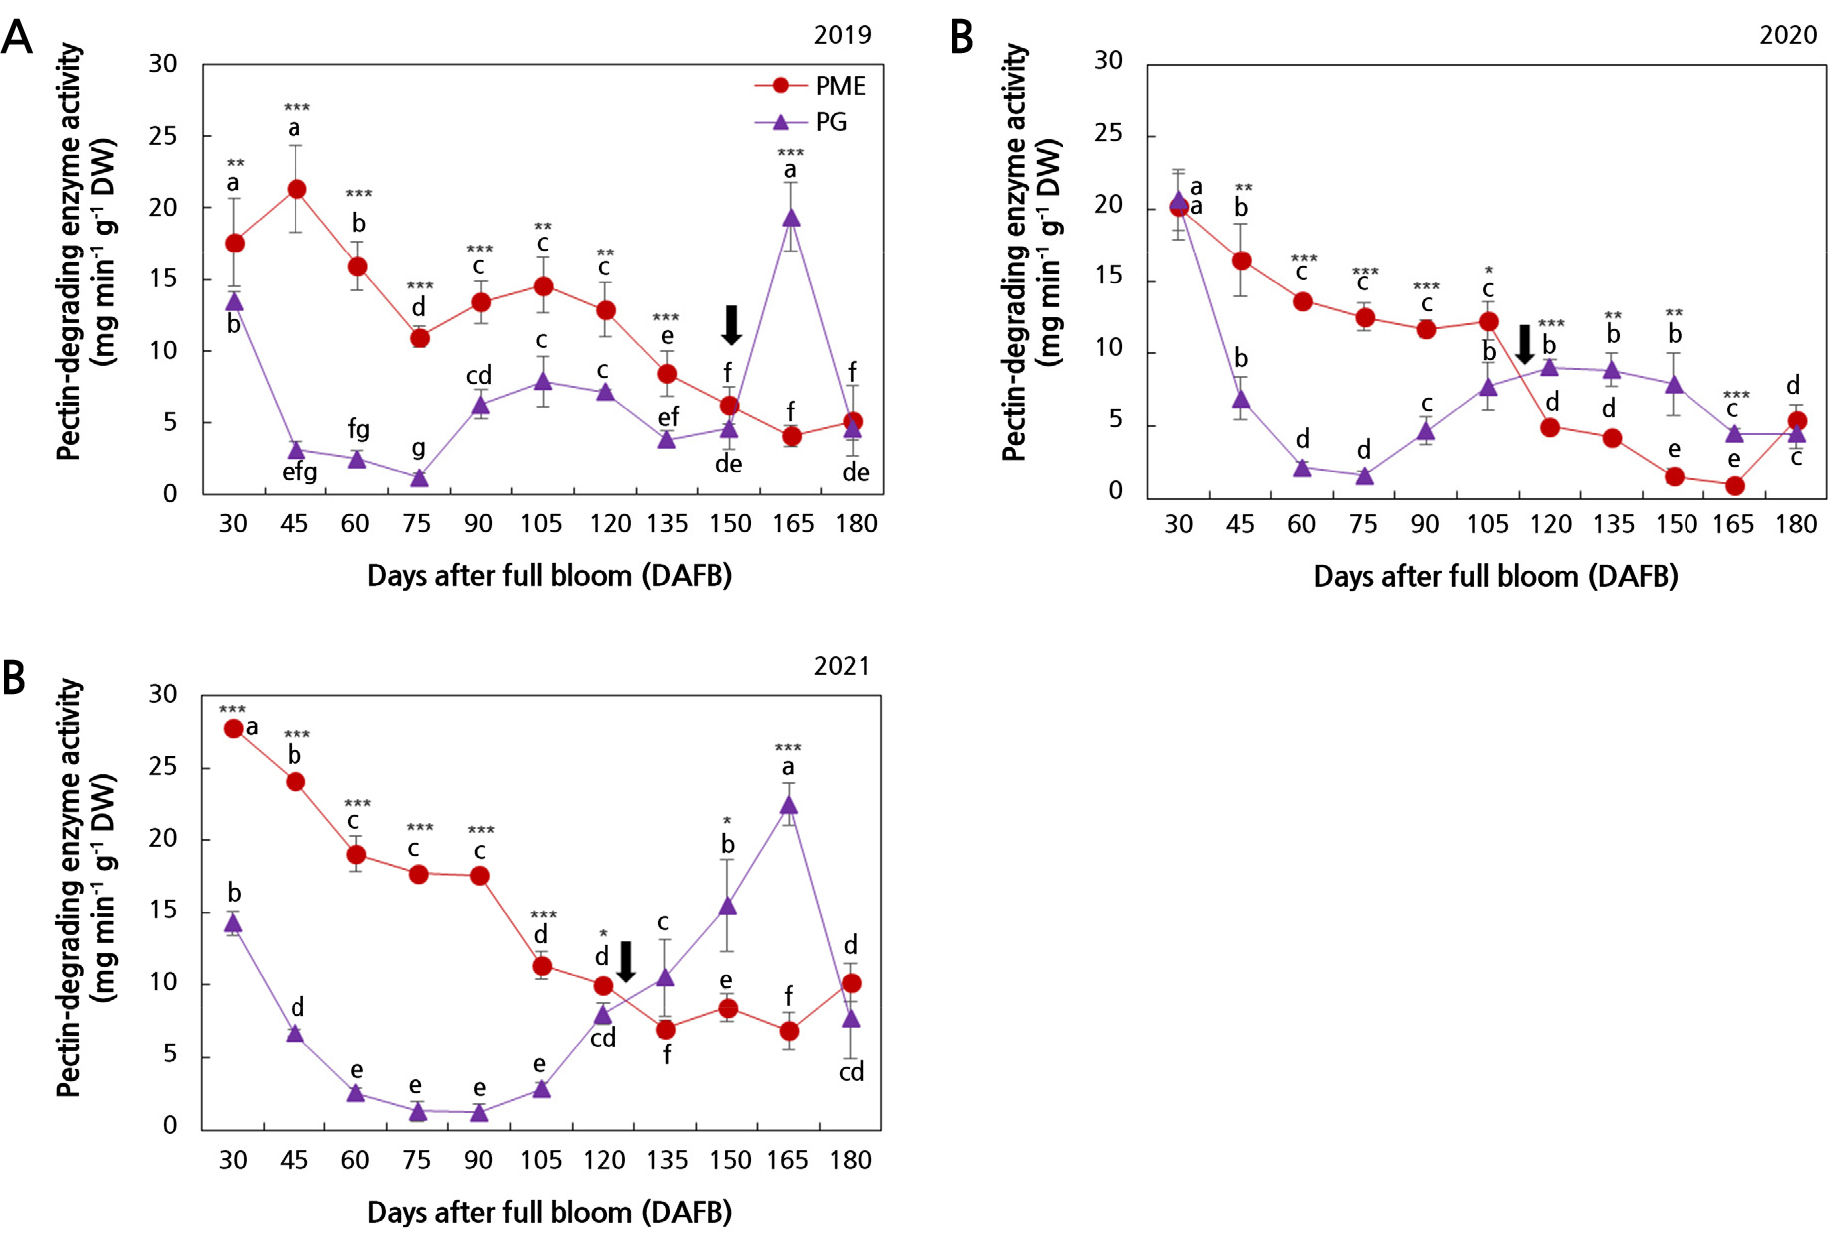
Fig. 3.
Changes in the activities of pectin-methylesterase (PME) and polygalacturonase (PG) during the development of Asian pears in 2019 (A), 2020 (B), and 2021 (C). Data represent the mean ± SD (n = 3). Different letters indicate significant differences across sampling times for each year (p < 0.05). Asterisks indicate significant differences among years at each sampling time (* p < 0.05, ** p < 0.01, *** p < 0.001). The arrows indicate the intersection between the PME and PG activities.
Correlation between meteorological variables and fruit growth
A heatmap was used to visualize the correlations among the average, maximum, and minimum temperatures; the diurnal temperature range; the precipitation levels; AGR; the pectin contents; the PME activities; and the PG activities over the three years to investigate how meteorological variables during fruit development affect Asian pear growth rates (Figs. 4 and 5). The fastest growth in 2020 also included a solid positive correlation between AGR and both temperature and precipitation. In addition, pectin-degrading enzymes were correlated with the diurnal temperature range. The diurnal temperature range in 2019 and 2021 exhibited a positive correlation with the PME activity and a negative correlation with the PG activity. In contrast, those in 2020 showed a weak positive correlation between the diurnal temperature range and two pectin-degrading enzyme factors (PG and PME activities).
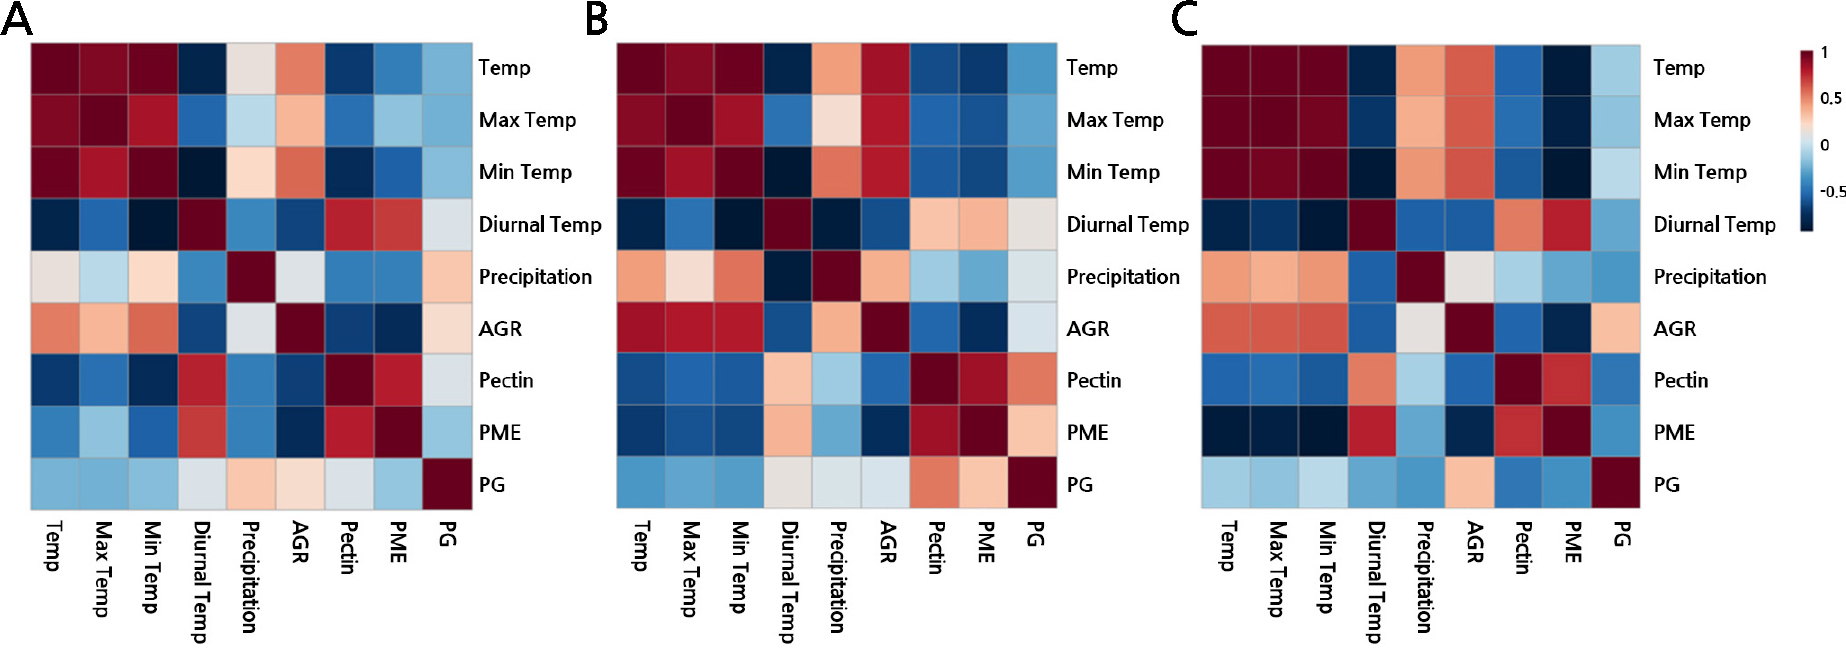
Fig. 4.
Multiple correlation analysis. Heatmaps showing the correlations in the changes in the absolute fruit growth rates and Pectin-degrading enzymes with the temperature and precipitation level in 2019 (A), 2020 (B) and 2021 (C). Positive correlations are displayed in red and negative correlations are in blue. AGR, the absolute fruit growth rate; Temp, atmospheric temperature; Min Temp, minimum atmospheric temperature; Max Temp, maximum atmospheric temperature; Diurnal Temp, diurnal temperature range.
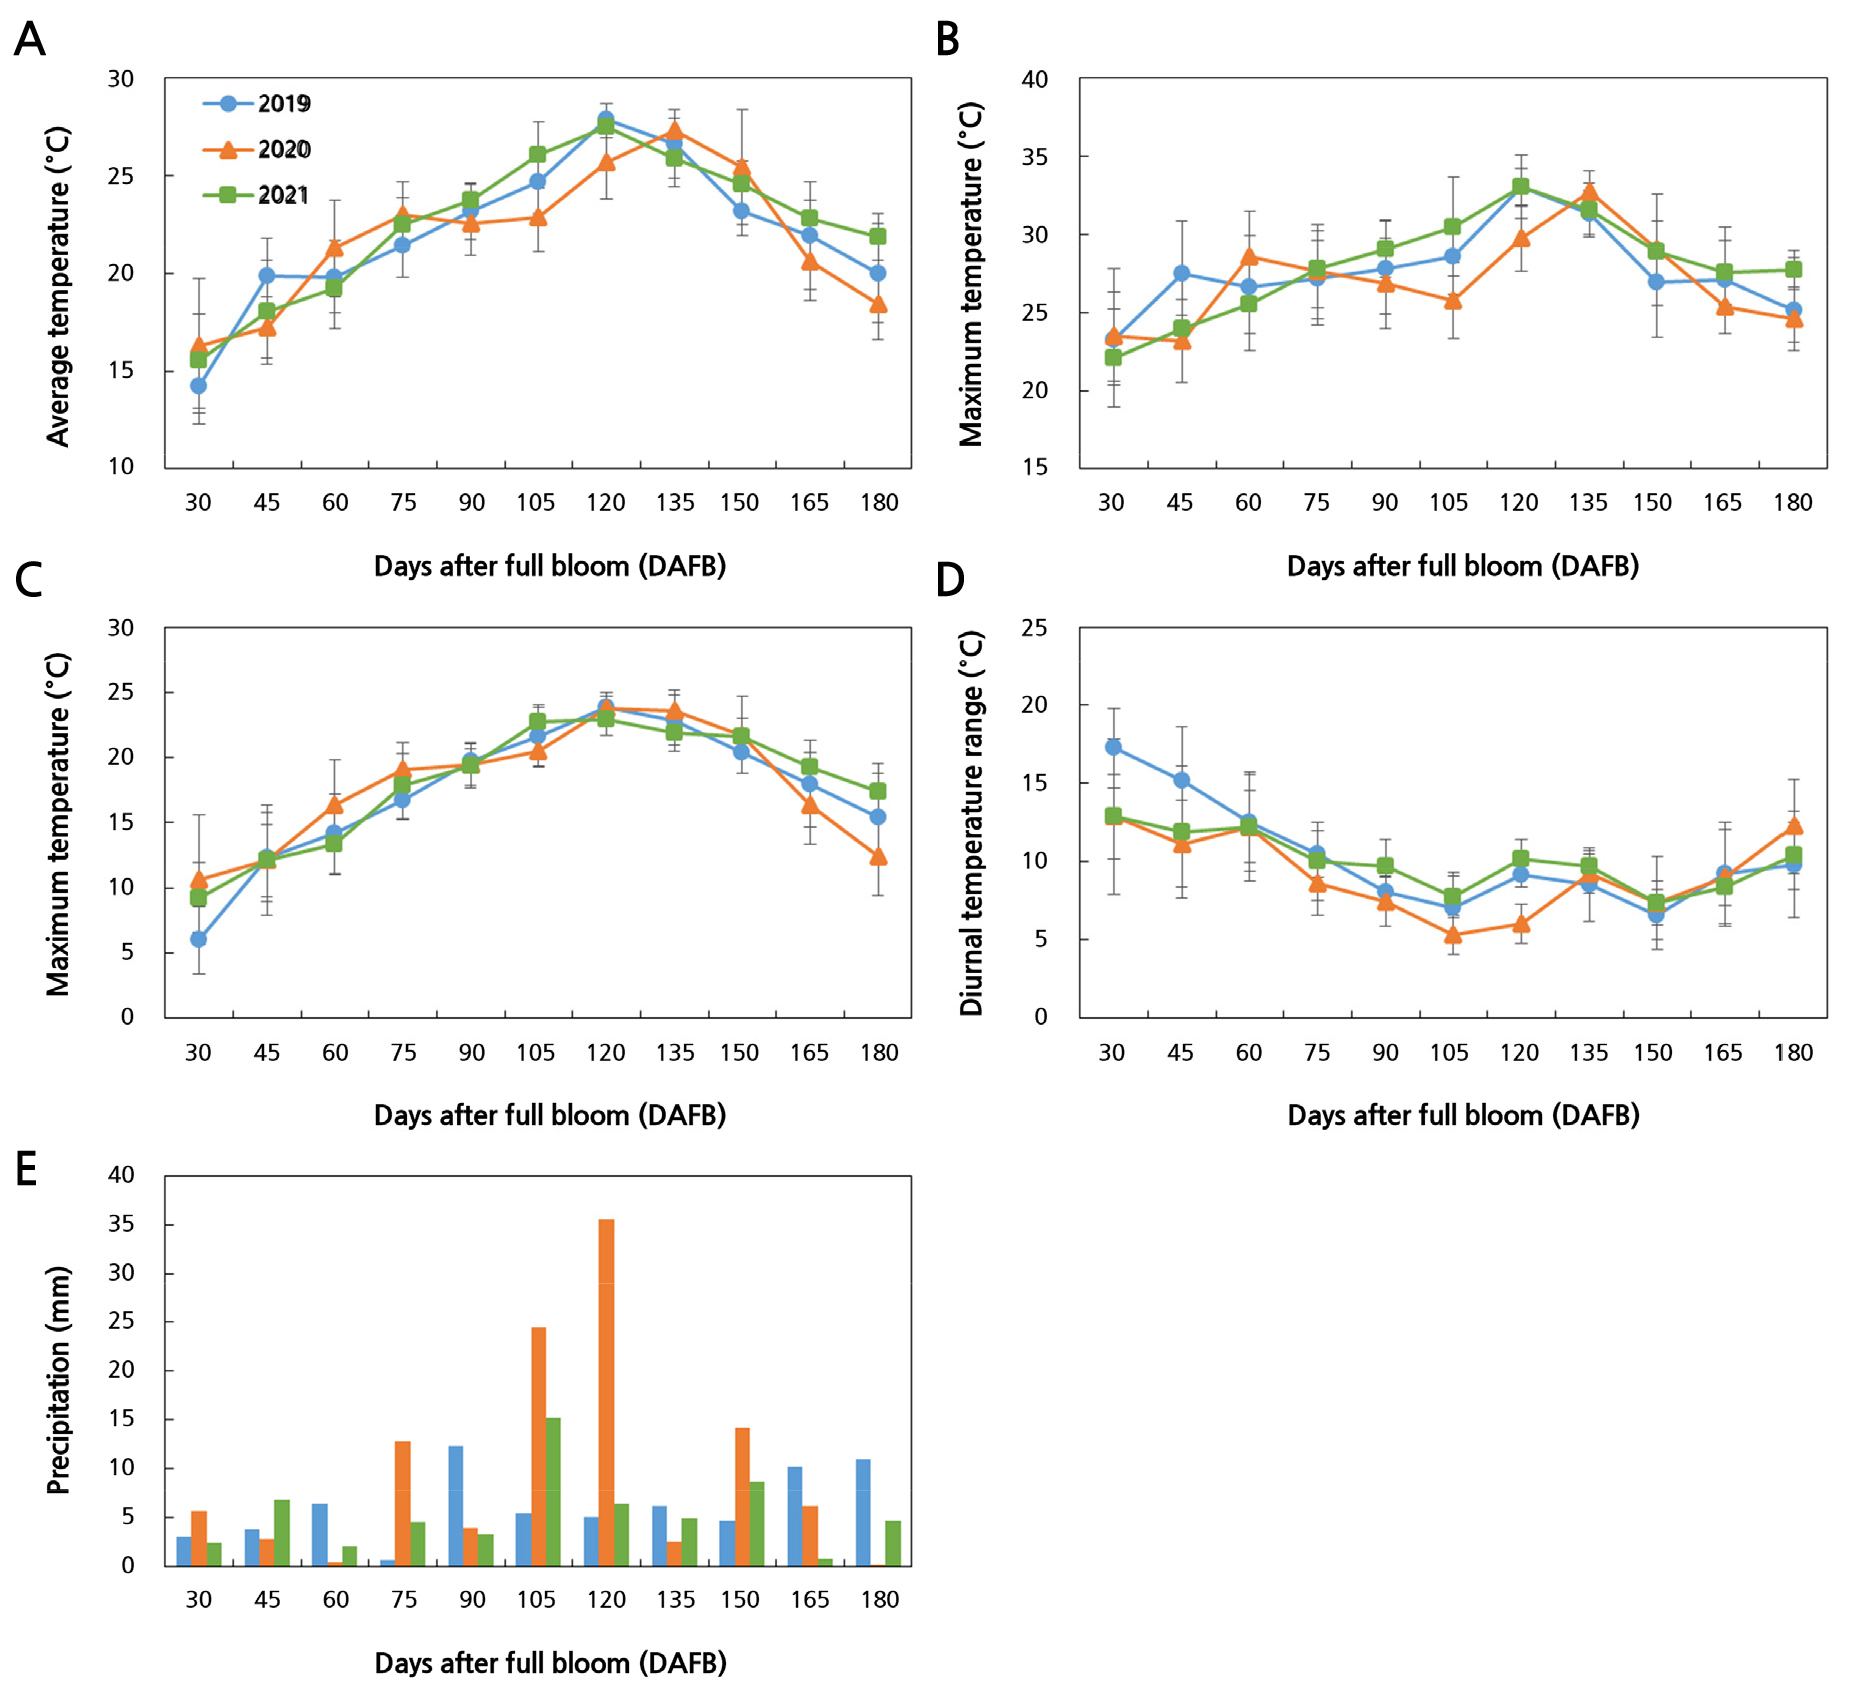
Fig. 5.
Meteorological variables during fruit growth and development for three years: (A) Average temperature, (B) maximum temperature, (C) minimum temperature, (D) diurnal temperature range, and (E) precipitation. All values are expressed as the mean ± standard deviation, except for precipitation, which represents the average amount for consecutive 15-day intervals.
Discussion
The fruit fresh weight increases from 30 DAFB to 180 DAFB demonstrated a single sigmoidal pattern of pome-fruit development characteristics (Dai et al., 2014; Pei et al., 2020). The trends of the fruit diameter and length showed mostly consistent results with the fruit fresh weights (Wang et al., 2022). A previous study by Dai et al. (2014) revealed that the ‘Gold Nijisseiki’ pear (early-maturity) variety showed rapid growth during the period from 60 to 90 DAFB. Furthermore, the early-maturity pear cultivars ‘Blanquilla’ and ‘Conference’ exhibited a slow increase in fruit weight at the beginning of fruit growth, followed by rapid growth after 70 DAFB (Lindo-García et al., 2020). The growth curve of pear fruits indicates a drastic variation in the fruit fresh weight after 70 DAFB, which is most likely associated with the onset of cell expansion (Lötze and Bergh, 2004). However, our results showed a sharp increase in the fruit volume after 105 DAFB, which is most likely due to the different maturity levels of the pear cultivars. A rapid increase in the cell size after 105 DAFB was also evident in microscopic observations. A comparison of annual fruit size changes revealed a significant increase in fruit growth until 165 DAFB in 2019 and 2021 and 135 DAFB in 2020 (Fig. 1). The absolute fruit growth rate reached its maximum most quickly in 2020, followed by those in 2021 and 2019.
Firmness abatement was correlated with reduced fruit cell wall contents (Liu et al., 2021). The general degradation of the plant cell walls begins with the degradation of the middle lamella, followed by the continuous degradation of the primary cell wall (Posé et al., 2019). Reduced cell adhesion induces cell separation, which affects cell division and expansion (Leboeuf et al., 2004). It is widely accepted that the growth rate of plant tissue is governed by the interaction between the tissue pressure-induced cell wall stress and biomechanical behavior (Saei et al., 2014). Throughout the growth period, the pectin contents of the fruits in 2020 were lower than those in the other two years (Fig. 2). The 2020 fruits showed a sharp increase in their fresh weight after 105 DAFB (Fig. 1), probably due to the low pectin content early in the growing season. This may also accelerate cell division and expansion, allowing them to be the first to reach their final fruit size. Guavas had higher pectin contents when the fruit weights were lower (Srivastava and Narasimhan, 1967). A high fruit weight was linked to low pectin contents throughout the fruit growth and development process in watermelon (Gao et al., 2020). According to Cybulska et al. (2011), a high soluble pectin content is thought to be a factor that reduces cell elongation in apples. It was found that the 2019 fruits had the highest pectin contents and were the last to reach their final fruit weight and maximum AGR. Therefore, as the pectin content is closely related to fruit softening, it potentially affects the fruit AGR.
PME and PG are the main factors causing the degradation of cell wall components and fruit softening (Yadav et al., 2009). PME removes the methyl ester group from polygalacturonic acid, making it accessible for degradation by PG. In the literature, PME activity was found to be relatively high early in the growing season, whereas the PG activity, which is involved in fruit softening, showed a high level in the late growing season (Hadfield and Bennett, 1998; Segonne et al., 2014). The pattern of the gradual increase in the PG activity with a decrease in the PME activity during fruit growth is probably related to their substrate preferences (Zhang et al., 2022). In tomatoes, an increase in the PG activity has been proposed to play a role in the regulation of fruit softening (Grierson and Tucker, 1983). However, a slow rate of fruit softening was observed in mangoes, despite their high PG activity, suggesting the key role of PME in controlling the rate of fruit softening (Abu-Sarra and Abu-Goukh, 1992). The beginning of softening in papaya is associated with a sharp decrease in the corresponding PME activity (Ahmed et al., 2010), while a large increase in the softening of peaches is coincident with increased PG activity (Brummell et al., 2004). These previous results noted that enzymes that directly affect softening are different between fruit crops, suggesting the PME and PG are involved in this process reciprocally. Our results were similar to those in previous studies, also noting a decrease in PME and an increase in PG activities during fruit growth and development (Fig. 3). The cell size and fruit volume increased rapidly in tomatoes during the cell expansion stage, while the cell size remains unchanged at maturity (Mauxion et al., 2021). We confirmed that there was no variation in the cell size after 150 DAFB in the 2020 fruit here. In addition, we did not observe high PG activity in the 2020 fruits at 165 DAFB, unlike that in the fruits of the other two years. These results suggest that these fruits reached the maturation stage earlier than did the fruits of the other two years.
Temperatures in the spring post-bloom period (related to cell division in young fruitlets), the autumn pre-harvest or harvest period (fruit maturation and ripening), and the summer are known to influence fruit growth and development in different ways (McCormick et al., 2021). For instance, the rate of fruit growth can be regulated by very high day/night summer temperatures or low temperatures in the early growth stage (Sugiura et al., 1991; Adams et al., 2001). The strong positive correlation between AGR and temperature indicates that temperature had an effect on fruit growth, which differed over the three years. The average temperature, minimum temperature, and total annual precipitation all had a significant impact on the fruit weight (Zhang et al., 2018). Our results showed that precipitation and AGR had a positive correlation only in 2020, with no relationship found in 2019 or 2021. This indicates that fruit growth in 2020 was influenced not only by the temperature but also by precipitation levels. The diurnal temperature range was found to be closely related to the variations in the activity of pectin-degrading enzymes during fruit development. The pectin-degrading enzymes in 2020, which exhibited the fastest fruit growth compared to the other two years, were found to be positively correlated with the diurnal temperature range. Furthermore, the temperature can affect changes in pectin-degrading enzyme activities. Vicente et al. (2005) reported that the PG activity was reduced while the PME activity was enhanced due to a heat treatment in strawberries. The activities of several pectin-degrading enzymes (including PME and PG) were inhibited under low-temperature storage conditions (2 ± 1°C) in European pears (Li et al., 2023).
The intersection of the increase in PG activity and decrease in PME activity varied over the three years, with results of 150, 105, and 120 DAFB in 2019, 2020, and 2021, respectively. The maximum slope of AGR was found at 135, 105, and 120 DAFB in 2019, 2020, and 2021, respectively. In particular, in 2020 and 2021, the intersection of the two enzyme activities precisely coincided with the time point at which the maximum slope of AGR appeared. The rapid increase in the fruit width coincided with the PG and PME activity intersections. Karim et al. (2022) also pointed out a sharp increase in the fruit width in the cell expansion phase. Hence, the intersection of the increase in PG activity with a decrease in PME activity is thought to be a triggering factor that accelerates cell expansion. Furthermore, the diurnal temperature range may affect the changes in pectin-degrading enzymes. However, to the best of our knowledge, few studies have focused on how day/night temperature fluctuations affect fruit growth rates. Further studies of the relationship between meteorological variables and enzyme activities are needed to gain a better understanding of the physiological role of pectin-degrading enzymes in regulating fruit growth in Asian pears.
Conclusion
Although there were no significant differences in final fruit size weights, diameters, or lengths during 2019, 2020, and 2021, there were notable AGR variations. Reduced pectin contents appeared with decreases in the PME activity and increases in the PG activity. Interestingly, intersections of PME activity decreases and PG activity increases were observed in all three years. The intersection point coincided with the maximum AGR slope, with both demonstrating a correlation with the temperature (especially the diurnal temperature range), outcomes that may be related to the fruit growth rate and the final fruit size. These results indicate that the intersection between the PME and PG activities may affect the activation of cell expansion, thereby affecting fruit growth in Asian pears.


