

Introduction
Materials and Methods
Plant Samples
Chromosome Spread Preparation
Probe Preparation
Fluorescence in situ Hybridization
Results and Discussion
Introduction
Platycodon grandiflorum (Jacq.) A. DC., which is commonly known as bell flower or balloon flower, is an herbaceous perennial plant in the monotypic genus Platycodon in the Campanulaceae family (Jang et al., 2013). This species is native to China, Japan, Korea, and East Siberia (Wu et al., 2012). In addition to its ornamental flowers, P. grandiflorum is used as a traditional medicine to treat bronchitis, asthma,hyperlipidemia, hypertension, diabetes, and atopic dermatitis (Lee et al., 2008; Jeong et al., 2010; Urbańska et al., 2014). Recent studies have shown that its roots are a valuable source of saponins such as platycodins and spinasterol (Choi et al., 2008; Kim et al., 2015). These bioactive compounds are responsible for its many health benefits, including its anti-inflammatory, anticarcinogenic, immune-enhancing, hepatoprotective, and spermicidal effects (Lee et al., 2001; Lu et al., 2013; Qin et al., 2014). Several P. grandiflorum cultivars have been developed (Park et al., 2005; Shi et al., 2011; Um et al., 2016). In a recent study, molecular markers using SNPs were developed to explore its genetic diversity (Kim et al., 2015). Nevertheless, P. grandiflorum is still considered to be an orphan crop because genetic studies of this plant have been limited. In addition, very little cytogenetic information is available to support genetic and genomic studies of this plant (Wu et al., 2012; Kim et al., 2015).
Molecular cytogenetics via fluorescence in situ hybridization (FISH) plays an important role in clarifying plant genome structures, thus supporting genome-sequencing research (Macas et al., 2007; Michael and Jackson, 2013; Choi et al., 2014). Such studies can provide chromosome counts, identify the physical locations of repeat elements and genes, and reveal genome rearrangements, such as chromosomal segment inversions and translocations (Khrustaleva and Kik, 2001; Devi et al., 2005; Kato et al., 2006; Macas et al., 2007; Huang et al., 2009; Sybenga, 2012).
Tandem repeats [e.g. ribosomal DNA (rDNA), centromeric and telomeric repeats] are valuable cytogenetic markers that provide information about genome organization and allow for the identification of homologous chromosome pairs (Heslop- Harrison 2000; Tigano et al., 2004). Both 5S and 45S rDNAs have highly conserved coding regions, as they are essential for ribosome function (Harrison and Heslop-Harrison, 1995; Buckler et al., 1997; Cabral et al., 2006). Additionally, inter-genera and inter-specific differences exist in terms of rDNA loci number and distribution (Castilho and Heslop-Harrison, 1995; Li and Arumuganathan, 2001), a characteristic that has been exploited to identify individuals at the species level or even at the subspecies or variety level (Hasterok et al., 2006). Telomeric repeats, which are usually found on chromosome ends, have also proven to be an effective molecular marker for mapping telomere locations across a wide range of species (Cox et al., 1993).
The basic chromosome number in Campanulaceae was reported to be x = 7, 8, or 9 (Sugiura, 1942; Raven, 1975; Hong, 1994; Zhang et al., 2011). Karyotype data have been reported for a diploid (2n = 2x = 18) and an induced tetraploid (2n = 4x = 36) line of P. grandiflorum (Linchu, 1986; Wu et al., 2012; Ma et al., 2015). The use of only conventional karyotyping techniques and the lack of sophisticated cytogenetic markers have resulted in the reporting of different karyotype formulae for P. grandiflorum (Wang et al., 2005; Yang et al., 2015). On the other hand, FISH-based karyotype analysis enables the identification of cytotypes, such as those from the same Brassica rapa species (Xiong and Pires, 2011). Thus, FISH-based karyotype analysis between several P. grandiflorum cultivars would provide chromosome-level polymorphism information.
In this study, we performed FISH karyotype analyses using 5S and 45S rDNAs and telomeric repeat probes in seven cultivars of P. grandiflorum. Our results provide a foundation for future cytogenetic mapping of major repeat elements, as well as for integrating genetic maps to elucidate genome structure and dynamics in P. grandiflorum.
Materials and Methods
Plant Samples
Seven P. grandiflorum cultivars, including ‘Astra Semi-Double Blue’, ‘Astra White’, ‘Fuji Blue’, ‘Fuji Pink’, ‘Fuji White’, ‘Hakone Double Blue’ and change to: ‘Maries II’, which were obtained from Swallowtail Garden Seeds (Santa Rosa, CA, USA),were kindly provided by the Department of Herbal Crop Research, National Institute of Horticultural and Herbal Science, RDA, Eumseong, Republic of Korea and used for karyotype analysis
Chromosome Spread Preparation
Briefly, root tips treated with 2 mM 8-hydroxyquinoline and fixed in Carnoy’s solution were enzymatically digested with pectolytic enzyme solution [2% Cellulase R-10 (C224, Phytotechnology Laboratories) and 1% Pectolyase Y-23 (P8004.0001, Duchefa) in 100 mM citrate buffer] for 1 h. The root tips were transferred into a microtube containing aceto-ethanol (1:3, v/v) solution and vortexed for 30 seconds. The supernatant was discarded, and the pellet was resuspended in (9:1 v/v) aceto-ethanol and spread onto slides that had been pre-cleaned with 70% ethanol and pre-warmed in a humid chamber (Waminal et al., 2011). Air-dried slides were fixed in 2% formaldehyde (Vranaet al., 2012) for 5 min and dehydrated in a graded ethanol series (70%, 90%, and 100%).
Probe Preparation
The PCR product from 18S rDNA amplification (Matoba et al., 2007) was labeled with DEAC-5-dUTP via nick translation. The 5S rDNA from Brassica oleracea was PCR-amplified (Koo et al., 2002) and labeled with Alexa Fluor® 488-5-dUTP (C11397, Invitrogen) via nick translation. The Arabidopsis-type telomere sequence was PCR-amplified in the absence of the template using primers (TTTAGG)5 and (CCCTAAA)5 (Abd El-Twab and Kondo, 2006) and labeled with Texas Red-5-dUTP (NEL417001EA, Perkin Elmer).
Fluorescence in situ Hybridization
The hybridization mixture consisted of 100% formamide, 50% dextran sulfate, 20X SSC, 50 ng·μL-1 of each DNA probe, and Sigma purified water. The mixture was denatured at 90°C for 10 min, and 40 μL was pipetted onto each slide. The slides were incubated at 80°C for 5 min, followed by overnight incubation in a pre-warmed humid chamber at 37°C. The incubated slides were washed in 2 × SSC at room temperature (RT) for 10 min, 0.1 × SSC at 42°C for 25 min, and 2 × SSC at room temperature for 5 min, followed by dehydration in a graded ethanol series (70%, 90%, 95%) at room temperature. The slides were counterstained with Vectashield (Vector Labs, H-1000, USA) containing 1 μg·mL-11 4’,6-diamidino-2-phenylindole (DAPI) and examined under an Olympus BX53 fluorescence microscope with a built-in CCD camera (CoolSNAP™ cf) using an oil lens (×100 magnification). The images were edited using Adobe Photoshop CS6. Chromosome types were classified according to Levan et al. (1964). The chromosomes were paired based on their FISH signals, morphological characteristics, and lengths.
Results and Discussion
We performed FISH karyotype analysis of seven P. grandiflorum cultivars using 5S rDNA, 45S rDNA and telomeric repeat probes. All cultivars examines had 2n = 2x = 18 chromosomes (Fig. 1), which is in agreement with previous karyotype reports (Suzuka and Koriba, 1949; Wu et al., 2012; Yang et al., 2015).
The chromosomes were arranged in decreasing length (Table 1), and homologous chromosomes were paired according to chromosomal features and FISH signals from the 5S and 45S rDNA and telomeric repeat probes. Linchu (1986) and Yang et al.(2015) reported that the karyotypic formula of P. grandiflorum is 2 n = 2 x = 18 = 12 m + 6 sm (2SAT) and 2 n = 2 x = 18 = 10 m + 8 sm (2SAT), respectively. Our results were a bit different from these, i.e. 2 n = 2 x = 18 = 14 m + 2 sm + 2 st (2SAT), a type 2A pattern according to the classification of Yang et al. (2015). These karyotypic differences might be due to the different chromosome condensation stages examined or the lack of more sophisticated centromere-specific probes, which could make it difficult to perform accurate measurement considering the small chromosome sizes (Liehr et al., 2004). The development of more sophisticated probes, such as centromere- or chromosome-specific probes, would greatly enhance karyotype analysis in the future.
Fig. 1.
FISH mitotic metaphase spreads from seven Platycodon grandiflorum (Jacq.) A. DC cultivars. Chromosome spread from ‘Astra Semi-Double Blue’ (A), ‘Astra Whites’ (B), ‘Fuji Blue’ (C), ‘Fuji Pink’ (D), ‘Fuji White’ (E), ‘Hakone Double Blue’ (F), and ‘Maries II’ (G) showing 5S (green) rDNA, 45S rDNA (yellow), and telomeric repeats (red). White arrows indicate the satellite chromosomes. Green arrows indicate co-localized 5S and 45S rDNA signals. Scale bar = 5 μm.
Table 1. Karyotype analyses of the seven cultivars of Platycodon grandiflorum (Jacq.) A. DC.
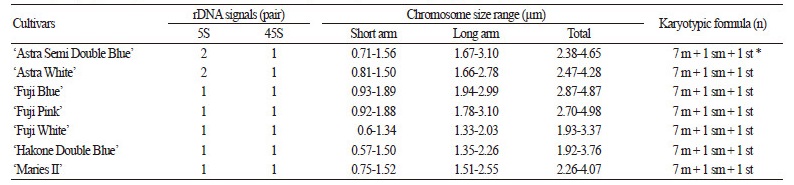 |
m; metacentric, sm; submetacentric, st; subtelocentric, *; satellite chromosome. |
Ribosomal DNA arrays, comprising long repeat units with highly conserved coding regions, are commonly used for chromosome characterization. These arrays are categorized into different families, including nucleolar organizing region (NOR)-forming 45S rDNA and non-NOR-forming 5S rDNA (Rogers and Bendich, 1987; Tigano et al., 2004). The locations of these two families usually vary across genera and species, which can be exploited in taxonomic and phylogenetic studies (Shi et al., 1993; Vaio et al., 2005). Telomeric repeats are also effective molecular markers for use at the species level (Cox et al., 1993), as they have conserved repeat sequences in plants (Levin, 2002).
In the present study, we detected rDNA signals on separate chromosomes in most cultivars. Signals from 5S rDNA were located at interstitial or pericentromeric regions of the chromosomes, while 45S rDNA signals were found on NORs (Figs.1 and 2). Independent localization of rDNA loci is more informative than co-localization of signals when identifying chromosomes (Krinski et al., 2012) and constructing a cytogenetic map, which are important for deducing species relationships (Maghuly et al., 2010). We found that in general, one 5S rDNA locus was localized on the interstitial region of the short arm of chromosome 3 (Fig. 2A–C, F, G), a common pattern in some plant species (Castilho and Heslop-Harrison, 1995). Exceptions were observed in ‘Fuji Pink’ and ‘Fuji White’, where 5S rDNA hybridized on the pericentromeric region of chromosome 3 (Fig. 2D, E). In all cultivars, 45S rDNA signals were present at the NOR of the satellite on chromosome 9. The NOR is a secondary constriction on satellite chromosomes containing 18S-5.8S-26S DNA that is used as a signal for chromosome identification (Mukai et al., 1991; Devi et al., 2005).
In ‘Astra’, 5S and 45S rDNA co-localized on the NOR of chromosome 9 (Fig. 2A, B). This pattern is not often observed, but it occurs in several plant species such as some cucurbits (Muravenko et al., 2004; Abd El-Twab and Kondo, 2012). The 5S rDNA signals on chromosome 3 and its augmentation on the NOR of chromosome 9 suggest the occurrence of sequence recombination (Rogers and Bendich, 1987; Scoles et al., 1988). The distribution of rDNA loci can vary between cultivars within a species (Ørgaard et al., 1995; Xiong and Pires, 2011). This difference in rDNA distribution also implies that genes in this species tend to undergo frequent rearrangements.
The Arabidopsis-type telomeric repeat (TTTAGGG) hybridized onto most terminal regions of the chromosomes in all seven cultivars, as occurs in most plant species (Fuchs et al., 1995). Complete and intense telomeric signals were observed in ‘Maries II’, while signals were weaker or absent in ‘Astra White’(chromosomes 1, 5, 6, and 7), ‘Fuji Pink’(chromosomes 5, 6, and 8), ‘Fuji White’(chromosomes 5 and 7), and ‘Hakone Double Blue’(chromosome 4) (Fig. 2B, D, E, F). These discrepancies are likely due to experimental variations in sequence length or deletions in telomeric repeats resulting from extensive rearrangements (Schubert et al., 1998). Differing degrees of chromosome condensation might be responsible for the co-localization of 5S rDNA and telomeric repeats on chromosome 3 in ‘Hakone Double Blue’ and ‘Maries II’ (Fig. 2F, G).
Fig. 2.
Karyogram of seven Platycodon grandiflorum cultivars. (A) ‘Astra Semi-Double Blue’, (B) ‘Astra White’, (C) ‘Fuji Blue’, (D) ‘Fuji Pink’, (E) ‘Fuji White’, (F) ‘Hakone Double Blue’, and (G) ‘Maries II’. 5S rDNA, 45S rDNA, and telomeric repeats appear as green, yellow and red signals, respectively. White arrows indicate satellite chromosomes with NOR regions, and green arrows indicate co-localization of 5S and 45S rDNA. Scale bar = 5 μm.
Um et al. (2016) classified P. grandiflorum cultivars based on morphological characterization and the use of molecular markers. Based on the genetic relationships deduced by examining SSR markers and morphological traits, the cultivars ‘Fuji’, ‘Hakone Double Blue’, and ‘Maries II’ belong to one group, whereas ‘Astra Semi Blue’ and ‘Astra White’ fall into separate, distinct groups. Based on our results, the 5S and 45S rDNA loci co-localized in the two ‘Astra’ cultivars but not in ‘Fuji- Blue, Pink, White’, ‘Hakone Double Blue’, or ‘Maries II’, corroborating the previous classification based on differences in morphological characteristics and the genetic relatedness of the cultivars (Um et al., 2016).
Repetitive sequences are frequently investigated and used to examine plant genome organization or to establish phylogenies (She et al., 2007). In particular, tandemly repeated DNA sequences are useful cytogenetic markers because such sequences account for a considerable proportion of the plant genome and are localized to specific chromosomal regions (Macas et al., 2011; Waminal et al., 2016). In this study, we performed FISH using the most commonly used 5S and 45S rDNA and telomeric cytogenetic markers. However, more cytogenetic markers, such as major or minor repeats and transposable elements, could be developed as more sequence information becomes available in the future. These markers would be useful for karyotyping and discriminating species or cultivars. Research aimed at refining our understanding of the genome constitution of P. grandiflorum should include additional cytogenetic studies to develop repeat-based probes based on genome-wide repeat analysis of nextgeneration sequencing data or through self-genomic in situ hybridization (self-GISH). A well-established karyotype serves as a backbone for integrating genetic linkage maps with genome sequence assemblies.
