

Introduction
Materials and Methods
Experimental site
Plant material
Statistical analysis
Results and Discussion
Characteristics of water sprouts and bearing branches
Bearing branch characteristics influenced water sprout occurrence
Influence of the bearing branch’s basal diameter on the fruit yield
Pruning decision tree model construction
Conclusions
Introduction
Pruning is the horticultural practice of removing branches from trees and accounts for more than 20% of the total labor involved in fruit production (He and Schupp 2018). As it can increase the productivity and maintain the health of trees, it is vital to their development and yield (Zhang et al. 2018). Branch overgrowth reduces light penetration and increases the risks of pests and diseases (Holb 2005) as well as pruning costs and labor intensity (Miller 1955). Pruning during tree dormancy is crucial for effective management of the bearing branches and water sprouts on fruit trees.
Bearing branch thickness is important with regard to pear tree pruning. Both water sprouts and fruit sprouts grow simultaneously on bearing branches. Water sprouts transfer their carbon assimilates mainly to bearing branches and other water sprouts rather than to the fruit (Mika 2011), gradually causing bearing branches to thicken. As the bearing branch thickens, the upper surface has a comparatively lower percentage of auxin than the underside, facilitating the vigorous growth of water sprouts (Marini 2020). Thick bearing branches are relatively more vigorous and vegetative but yield fewer fruits than thin ones (Schupp et al. 2017). Hence, thick bearing branches must be removed according to pruning criteria that account for tree growth characteristics. In this manner, both the fruit yield and tree vigor are maintained.
Pruning has been traditionally performed manually, with decisions made based on worker skills and experience. However, the supply of skilled pruning workers has steadily declined with the aging of the rural population and with increasing reliance on immigrant labor (KOSIS 2020). Although it is recommended to remove bearing branches from apple trees after seven to eight years (Yang et al. 2019), determining the age of bearing branches in practice can be difficult for novice operators or autonomous pruning systems. In addition, the labor costs of manual pruning continue to increase, and safety concerns such as falls and slips are also raised (He and Schupp 2018). Therefore, alternative solutions for pruning fruit trees, such as mechanical pruning, are becoming essential. Researchers have investigated the use of pruning machines to address this issue. Mechanical pruning techniques such as hedging have been useful for evergreen fruit trees (Martí and González 2010; Albarracín et al. 2017). Unlike these trees, deciduous fruit trees, including apple and pear trees, require the selective pruning of bearing branches, necessitating decision-making algorithms based on morphological data (Zahid et al. 2021).
Yang et al. (2019) defined the appropriate age for apple tree bearing branches according to the leaf photosynthetic performance and fruiting characteristics. They recommended that bearing branches be removed after seven or eight years. Karkee et al. (2014) formulated an algorithm identifying branches requiring pruning on apple trees. The authors established a maximum bearing branch length of 28 cm and a minimum interbranch spacing of 20 cm. Schupp et al. (2017) stated that thick bearing branches should be pruned first. They also advised a 1.5:1.25 cross-sectional area ratio between bearing and main branches. To the best of our knowledge, no previous studies have reported pruning criteria based on the diameter for pear trees that can substitute for bearing branch age. In contrast, several earlier studies have performed this analysis for apple trees.
Therefore, this study aimed to analyze water sprout occurrence and fruit yields according to bearing branch basal diameters and establish pruning criteria for pear trees. The findings could serve as a fundamental framework for pruning robotics, thereby improving pruning accuracy and efficiency through model-based decision-making and benefiting pear orchard farmers practicing tree pruning.
Materials and Methods
Experimental site
The study was conducted in a pear orchard in Naju, Korea (34°58'34.1" N, 126°42'12.7" E; 25–30 m.a.s.l.; 0.83 ha) between 2021 and 2023. The average annual temperature, average annual maximum temperature, and average annual minimum temperature at this site from 2021 to 2023 were 13.9 °C, 20.2 °C, and 8.6 °C, respectively, and the annual average precipitation was 1,299.0 mm. The trees were thirty-year-old Pyrus pyrifolia cv. Niitaka. They were planted in loam soil at a spacing distance of 4.0 m × 7.0 m, trained to an overhead, subjected to conventional annual wintertime pruning, and treated with crop protectant sprays, fertilizers, and irrigation per local guidelines and management practices.
Plant material
Eight trees were selected. Data on their bearing branches and the water sprouts that appeared on them were collected before dormant pruning. Data on all bearing branches remaining after pruning were also recorded. Each tree had approximately four main branches (Fig. 1). The lengths of all bearing branches and water sprouts were measured with a measuring tape. Digital calipers were used to measure the diameters of the closest points to the main branch and the bearing branch midpoints. Yield per bearing branch was determined by harvesting and weighing all fruits at each 180 days after full bloom (DAFB) during the study period. Thinning of the fruit was performed annually during the experimental period to exclude factors affecting the number of fruits that set. To ensure consistent experimental conditions further and to address potential variations due to environmental factors, the total annual yields from the eight trees were monitored from 2021 to 2023. No significant year-to-year differences in the total yield were observed (Table 1), confirming stable fruit set throughout the study.
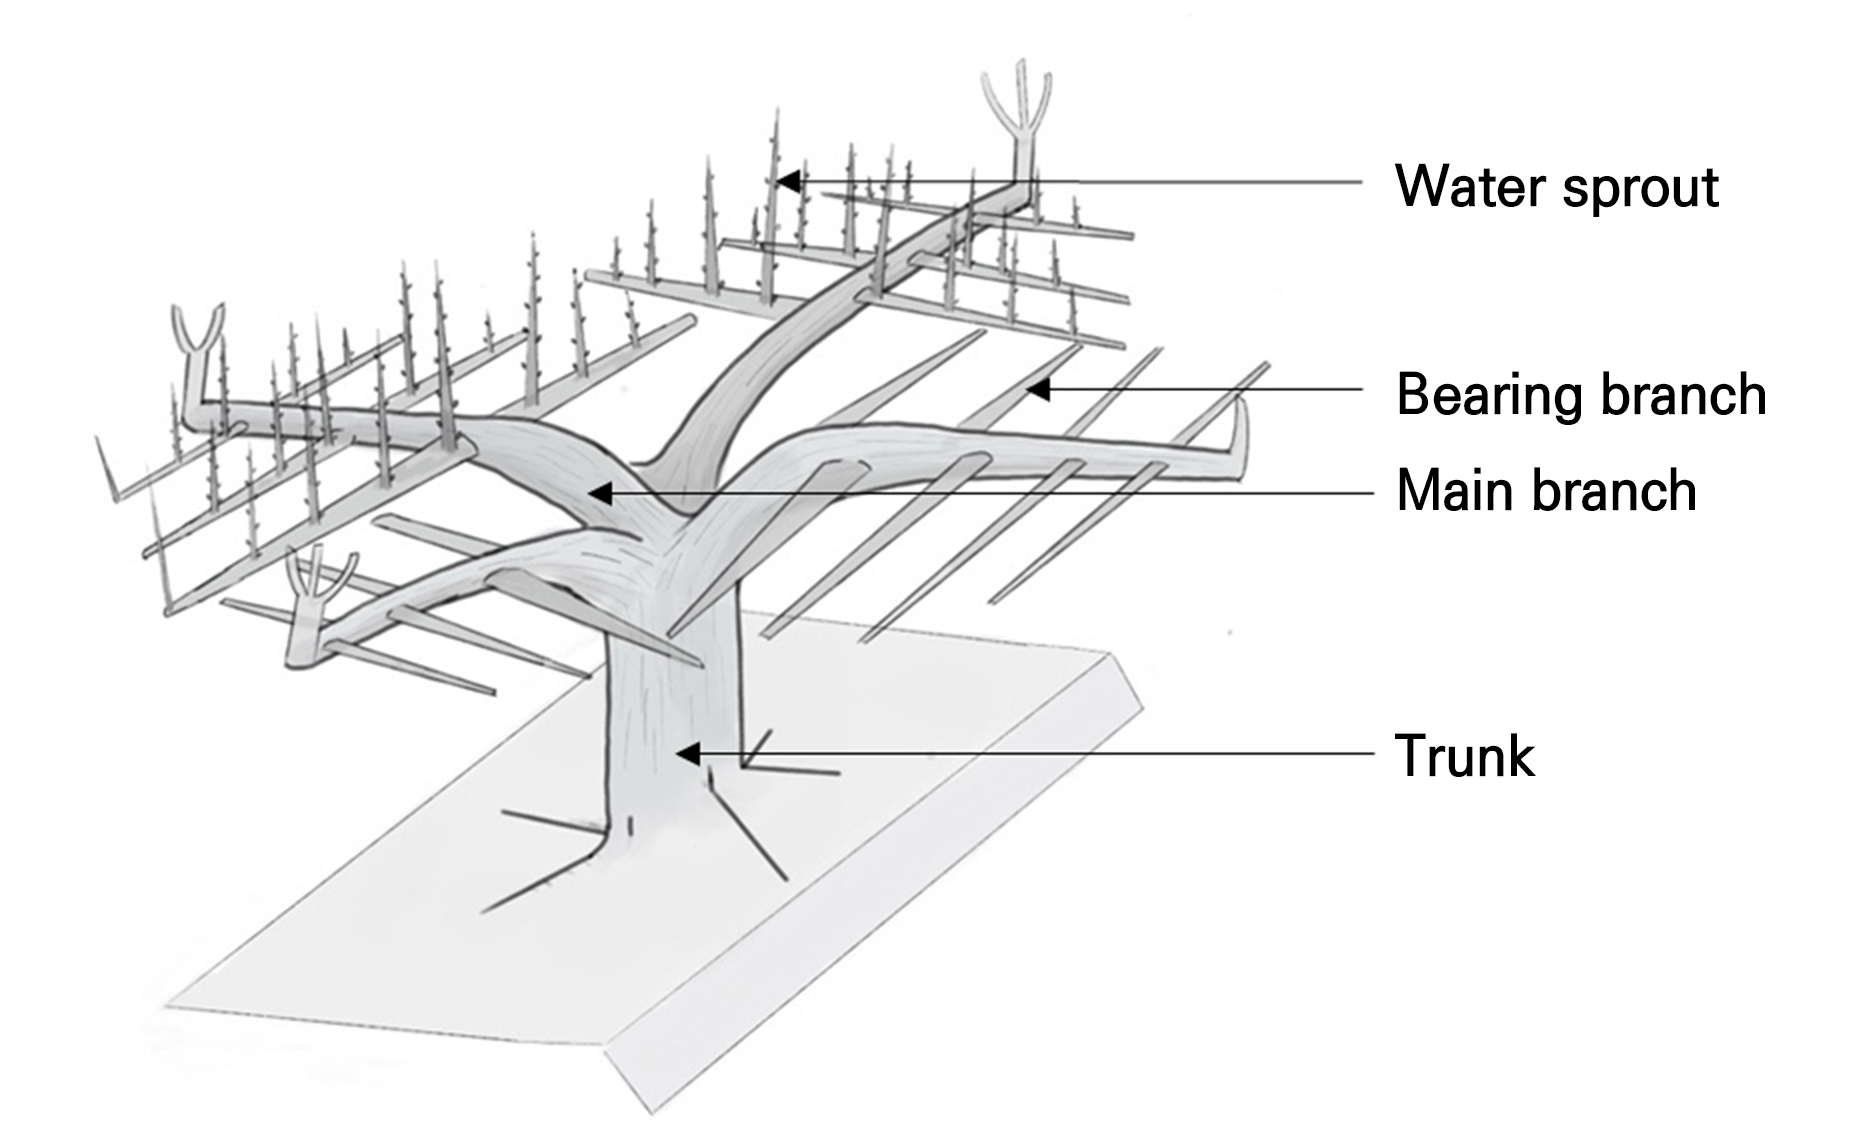
Fig. 1.
Dormant pear tree trained to overhead type. The trunk is the main central tree stem, and it supports the main branches. The main branch originates from the trunk and forms the tree structure. The bearing branches originate from the main branches and produce flowers, fruits, and water sprouts. The water sprouts emerge from the bearing branches and are pruned in dormancy.
Table 1.
Annual total yields of ‘Niitaka’ pear trees trained to the overhead type from 2021 to 2023
| Year | Total fruit (number/tree) | Total yield (kg/tree) |
| 2021 | 310.5 ± 150.3 | 213.2 ± 83.5 |
| 2022 | 283.1 ± 104.5 | 207.1 ± 62.4 |
| 2023 | 186.1 ± 77.5 | 148.6 ± 56.9 |
| Significance (p value)x | ns | ns |
Statistical analysis
All models were plotted in Python 3.12 (https://www.python.org/downloads/release/python-3120/). Best-fit models were determined considering the coefficient of determination (R2), the root mean square error (RMSE), the mean absolute error (MAE), and the 95% confidence intervals (CI). R2 measures the degree of correlation between the experimental and predicted values, and unity (one) indicates good model performance. RMSE expresses the error in units identical to that of the variable itself and provides additional information on model efficacy (Legates and McCabe 1999). MAE determines the average magnitude, but not the direction, of the errors in the forecasts. Model prediction accuracy increases with a decrease in the RMSE and the MAE.
Statistical comparisons of fruit yields were performed in R 4.4.0 (https://cran.r-project.org/bin/windows/base/). To analyze statistical differences between group means, the normality and homoscedasticity of each group were evaluated via the Shapiro-Wilk and Levene’s tests, respectively (p < 0.05). As the normality (Shapiro-Wilk) test failed, pairwise multiple comparisons between group levels were conducted with Dunn’s test (post-hoc Kruskal-Wallis).
A decision tree (DT) displays its selections and results via a model or graphic resembling a tree. It is applied to choose the course to follow and is commonly implemented in classification models (Quinlan 1986). Its installation cost is low and it is easily interpreted and readily interacts with database systems and is highly dependable (Kotsiantis et al. 2007). A DT was used to establish the pruning criteria. For every bearing branch, the following parameters were input into the DT: the number of water sprouts; their overall length; their basal, central, and terminal diameters; as well as whether or not actual pruning was conducted. The dataset consisted of only 1,629/2,705 bearing branches as the 1,076 other samples bore no fruit and were, therefore, unusable. They included bearing branches one year old and/or < 70 cm in length. Here, the maximum depth (max_depth) = 3 and entropy was the partition criterion for the decision tree model. Entropy was between 0 and 1. The former and latter values indicate an ordered and a severely disordered set X, respectively. The accuracies of the preserved (‘preserve’) and pruned (‘prune’) branches were calculated with a confusion matrix to evaluate the model performance. The feature importance of the trained model was also analyzed to determine the contribution of each feature to the predictions. Python 3.12 was used for this statistical analysis.
Results and Discussion
Characteristics of water sprouts and bearing branches
The characteristics of the bearing branches collected over the three consecutive years are listed in Table 2. We analyzed 1,832 bearing branches and 13,877 water sprouts. The bearing branches had minimum and maximum lengths of 106.2 cm and 163.5 cm, respectively, and diameters in the range of 21.4–29.7 mm. The water sprouts had minimum and maximum lengths of 44.3 cm and 92.6 cm, respectively, and diameters in the range of 7.8–12.6 mm. The lengths of most water sprouts increased with the tree age.
Table 2.
Characteristic measurements of dormant pear trees trained to the overhead type
Bearing branch characteristics influenced water sprout occurrence
To quantify the pattern of water sprout occurrence within the same bearing branch, a linear regression analysis of the occurrence of new water sprouts on the bearing branches of the following year was conducted (Fig. 2). The results indicated that the total length of the water sprouts on the bearing branches increased by approximately 1.3-fold annually. The predicted values derived from the regression formula (Fig. 2) were then compared against the actual total lengths of the water sprouts occurring the following year. The regression equation provided 55% explanatory power over the observations. MAE and RMSE were 285.758 cm and 390.013 cm, respectively (Fig. 3). Hence, the number of water sprouts on the bearing branches increased with age and time. Similar to apple trees, where IAA levels decrease with age (Yang et al. 2019), aging in pear tree bearing branches may also lead to lower IAA levels, contributing to branch thickening and water sprout development (Marini 2020).
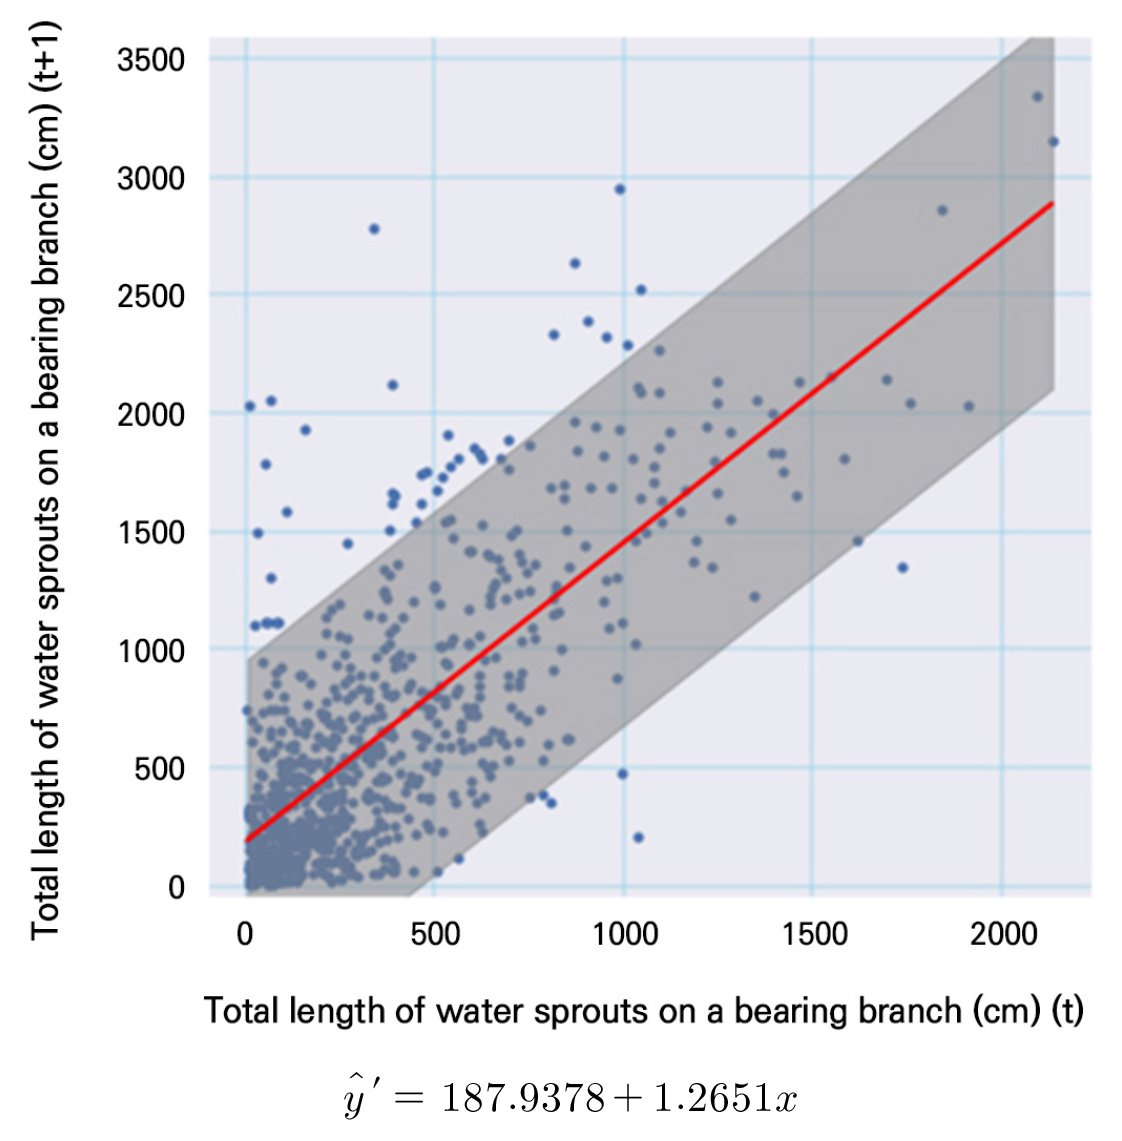
Fig. 2.
Relationship between the total length of water sprouts on bearing branches in the current year (t) and the total length of water sprouts on bearing branches in the following year (t+1). Red lines represent predicted means derived from a linear regression. The gray area represents the 95% confidence interval (CI; n = 838).
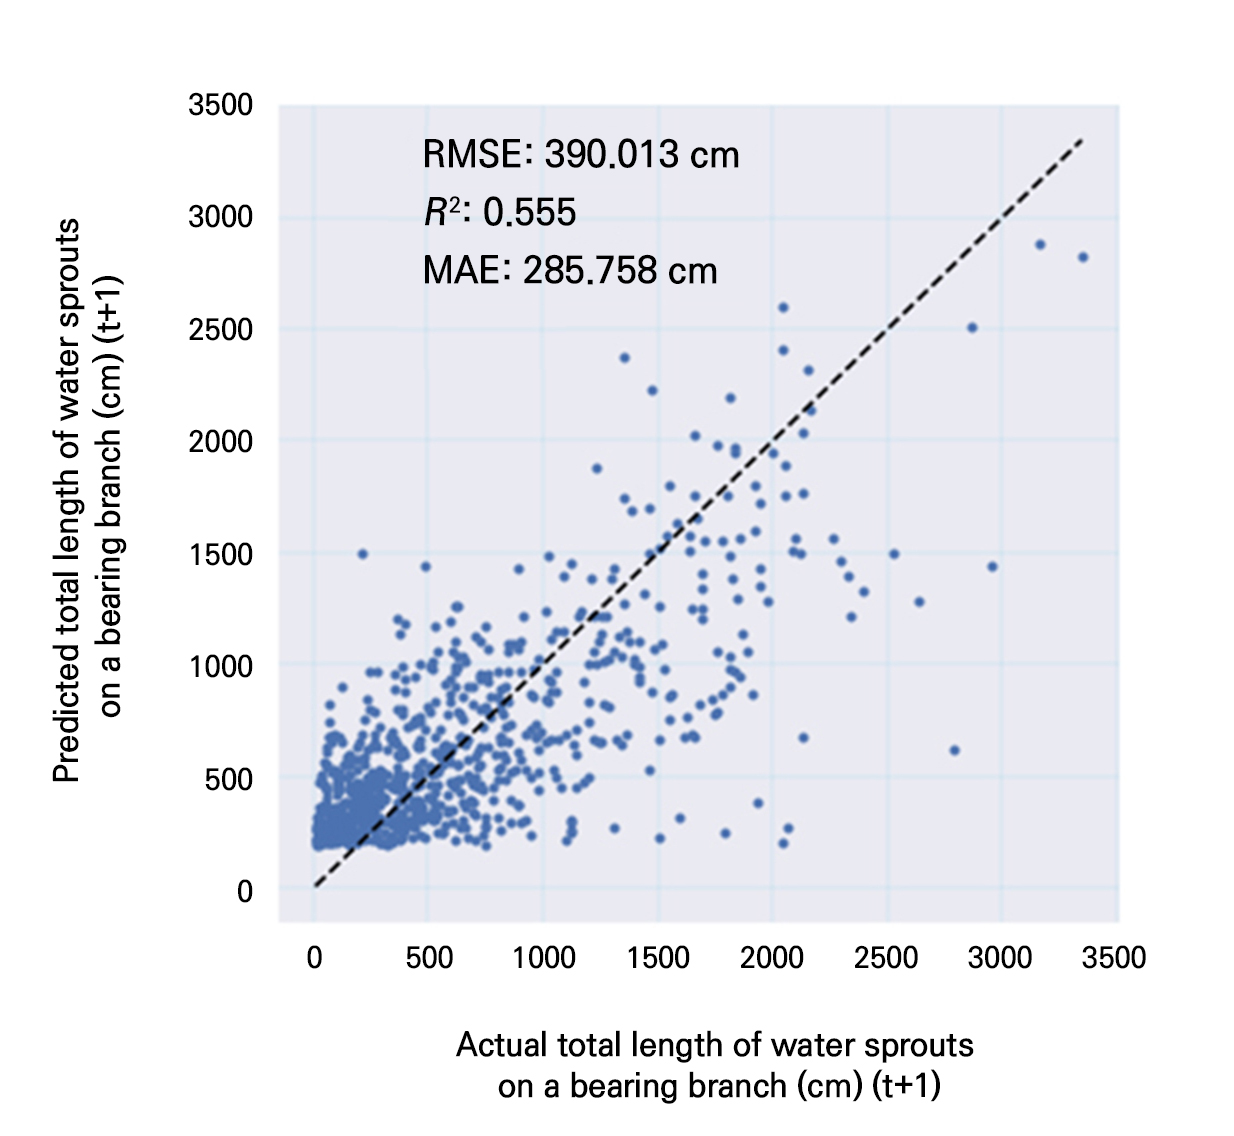
Fig. 3.
Scatter plot comparing actual and predicted total lengths of water sprouts on bearing branches in the following year (t+1). Actual vs. predicted values for each observation are shown. The dashed diagonal line represents a 1:1 relationship (y = x). R2, coefficient of determination; RMSE, root mean square error; MAE, mean absolute error.
A polynomial function disclosed a positive correlation between the bearing branch basal diameter and total water sprout length (Fig. 4). The predicted values derived from the regression formula (Fig. 4) were then compared against the actual total lengths of the water sprouts occurring the following year. The regression equation provided 53% explanatory power over the observations. MAE and RMSE were 300.580 cm and 409.996 cm, respectively (Fig. 5). This is in line with earlier findings by Lauri et al. (2010) reporting that the water sprout growth rate increased with the bearing branch basal diameter.
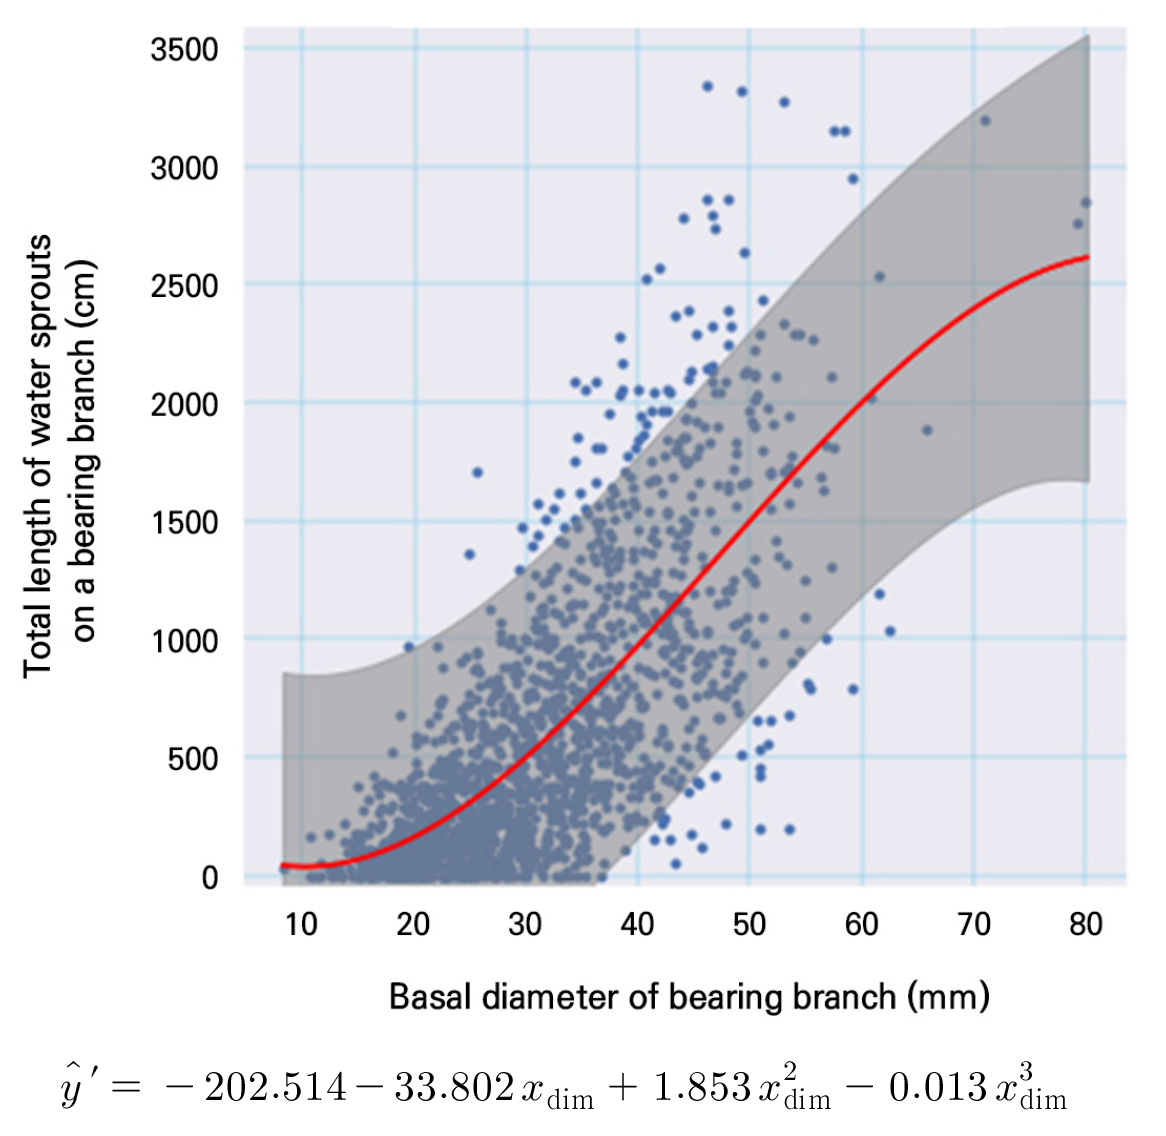
Fig. 4.
Effect of the bearing branch basal diameter on the total length of water sprouts on bearing branches in 2021, 2022, and 2023. Red lines represent predicted means derived from a polynomial regression. The gray area represents the 95% confidence interval (CI; n =1,541). ꭓdim, mean bearing branch basal diameter.
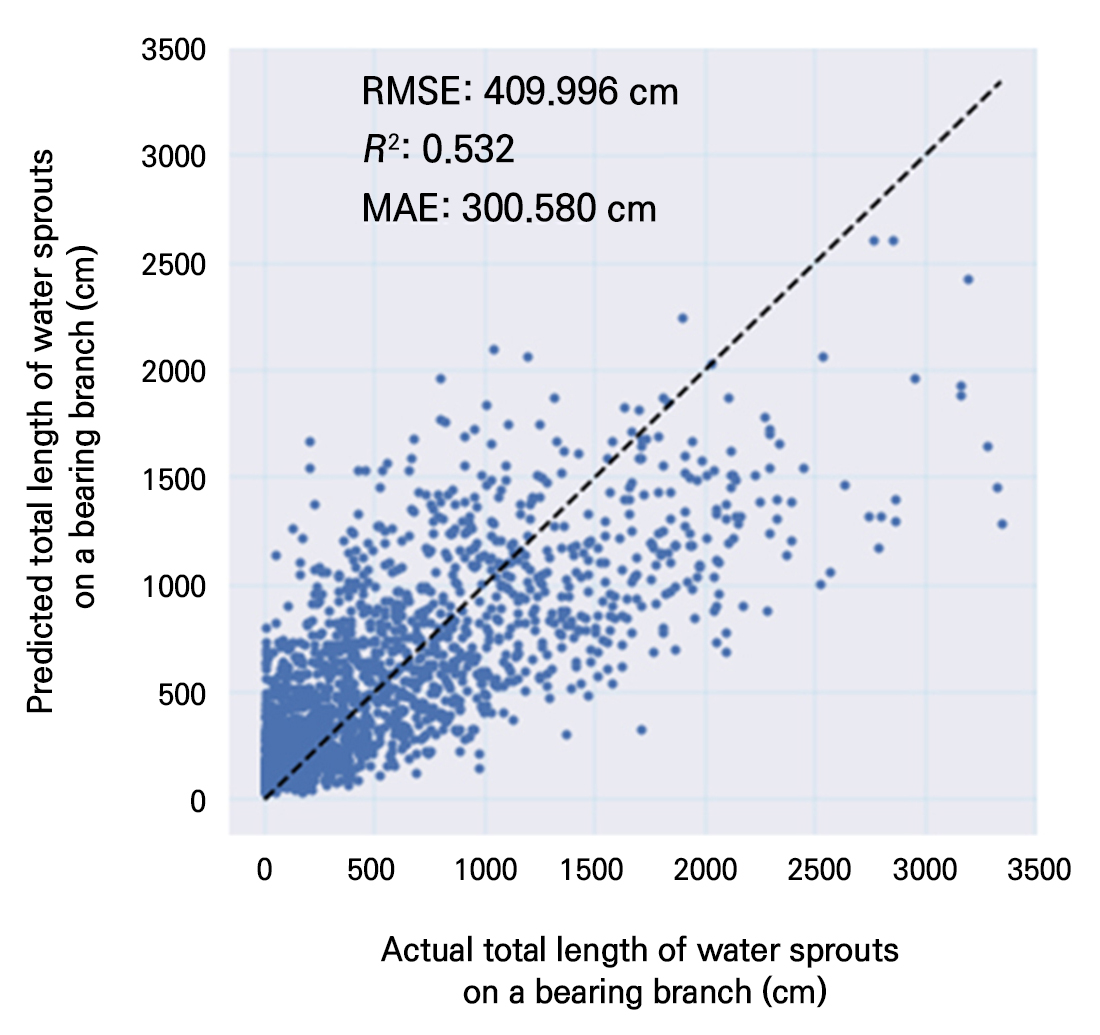
Fig. 5.
Scatter plot comparing actual and predicted total lengths of water sprouts according to the bearing branch diameter. Actual vs. predicted values for each observation are shown. The dashed diagonal line represents a 1:1 relationship (y = x). R2, coefficient of determination; RMSE, root mean square error; MAE, mean absolute error.
Influence of the bearing branch’s basal diameter on the fruit yield
Along with increasing the bearing branch basal diameter, variances were observed in the numbers of fruit on the bearing branches. The number of fruits increased arithmetically when the bearing branch basal diameters were in the range of 10 to 20 mm but not when they were in the range of 30 to 50 mm (Fig. 6). Despite the inverse relationship between the fruit yield and vegetative growth (Forshey and Elfving 1989; Sala et al. 2012; Ryan et al. 2018), it is considered that the bearing branch diameter and fruit yield are positively correlated, as immature fruit-bearing branches that cannot produce sufficient fruit are included in the initial range of the graph (from 10 to 20 mm). According to pipe theory, branch thickness is positively correlated with the amount of nutrient transport. In this study, an increase in the basal diameter of bearing branches was accompanied by a rise in water sprout development, suggesting an increase in nutrient flow. However, the observation that the fruit yield remained constant when the basal diameter exceeded 30 mm implies that the additional nutrients may have been preferentially allocated to water sprouts rather than to fruits (Plavcová et al. 2022).
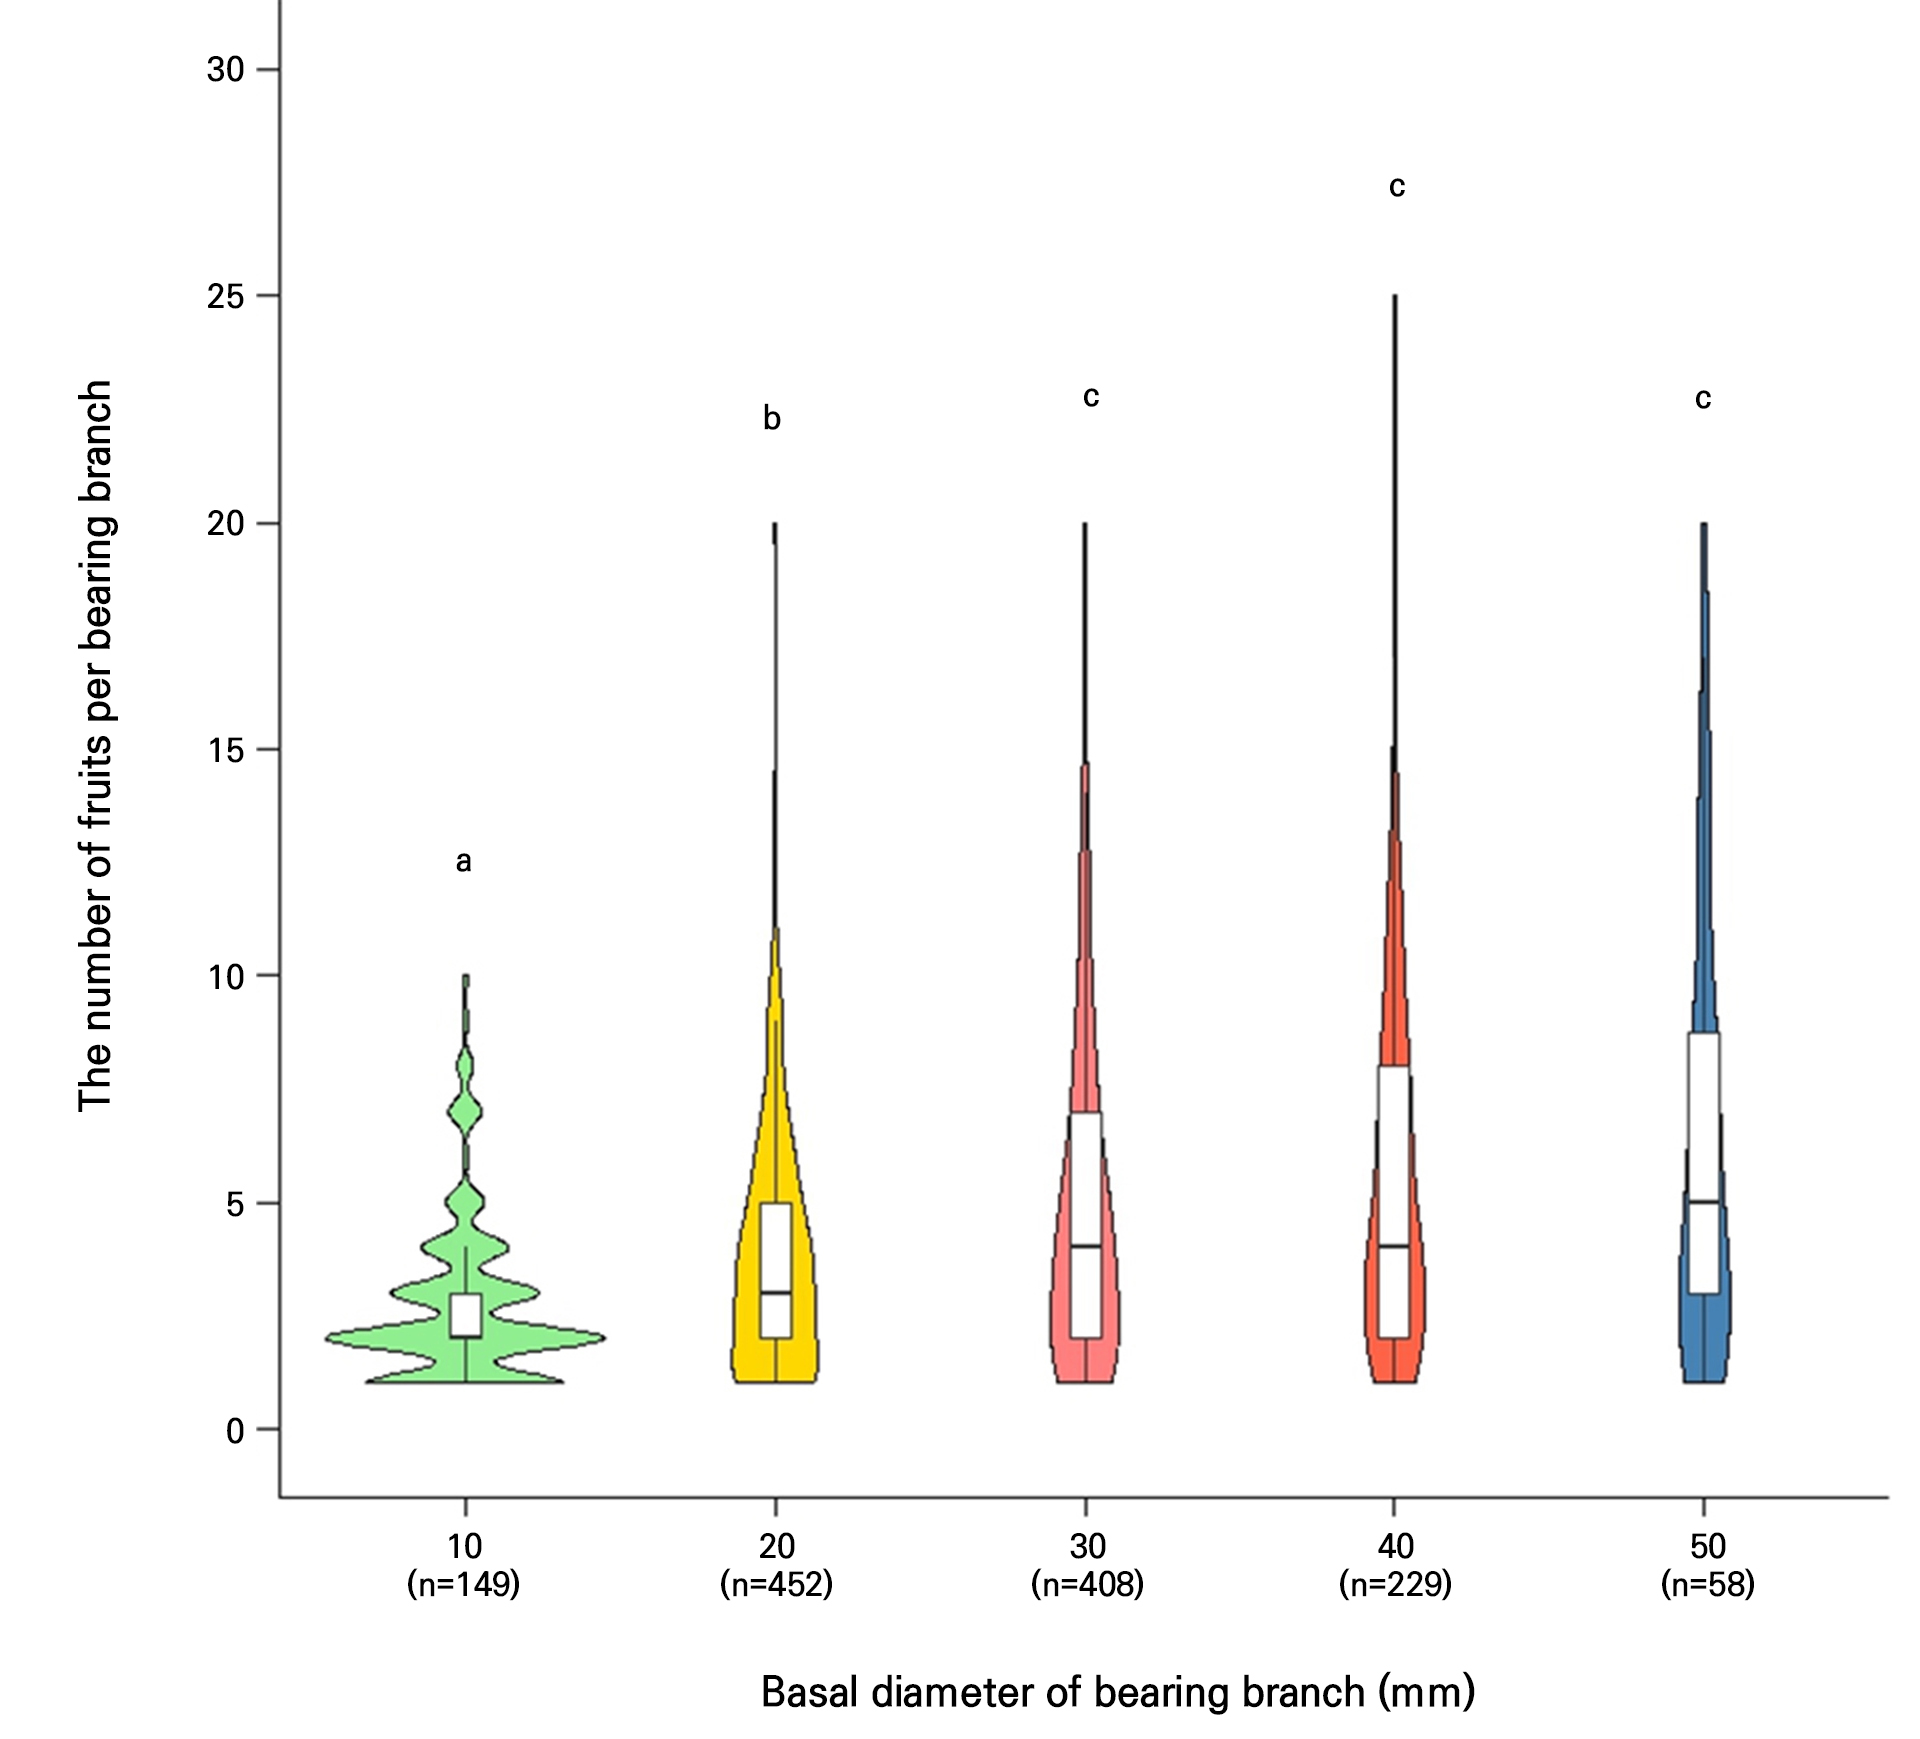
Fig. 6.
Relationship between the bearing branch basal diameter and number of fruits per bearing branch in 2021, 2022, and 2023. Boxplots within the violin plot show the interquartile range (box), median (black line within interquartile range), and data range (vertical lines). Bars with different lowercase letters are significantly different between stages of the number of fruits per bearing branch (p < 0.05) (n = 1,296).
Pruning decision tree model construction
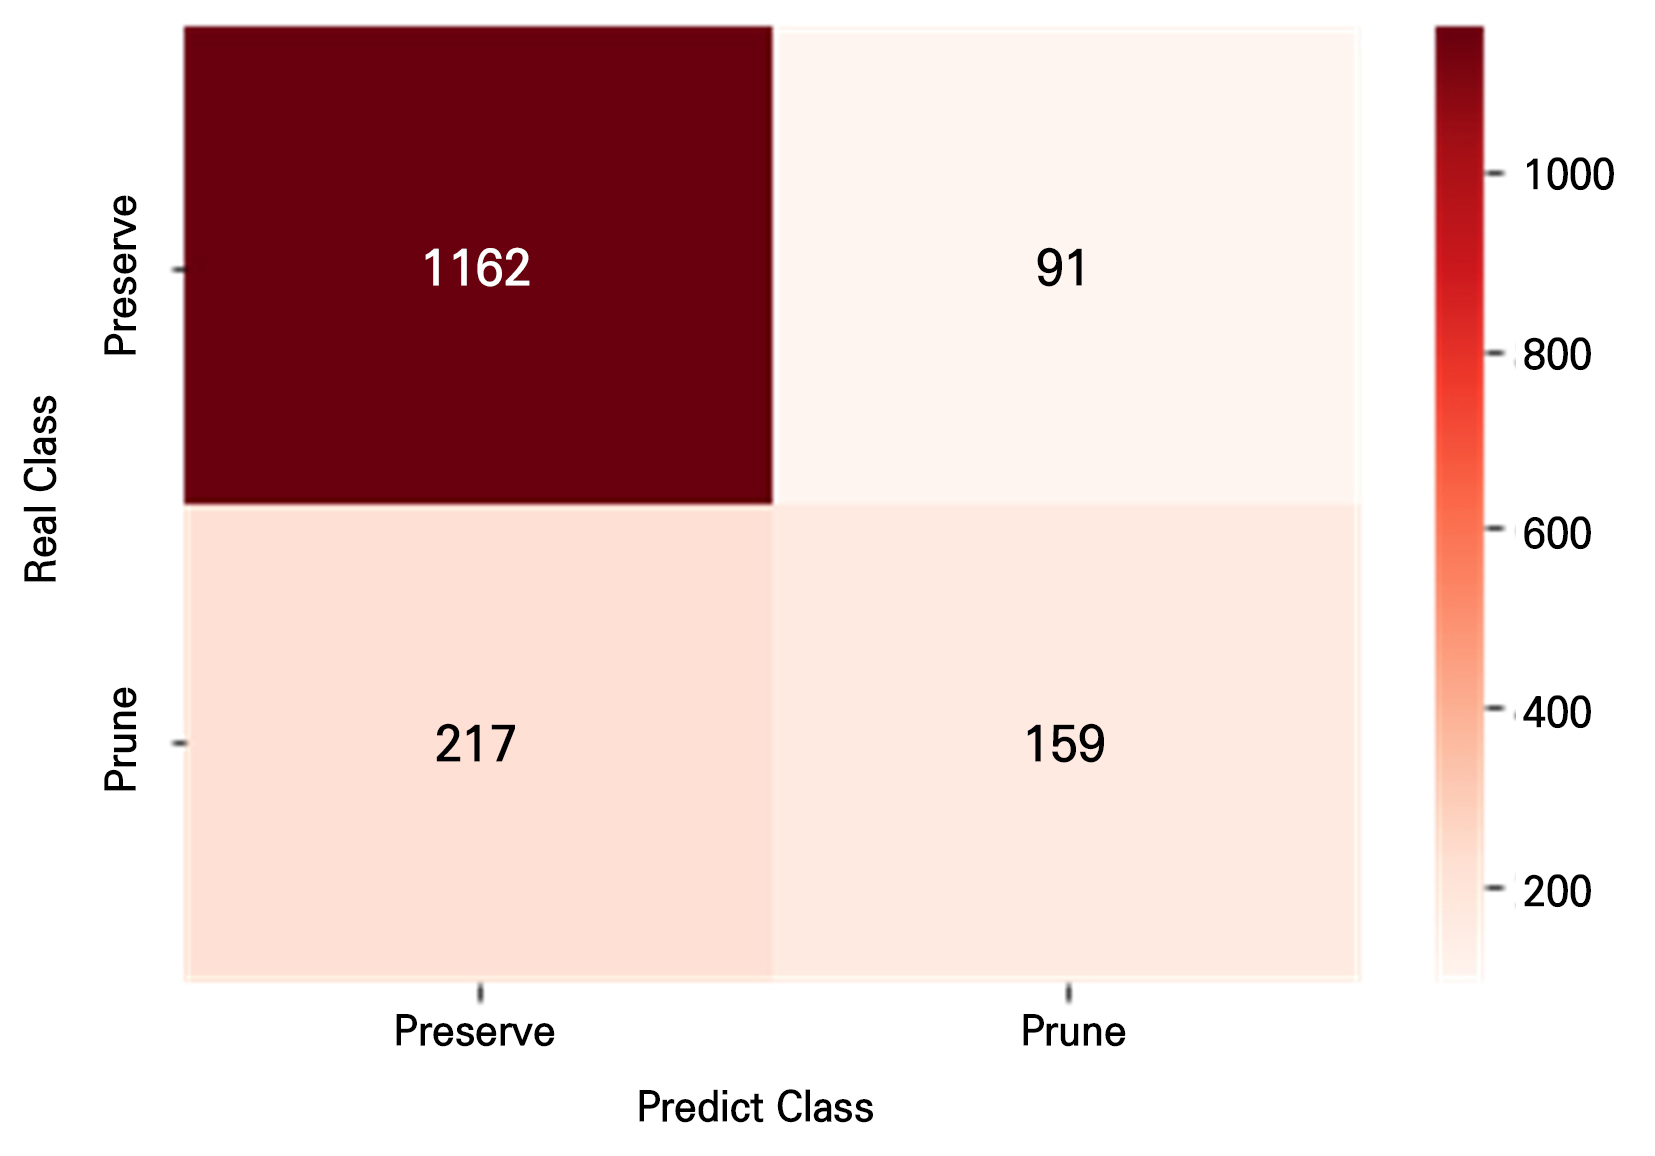
Our findings show that the fruit yield increased with the bearing branch basal diameter and remained constant thereafter. In contrast, water sprout occurrence continued to increase over time. Prior research indicates that the prevalence of pests and diseases escalates with heightened branch density (Holb 2005). Increased pest and disease rates result in reduced leaf photosynthesis, consequently decreasing the fruit size (Simoni et al. 2018). Thus, bearing branches should be pruned and replaced as their basal diameters increase. Here, we used a decision tree (DT) model to establish the criteria by which bearing branches should be pruned. The model input parameters were determined on the basis of important bearing branch characteristics, in this case the length and diameter. The DT model was then constructed and evaluated via a confusion matrix. The evaluation indicator was the accuracy coefficient. The DT confusion matrix is shown in Fig. 7. The accuracies of the overall, ‘preserve’, and ‘prune’ sets were 81.1, 96.5, and 42.3, respectively. The ‘prune’ set was less accurate than the ‘preserve’ set presumably because the former was 3.3-fold smaller than the latter.
When using the DT to identify bearing branches that require pruning, the four key characteristics/critical features were the basal diameter, central diameter, total water sprout length, and length (Table 3). Of these, the basal diameter was the most significant determinant and accounted for 74% of the model feature importance. In contrast, the central diameter, total water sprout length, and length each contributed less than 20% to the overall feature importance. Accordingly, in this analytical framework, the basal diameter was the major variable with regard to pruning decisions.
Table 3.
Feature importance values derived from the pruning decision tree (DT) model. Basal diameter, bearing branch basal diameter; central diameter, bearing branch central diameter; total length of water sprouts, total length of water sprouts on a bearing branch; length, bearing branch length
| Feature name | Score |
| Basal diameter (mm) | 0.74 |
| Central diameter (mm) | 0.16 |
| Total length of water sprouts (cm) | 0.06 |
| Length (cm) | 0.04 |
The DT model (Fig. 8) derived three pruning criteria. The first is the state in which the bearing branch basal diameter and the central diameter were > 42.3 mm and > 26.2 mm, respectively. The second is the state in which the basal and central diameters were > 42.3 mm and ≤ 26.2 mm, respectively, and the total length of water sprouts on a bearing branch was > 736.5 cm. The third is the state in which the bearing branch basal diameter was > 34.7 mm and its length was ≤ 115.5 cm. The criterion accuracy rates were 0.86, 0.55, and 0.56, respectively (Table 4). Thus, the first showed the best performance. Although decision tree algorithms are generally known to function best with balanced data (Haixiang et al. 2017), this rule’s high accuracy shows that it is reliable even when the dataset is unbalanced. This suggests that the proposed pruning criterion can serve as a practical and trustworthy decision-making tool in real-world orchard management. Also, as demonstrated in recent studies, algorithm-based frameworks applicable to pruning robots have been proposed (Zahid et al. 2021; Tong et al. 2023). Our findings indicate the potential for automation by implementing pruning criteria algorithmically, allowing robots automatically to measure bearing branch characteristics using image-based sensors and make pruning criteria based on these measurements (Tabb and Medeiros 2017).
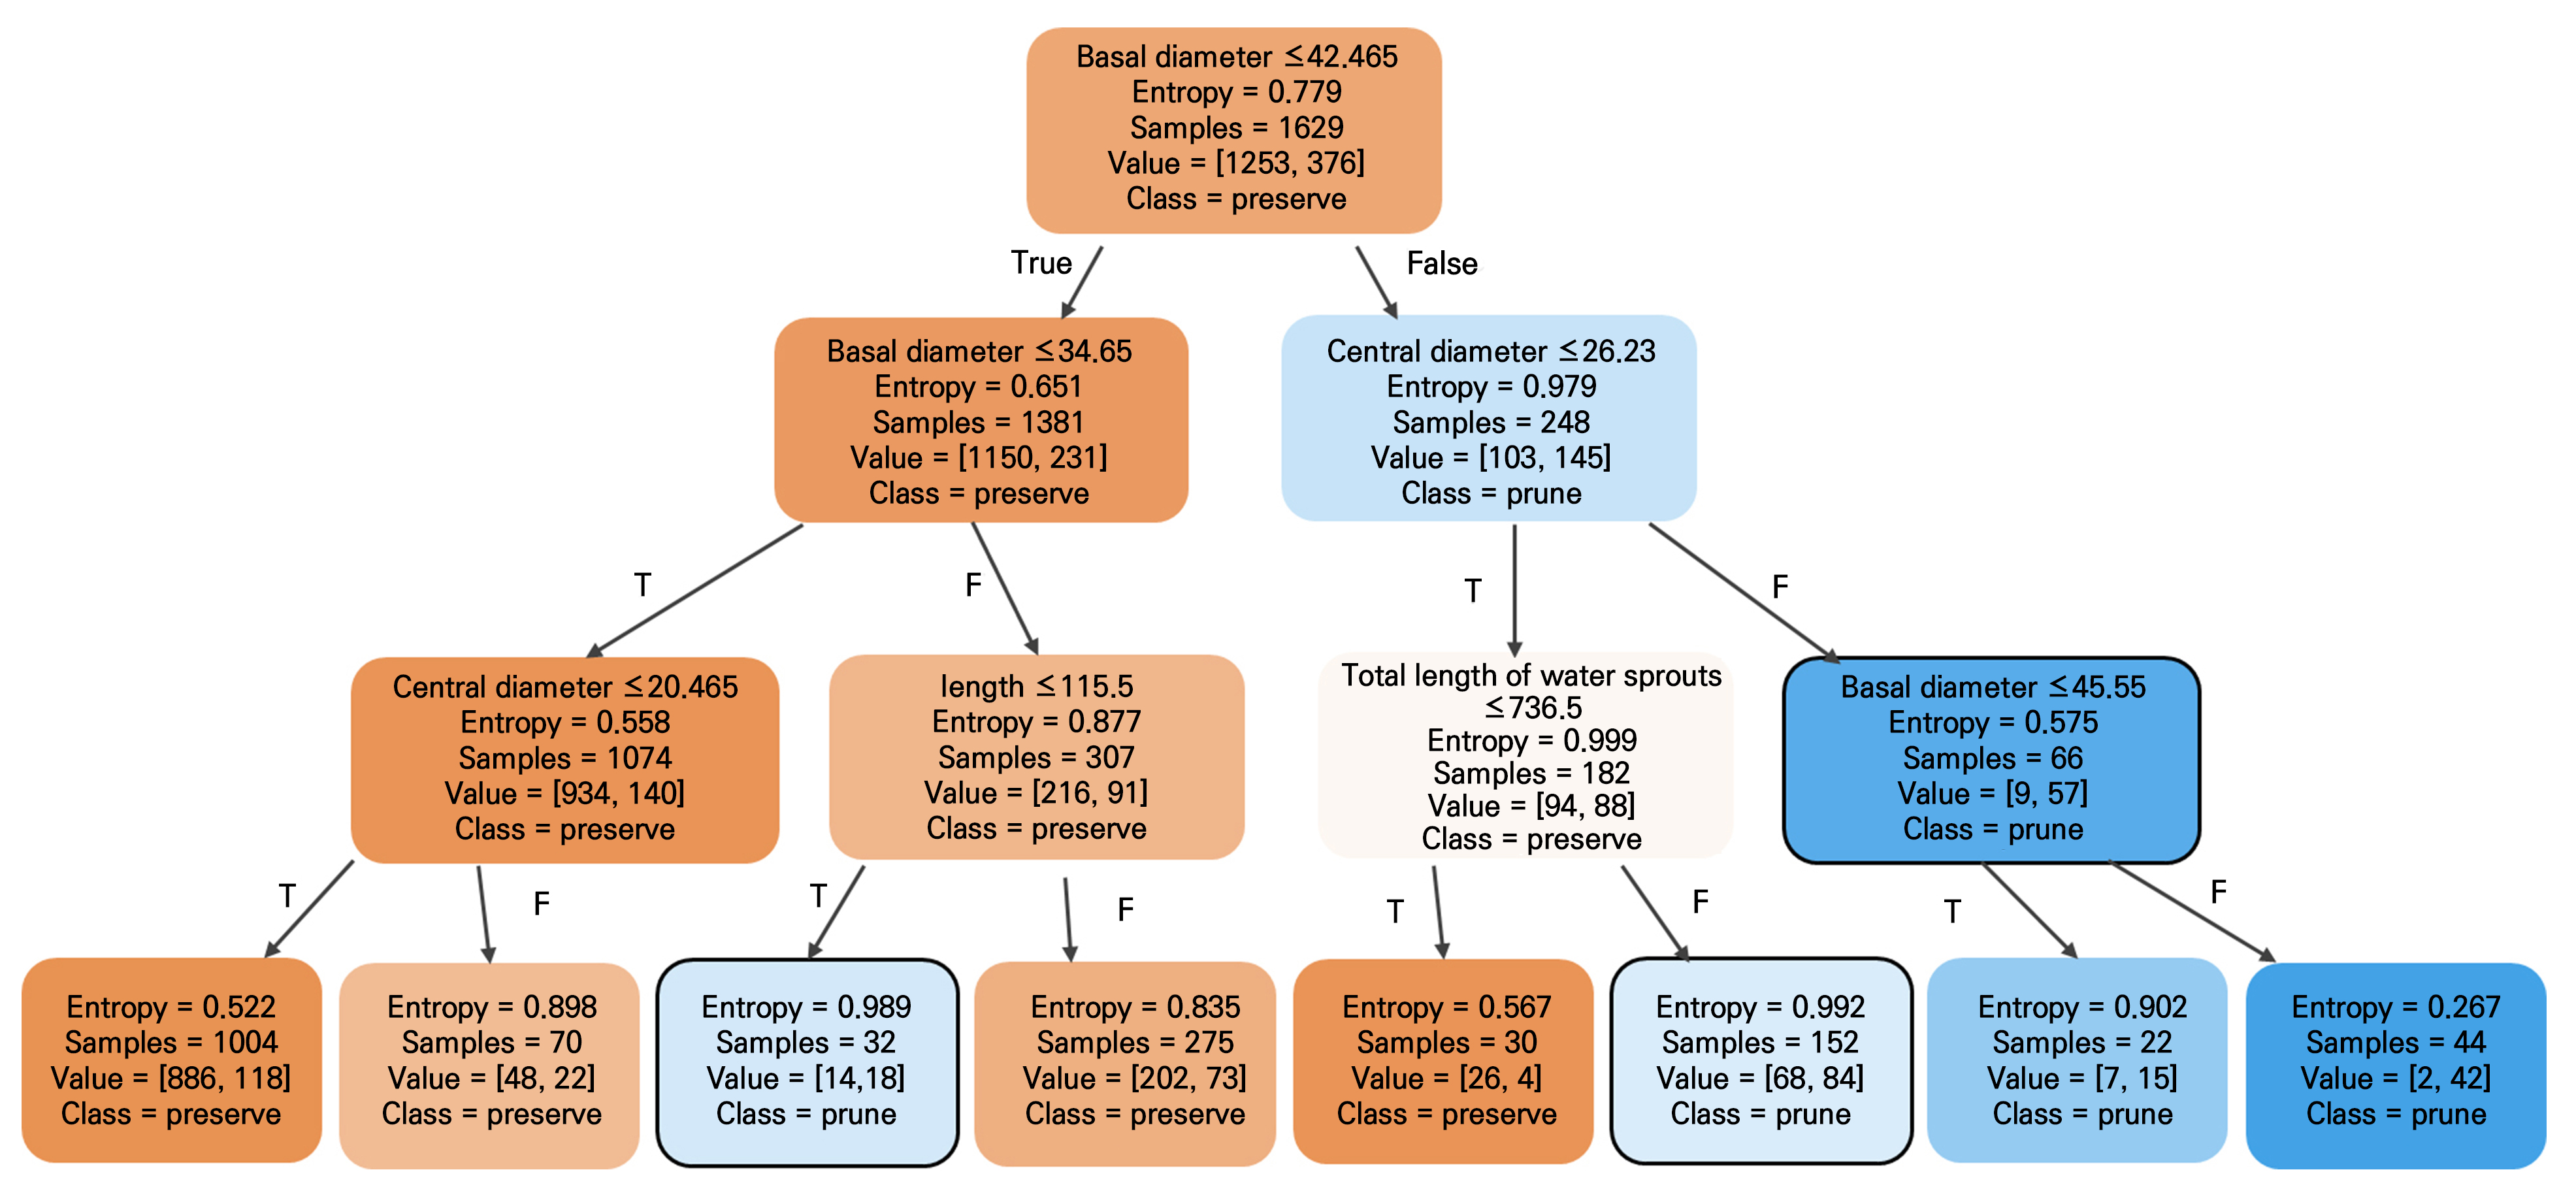
Fig. 8.
Bearing branch pruning decision tree (DT) model. Decision tree model depth = 3. Final tags are reflected on each branch. Basal diameter, bearing branch basal diameter; central diameter, bearing branch central diameter; total length of water sprouts, total length of water sprouts on a bearing branch; length, bearing branch length. Orange nodes indicate predictions for the ‘preserve’ class. Blue nodes indicate predictions for the ‘prune’ class. Color intensity reflects node purity. Gradient colored boxes indicate the degree of impurity in classification tasks and in the range of properties for which the class is concentrated; a darker color indicates a higher degree, and a lighter color indicates a lower degree.
Table 4.
Accuracy of pruning criteria derived from the decision tree (DT) model. Basal diameter, bearing branch basal diameter; central diameter, bearing branch central diameter; total length of water sprouts, total length of water sprouts on a bearing branch; length, bearing branch length
Conclusions
There is a shortage of skilled pruning workers, and the rising cost of this type of labor has become highly problematic to those involved in fruit cultivation. Here, pruning criteria were established according to the bearing branch basal diameter. The bearing branch thickness and water sprout growth increased with age. Fruit yield initially increased with the bearing branch basal diameter and remained constant thereafter. A decision tree analysis disclosed that the bearing branch basal diameter was the major variable to consider in relation to pruning. Branches were to be pruned when the central and basal diameters exceeded 26.2 mm and 42.3 mm, respectively. We believe the present study provides novel insight into pruning criteria based on the bearing branch basal diameter. Nevertheless, future research should aim to quantify the degree of variation in bearing branch basal diameters among locations and determine the practical bearing branch service life. These findings could provide a framework for a pear tree pruning robot system, improve the pruning accuracy and efficiency via model-based decision-making, and should benefit orchard farmers who prune pear trees.
