

Introduction
Materials and Methods
Plant materials and growth conditions
Measurement of environmental conditions
Measurement of growth parameters
Quality scoring criteria
Statistical analyses
Results
Growth parameters for the spring and autumn seasons
Regression analysis between growth parameters and environmental index
Growth status for both the spring and autumn seasons
Graphical tracking of seedlings and grading of seedling quality
Discussion
Conclusion
Introduction
High-quality seedling production is a critical foundation for successful tomato cultivation, particularly in grafted tomato systems where uniform growth, vigorous early development, and stress tolerance are essential for subsequent field performance (Cho 2016a; Cho 2016b). Consistent seedling quality not only enhances transplant survival but also supports yield stability, making standardized production practices increasingly important in the commercial nursery industry (Jang et al. 2019a; Hwang et al. 2020a).
In Korea, the adoption of plug seedling cultivation since the early 1990s has transformed vegetable seedling production from on-farm propagation into a specialized commercial sector (RDA 2016). This system has reduced seed costs, improved field adaptability, and ensured greater uniformity with regard to seedling performance (KSVS 2022). According to the Korea Seed and Variety Service (KSVS 2022), there are 2,561 registered plug seedling nurseries nationwide, with nearly half specializing in fruit and vegetable seedlings. A 2013 survey by the Korea Seed Industry Development Institute (KOSID) reported that most farmers now purchase seedlings rather than produce them themselves, with adoption rates of 55% for peppers, 85% for watermelons, and 93% for tomatoes. Over the past three decades, this industry has developed into a highly specialized field, with many nurseries operating advanced greenhouse facilities equipped with environmental control systems that enable year-round production.
In commercial practice, seedling production in Korea is concentrated in the spring (March–May) and autumn (August–October) seasons. However, pronounced seasonal climate variations make it challenging to maintain consistent seedling quality. Spring cultivation is generally characterized by temperatures of 10–25°C and increasing day lengths, whereas autumn cultivation means temperatures of 15–30°C and shorter photoperiods (Jeong and Bae 2024). Such differences necessitate season-specific management strategies. Despite technological advances, variations in quality persist among nurseries, largely due to differences in seasonal environmental conditions and management practices. Tomato seedlings are particularly sensitive to fluctuations in temperature and light (Heuvelink 1999; Adams et al. 2001).
Growing degree days (GDD), which quantify days of cumulative heat above a crop-specific base temperature, and light integral (LI), calculated as the cumulative photosynthetically active radiation (PAR, 400–700 nm) over a defined period, are widely recognized as key environmental indices for predicting plant growth and development (McMaster and Wilhelm 1997; Runkle 2006). For tomatoes, base temperatures typically range from 8 to 12°C, with upper thresholds between 26 and 35°C depending on the cultivar and stage (Heuvelink 1999; Adams et al. 2001). LI, conceptually related to the daily light integral (DLI), represents the total amount of light energy available for photosynthesis and biomass accumulation during the cultivation period (Lee et al. 2012). Both GDD and LI integrate fluctuating environmental conditions into standardized quantitative metrics, enabling direct comparisons of growth performance across seasons and production systems. In Korean greenhouses, LI can vary from 5 to 15 mol·m-2·d-1 in winter to 25 to 40 mol·m-2·d-1 in summer (Um et al. 2009a; Kim et al. 2021), while seasonal temperature patterns strongly influence GDD accumulation rates. These variations directly affect the timing, rate, and uniformity of seedling development, highlighting the need for environmental index–based growth standards for objective quality assessments.
Although various environmental control strategies—such as day/night temperature management (Kang et al. 2011a; Kang et al. 2011b), light intensity and spectral quality adjustments (Um et al. 2009b; Hwang et al. 2020b), nutrient optimization (Jang et al. 2019b), and growth regulator treatments (Zhang et al. 2003a; Zhang et al. 2003b)—have been developed to improve seedling quality, systematic efforts to establish growth standards and objective quality evaluation methods for grafted tomato seedlings based on environmental indices remain limited.
Therefore, this study aimed to establish standard growth indicators for grafted tomato seedlings using environment-based indices and to propose objective quality evaluation criteria. Relationships between GDD, LI, and growth parameters were analyzed using two years of data collected from commercial nurseries across spring and autumn production cycles. A graphical trajectory tracking approach was developed to visualize growth progression through five distinct developmental stages. The resulting growth standards and quality evaluation methods are expected to provide practical benchmarks for nursery managers, enabling the consistent production of high-quality seedlings under diverse environmental conditions.
Materials and Methods
Plant materials and growth conditions
‘TY Sharmang’ (The Kiban Co., Anseong, Republic of Korea) was used as the scion, whereas ‘B-blocking’ (Takii Seed Co., Seoul, Republic of Korea) was used as the rootstock for tomato seedlings. The seedlings were cultivated at Solnae Nursery, Iksan-si, Jeonbuk-do, Republic of Korea (36°03'26"N, 126°58'20"E). The scion was propagated in 128-cell plug trays, whereas the rootstock and grafted seedlings were propagated in 50-cell plug trays. Growth measurements were taken at five stages: cotyledon (Ⅰ), true leaf (Ⅱ), pre-grafting (Ⅲ), post-grafting (Ⅳ), and shipping (Ⅴ). The seedlings underwent five cultivation cycles, including two in spring and three in autumn. The cultivation period and corresponding biological replication of the seedlings are presented in Table 1.
Table 1.
Cultivation periods and developmental stages of tomato seedlings in the spring and autumn seasons
| Season | Cultivation period | Growth stagez | Replication | ||||
| Ⅰ | Ⅱ | Ⅲ | Ⅳ | Ⅴ | |||
| Spring | Apr. 13–Jun. 2, 2023 | DAS 8 | DAS 18 | DAS 24 | DAS 38 | DAS 49 | n = 20 |
| Mar. 8–Apr. 26, 2024 | DAS 11 | DAS 18 | DAS 24 | DAS 32 | DAS 49 | n = 20 | |
| Autumn | Aug. 29–Oct. 18, 2022 | DAS 8 | DAS 18 | DAS 24 | DAS 38 | DAS 50 | n = 10 |
| Sep. 1–Oct. 20, 2022 | DAS 8 | DAS 16 | DAS 24 | DAS 37 | DAS 47 | n = 5 | |
| Sep. 14–Nov. 3, 2023 | DAS 11 | DAS 18 | DAS 26 | DAS 32 | DAS 50 | n = 20 | |
Measurement of environmental conditions
Environmental parameters, in this case the temperature, humidity, and light intensity, were monitored using a data logger (aM-31; WISE Sensing Inc., Yongin, Republic of Korea). GDD was calculated based on Tmax (daily maximum temperature), Tmin (daily minimum temperature), and Tb (base temperature of 10°C) (Wi et al. 2021), and light integral (LI, mol·m-2) was determined as the cumulative photosynthetically active radiation (PAR, 400–700 nm) over the cultivation period (Runkle 2006) using the following equations, respectively:
where PPFD denotes the photosynthetic photon flux density.
Measurement of growth parameters
Various growth parameters were measured, specifically the plant height, stem diameter, shoot fresh and dry weights, and leaf length, width, area, and number. Plant height was measured from the soil surface to the growing point of the stem, whereas leaf length and width were measured for the largest true leaf. Leaf number and area were determined for leaves longer than 2 cm, and leaf area was analyzed using the ImageJ software (version 1.54, bundled with Java 8, National Institutes of Health, Bethesda, MD, USA). Shoot fresh weight was recorded using an electronic scale (UX420H; Shimadzu Corp., Kyoto, Japan), whereas shoot dry weight was measured after drying the samples at 80°C for over 72 h in an oven (HB-502M; HanBaek Scientific, Bucheon, Republic of Korea).
Quality scoring criteria
An arbitrary quality scoring system (Table 5) was developed to evaluate tomato seedlings based on seven growth parameters: plant height, leaf length, leaf width, leaf number, stem diameter, leaf area, shoot fresh weight, and shoot dry weight. For each parameter, the mean (Average) and standard deviation (SD) were calculated from five experiments conducted over two years across both the spring and autumn seasons. The scoring criteria were established by dividing the distribution of each parameter into five categories according to 0.5 SD increments from the mean. Values falling within ±0.5 SD of the mean were assigned the highest score of 5, reflecting optimal growth performance. Values deviating from the mean by more than 0.5 SD but not exceeding 1.5 SD were assigned a score of 3, while values deviating by 1.5–2.5 SD received the lowest score of 1. These ranges were applied symmetrically above and below the mean, such that both excessively low and excessively high values relative to the standard reference range resulted in lower scores. This approach ensured that the seedlings most closely aligned with the established growth standards received the highest quality rating, whereas those exhibiting greater deviation from the standard reference values were graded lower.
Statistical analyses
Data were collected from a total of five cultivation experiments. The corresponding numbers of individual plant replications for these experiments were 20 (Spring 2023), 20 (Spring 2024), 10 (Autumn Aug. 2022), 5 (Autumn Sep. 2022), and 20 (Autumn 2023). All statistical analyses of the collected data were performed using RStudio ver. 4.0.2 (R Studio Desktop, Boston, MA, United States). Growth data are presented as the mean ± standard error. To evaluate the effects of different growth stages and conditions, analysis of variance (ANOVA) was utilized, with the means compared using Duncan’s multiple range test at a significance level of p < 0.05. To analyze the relationship between the environmental indices (GDD and LI) and various growth parameters, both linear and exponential regression models were fitted to the data using Microsoft Office Excel 2019 (Microsoft Corporation, Redmond, WA, USA). Graphical representations were generated using SigmaPlot (Systat Software Inc., San Jose, CA, USA).
Results
Growth parameters for the spring and autumn seasons
In the spring season experiments, the growth parameters of tomato seedlings showed consistent progression through five developmental stages (Table 2). At the cotyledon stage (Stage Ⅰ, 9 DAS), the seedlings exhibited minimal development with plant heights of 2.95 ± 0.08 cm (scion) and 2.68 ± 0.05 cm (rootstock), whereas stem diameters measured 0.77 ± 0.02 and 0.85 ± 0.02 mm, respectively. Shoot biomass remained minimal, with scion showing fresh weights in the range of 0.065 ± 0.003 g. The true leaf stage (Stage Ⅱ, 18 DAS) marked a significant advancement. Scion leaves averaged 4.09 ± 0.15 and 3.13 ± 0.13 cm in length and width, respectively, whereas rootstock leaves measured 4.61 ± 0.14 and 3.36 ± 0.17 cm in length and width, respectively. At the true leaf stage (Stage Ⅱ, 18 DAS) in spring, rootstock exhibited a significantly greater leaf area (12.31 ± 1.18 cm2) than scion (7.90 ± 0.59 cm2). This superiority persisted into the pre-grafting stage (Stage Ⅲ, 24 DAS), where rootstock maintained higher leaf area (22.91 ± 0.57 cm2 compared with 18.34 ± 1.17 cm2 in scion), shoot fresh weight (1.418 ± 0.043 g compared with 1.075 ± 0.062 g), and stem diameter values (2.83 ± 0.04 mm compared with 2.41 ± 0.06 mm). Post-grafting (Stage Ⅳ, 35 DAS), plants reached 8.46 ± 0.24 cm height with a leaf area of 45.16 ± 1.41 cm2. At the shipping stage (Stage Ⅴ, 49 DAS), the grafted plants achieved maximum growth, with heights of 18.43 ± 0.34 cm, leaf lengths of 13.57 ± 0.17 cm, leaf area values of 181.05 ± 6.34 cm2, and shoot fresh weights of 10.261 ± 0.432 g.
Table 2.
Growth characteristics of scion and rootstock at different developmental stages in grafted tomato seedlings during the spring season
|
Days after sowing |
Growth stagez |
Grafting condition |
Plant height (cm) |
Leaf length (cm) |
Leaf width (cm) |
Leaf number |
Stem diameter (mm) |
Leaf area (cm2) |
Shoot fresh weight (g) |
Shoot dry weight (g) |
| 09 | Ⅰ | Scion | 2.95 ± 0.08 e | -y | - | - | 0.77 ± 0.02 g | - | 0.065 ± 0.003 b | 0.005 ± 0.001 g |
| Stock | 2.68 ± 0.05 e | - | - | - | 0.85 ± 0.02 g | - | 0.080 ± 0.002 b | 0.006 ± 0.001 g | ||
| 18 | Ⅱ | Scion | 4.79 ± 0.10 d | 4.09 ± 0.15 d | 3.13 ± 0.13 d | 2.1 ± 0.1 e | 1.90 ± 0.04 f | 7.90 ± 0.59 f | 0.425 ± 0.020 f | 0.034 ± 0.001 f |
| Stock | 4.76 ± 0.19 d | 4.61 ± 0.14 d | 3.36 ± 0.17 d | 2.5 ± 0.1 d | 2.18 ± 0.04 e | 12.31 ± 1.18 e | 0.627 ± 0.043 e | 0.043 ± 0.002 e | ||
| 24 | Ⅲ | Scion | 6.14 ± 0.20 c | 5.96 ± 0.22 c | 4.87 ± 0.20 c | 2.7 ± 0.1 cd | 2.41 ± 0.06 d | 18.34 ± 1.17 d | 1.075 ± 0.062 d | 0.090 ± 0.006 d |
| Stock | 5.54 ± 0.09 c | 5.83 ± 0.10 c | 4.78 ± 0.08 c | 4.0 ± 0.1 b | 2.83 ± 0.04 c | 22.91 ± 0.57 c | 1.418 ± 0.043 c | 0.114 ± 0.003 c | ||
| Grafted | 5.69 ± 0.19 c | 5.31 ± 0.19 c | 5.31 ± 0.21 c | 3.0 ± 0.1 c | 2.51 ± 0.06 d | 21.93 ± 1.45 c | 0.931 ± 0.044 d | 0.084 ± 0.004 d | ||
| 35 | Ⅳ | Grafted | 8.46 ± 0.24 b | 8.38 ± 0.15 b | 7.52 ± 0.19 b | 4.3 ± 0.1 b | 3.18 ± 0.04 b | 45.16 ± 1.41 b | 2.556 ± 0.056 b | 0.228 ± 0.007 b |
| 49 | Ⅴ | Grafted | 18.43 ± 0.34 a | 13.57 ± 0.17 a | 12.00 ± 1.50 a | 7.9 ± 0.1 a | 4.20 ± 0.06 a | 181.05 ± 6.34 a | 10.261 ± 0.432 a | 0.974 ± 0.046 a |
zⅠ: cotyledon stage; Ⅱ: true leaf stage; Ⅲ: before or after grafting; Ⅳ: after grafting; and Ⅴ: shipping stage.
yLeaf length, width, number, and area at the cotyledon stage were not measured. Experiments were performed twice from April 13 to June 20, 2023, and from April 03–26, 2024, with 20 replications for each period. Means followed by the same letter in each column are not significantly different at p < 0.05 based on Duncan’s multiple range test. The reported values represent the mean ± standard error of 40 replicates.
Autumn production displayed similar patterns with seasonal variations (Table 3). Unlike in spring, scion showed superior early growth at the cotyledon stage with a plant height of 3.61 ± 0.10 cm compared with that of rootstock at 2.90 ± 0.07 cm. By true leaf stage (Stage Ⅱ, 17 DAS), scion maintained a height advantage (5.61 ± 0.07 cm) over rootstock (4.27 ± 0.08 cm) and produced larger leaves (4.28 ± 0.10 cm compared to 3.61 ± 0.09 cm length), resulting in a greater leaf area (11.08 ± 0.93 cm2) than rootstock (8.52 ± 0.89 cm2). At the pre-grafting stage (Stage Ⅲ, 25 DAS), the rootstock specimens demonstrated expected superiority with the leaf area and shoot fresh weight values of 36.50 ± 1.41 cm2 and 2.130 ± 0.077 g, respectively, compared to the corresponding values for scion specimens of 26.62 ± 1.23 cm2 and 1.507 ± 0.042 g. The autumn shipping stage (Stage Ⅴ, 49 DAS) achieved 16.85 ± 0.40 cm heights, 160.03 ± 4.58 cm2 leaf areas, and 8.362 ± 0.214 g shoot fresh weights, an outcome approximately 18% lower than the corresponding spring value (10.261 ± 0.432 g).
Table 3.
Growth characteristics of scion and rootstock at different developmental stages in grafted tomato seedlings during the autumn season
|
Days after sowing |
Growth stagez |
Grafting condition |
Plant height (cm) |
Leaf length (cm) |
Leaf width (cm) |
Leaf number |
Stem diameter (mm) |
Leaf area (cm2) |
Shoot fresh weight (g) |
Shoot dry weight (g) |
| 09 | Ⅰ | Scion | 3.61 ± 0.10 f | -y | - | - | 0.88 ± 0.04 f | - | 0.083 ± 0.006 g | 0.007 ± 0.001 f |
| Stock | 2.90 ± 0.07 g | - | - | - | 0.89 ± 0.03 f | - | 0.064 ± 0.004 g | 0.006 ± 0.001 f | ||
| 17 | Ⅱ | Scion | 5.61 ± 0.07 d | 4.28 ± 0.10 d | 3.55 ± 0.17 d | 2.3 ± 0.1 d | 1.87 ± 0.04 e | 11.08 ± 0.93 d | 0.571 ± 0.025 f | 0.053 ± 0.003 e |
| Stock | 4.27 ± 0.08 e | 3.61 ± 0.09 e | 2.96 ± 0.14 e | 2.5 ± 0.1 d | 1.76 ± 0.04 e | 8.52 ± 0.89 e | 0.506 ± 0.036 f | 0.044 ± 0.003 e | ||
| 25 | Ⅲ | Scion | 8.20 ± 0.21 b | 7.63 ± 0.30 c | 6.39 ± 0.21 b | 3.5 ± 0.1 c | 2.59 ± 0.04 d | 26.62 ± 1.23 c | 1.507 ± 0.042 d | 0.132 ± 0.005 d |
| Stock | 7.10 ± 0.13 c | 7.10 ± 0.21 c | 5.72 ± 0.11 c | 4.5 ± 0.1 b | 2.82 ± 0.03 c | 36.50 ± 1.41 b | 2.130 ± 0.077 c | 0.177 ± 0.005 c | ||
| 35 | Ⅳ | Grafted | 8.31 ± 0.36 b | 9.80 ± 0.53 b | 7.84 ± 0.32 b | 4.4 ± 0.2 b | 3.19 ± 0.05 b | 50.24 ± 3.99 b | 2.830 ± 0.195 b | 0.232 ± 0.016 b |
| 49 | Ⅴ | Grafted | 16.85 ± 0.40 a | 14.37 ± 0.49 a | 11.02 ± 0.14 a | 7.6 ± 0.1 a | 3.67 ± 0.05 a | 160.03 ± 4.58 a | 8.362 ± 0.214 a | 0.816 ± 0.031 a |
zⅠ: cotyledon stage; Ⅱ: true leaf stage; Ⅲ: before grafting; Ⅳ: after grafting; and Ⅴ: shipping stage.
Regression analysis between growth parameters and environmental index
The regression analysis revealed strong correlations between LI and all growth parameters, with most showing similar fits for linear and exponential models (Fig. 1). Plant height correlated slightly better with the linear model (R2 = 0.7185) than with the exponential model, suggesting a constant growth rate with light accumulation, unlike the corresponding thermal response. Leaf parameters showed high sensitivity to LI; leaf length had similar fits for both models (R2 ≈ 0.74), while leaf width responded more linearly (R2 = 0.8694). Leaf number and stem diameter showed the strongest correlations (R2 > 0.84), indicating direct responsiveness to light. Leaf area fit slightly better with the exponential model (R2 = 0.7787), suggesting accelerated expansion with LI. Biomass parameters (shoot fresh and dry weights) also showed very strong correlations, with exponential models performing slightly better (R2 ≈ 0.85), indicating that biomass accumulation has an accelerating pattern with an increase in LI. Overall, LI was a stronger predictor than GDD for the parameters of the leaf number, stem diameter, and biomass.
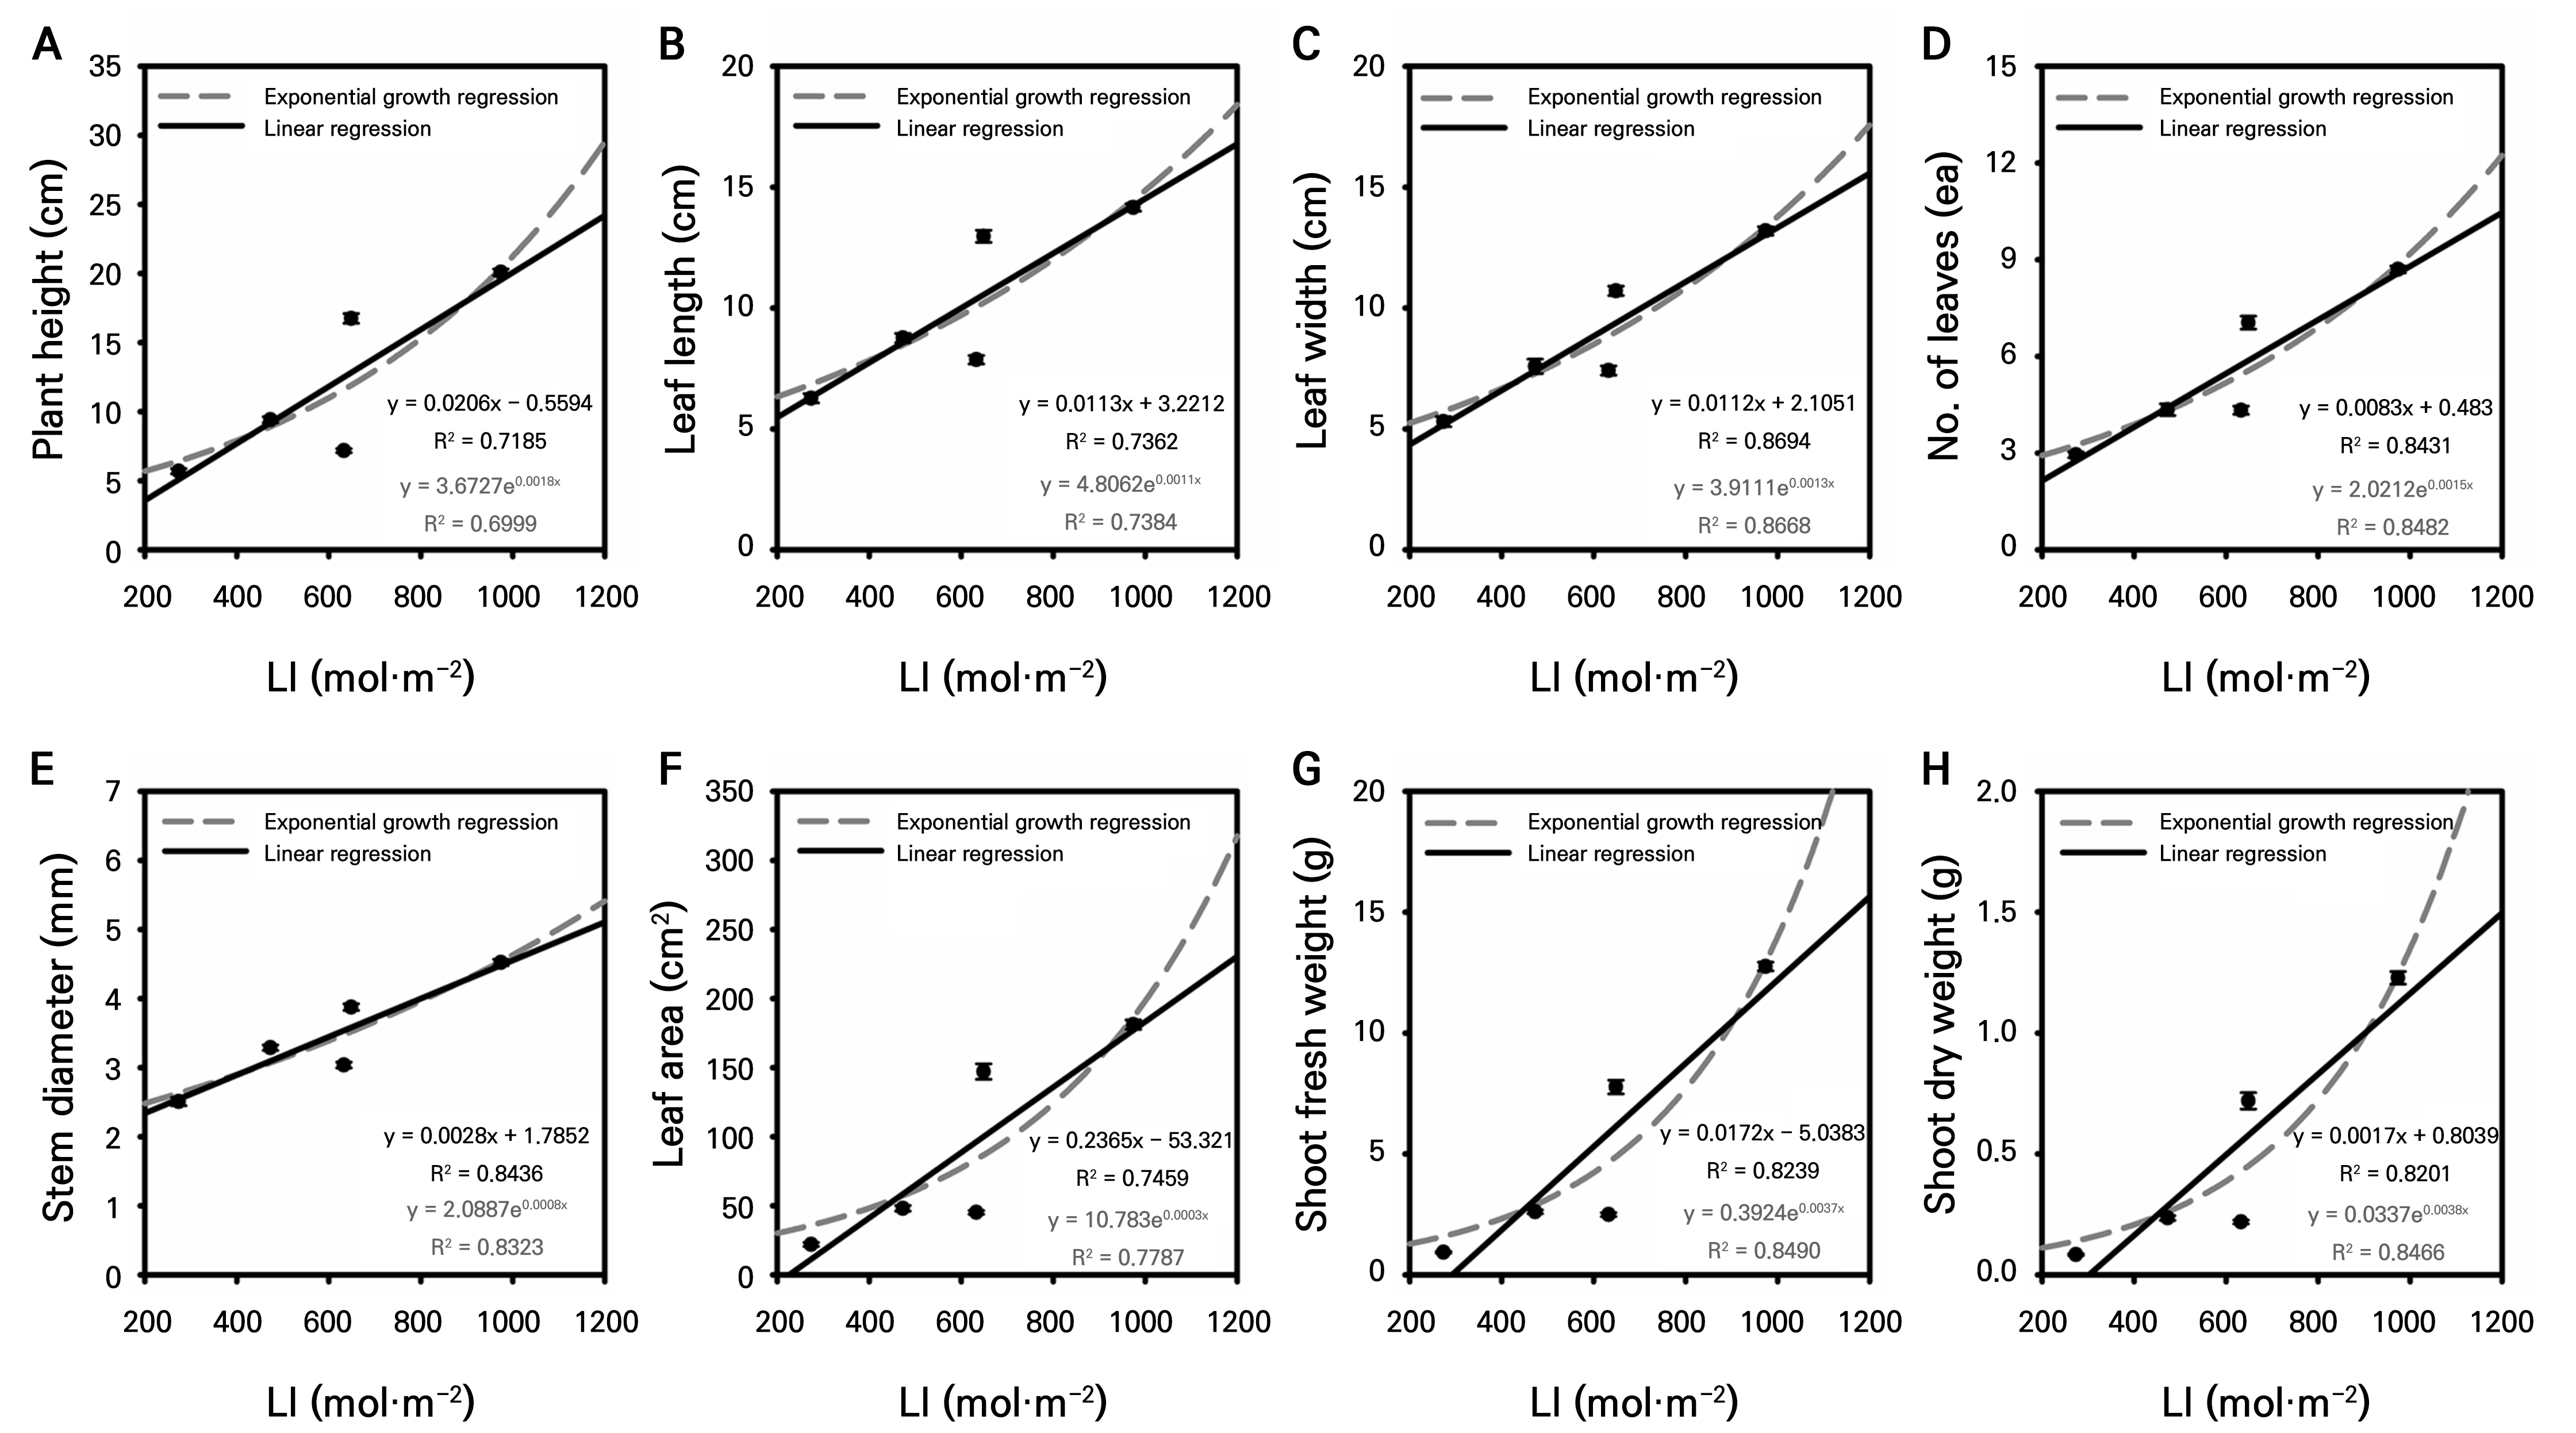
Fig. 1.
Linear and exponential regression analyses showing the relationship between light integral (LI) and various growth parameters: plant height (a), leaf length (b), leaf width (c), number of leaves (d), stem diameter (e), leaf area (f), shoot fresh weight (g), and shoot dry weight (h). The regression models were fitted to the average values of growth parameters obtained from a representative cultivation cycle (n=20).
Vegetative growth parameters generally fit better to exponential models, indicating accelerated growth with thermal accumulation (Fig. 2). Plant height showed a higher correlation in the exponential model (R2 = 0.8268), aligning with typical sigmoidal growth. Among leaf traits, length was most sensitive (exponential R2 = 0.8111), followed by leaf area (R2 = 0.7634), while leaf width showed a moderate correlation. Stem diameter correlated consistently (R2 = 0.7025 exponential). Leaf number displayed a moderate correlation (R2 = 0.6932 exponential), suggesting additional environmental influences beyond temperature. Biomass parameters had notably higher fits in exponential models (fresh R2 = 0.6982; dry R2 = 0.7006) than in linear models, reflecting compounding effects of thermal accumulation on structural and photosynthetic growth.
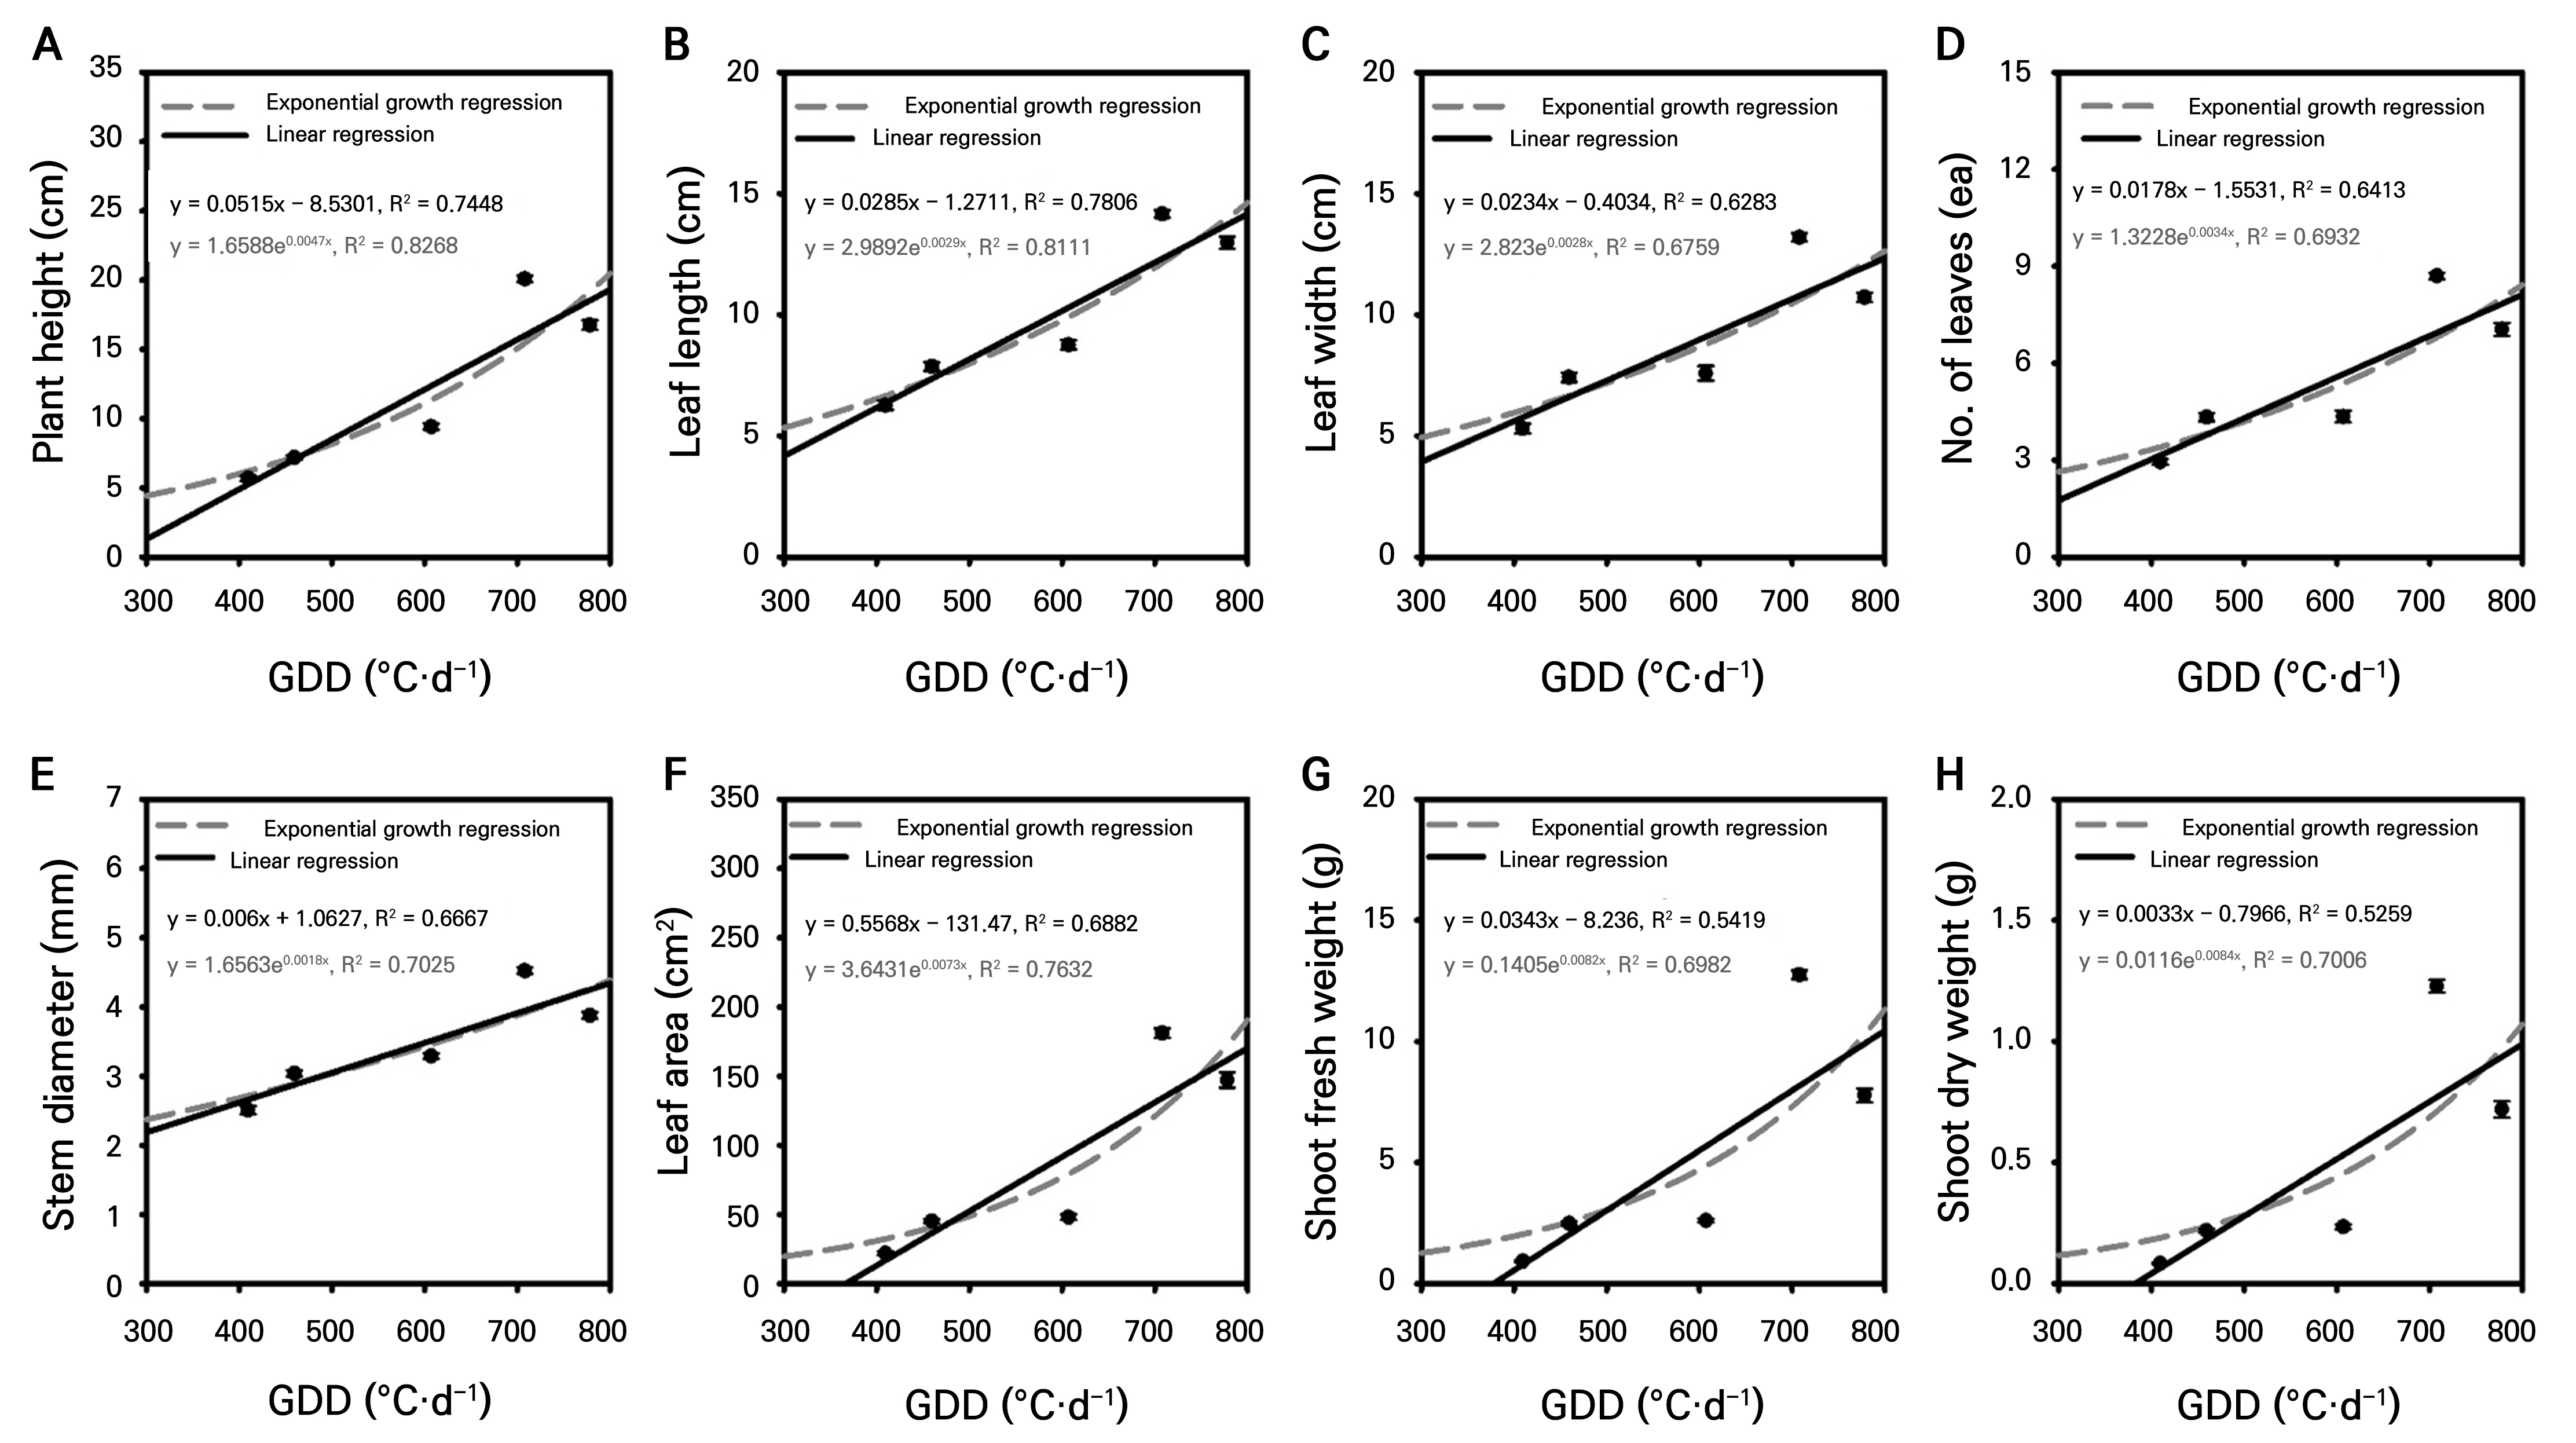
Fig. 2.
Linear and exponential regression analyses showing the relationship between growing degree days (GDD) and various growth parameters: plant height (a), leaf length (b), leaf width (c), number of leaves (d), stem diameter (e), leaf area (f), shoot fresh weight (g), and shoot dry weight (h). The regression models were fitted to the average values of growth parameters obtained from a representative cultivation cycle (n=20).
Growth status for both the spring and autumn seasons
The combined analysis of the growth of the grafted tomato seedlings across five experimental trials (n = 75) revealed consistent developmental patterns through five distinct stages, with pooled data reflecting seasonal variations (Fig. 3 and Table 4). At the shipping stage (Stage Ⅴ, 49 DAS), the grafted seedlings achieved final specifications of 17.69 ± 0.27 cm for the plant height, 7.7 ± 0.1 for the leaves, 171.24 ± 4.16 cm2 for the leaf area, and 9.375 ± 0.273 g in the case of the fresh weight. These parameters represented significant increases from the post-grafting stage (Stage Ⅳ, 35 DAS), with the height increasing 2.1-fold, the leaf area 3.6-fold, and the fresh weight 3.5-fold during this critical 14-d period. Throughout early development, rootstock consistently outperformed scion genotypes. At the pre-grafting stage (Stage Ⅲ, 25 DAS), the rootstock demonstrated superior growth, with leaf area and shoot fresh weight values of 31.56 ± 1.28 cm2 and 1.871 ± 0.069 g, respectively, compared to the corresponding outcomes for scion specimens at 28.61 ± 1.03 cm2 and 1.350 ± 0.045 g. This growth differential was maintained from the true leaf stage onwards. The grafting process induced a temporary growth reduction, as evidenced by the grafted plants showing intermediate values at Stage Ⅲ (5.69 ± 0.19 cm height, 21.93 ± 1.45 cm2 leaf area) compared with those of ungrafted scion and rootstock. However, successful graft union resulted in dramatic growth acceleration between Stages Ⅳ and Ⅴ.
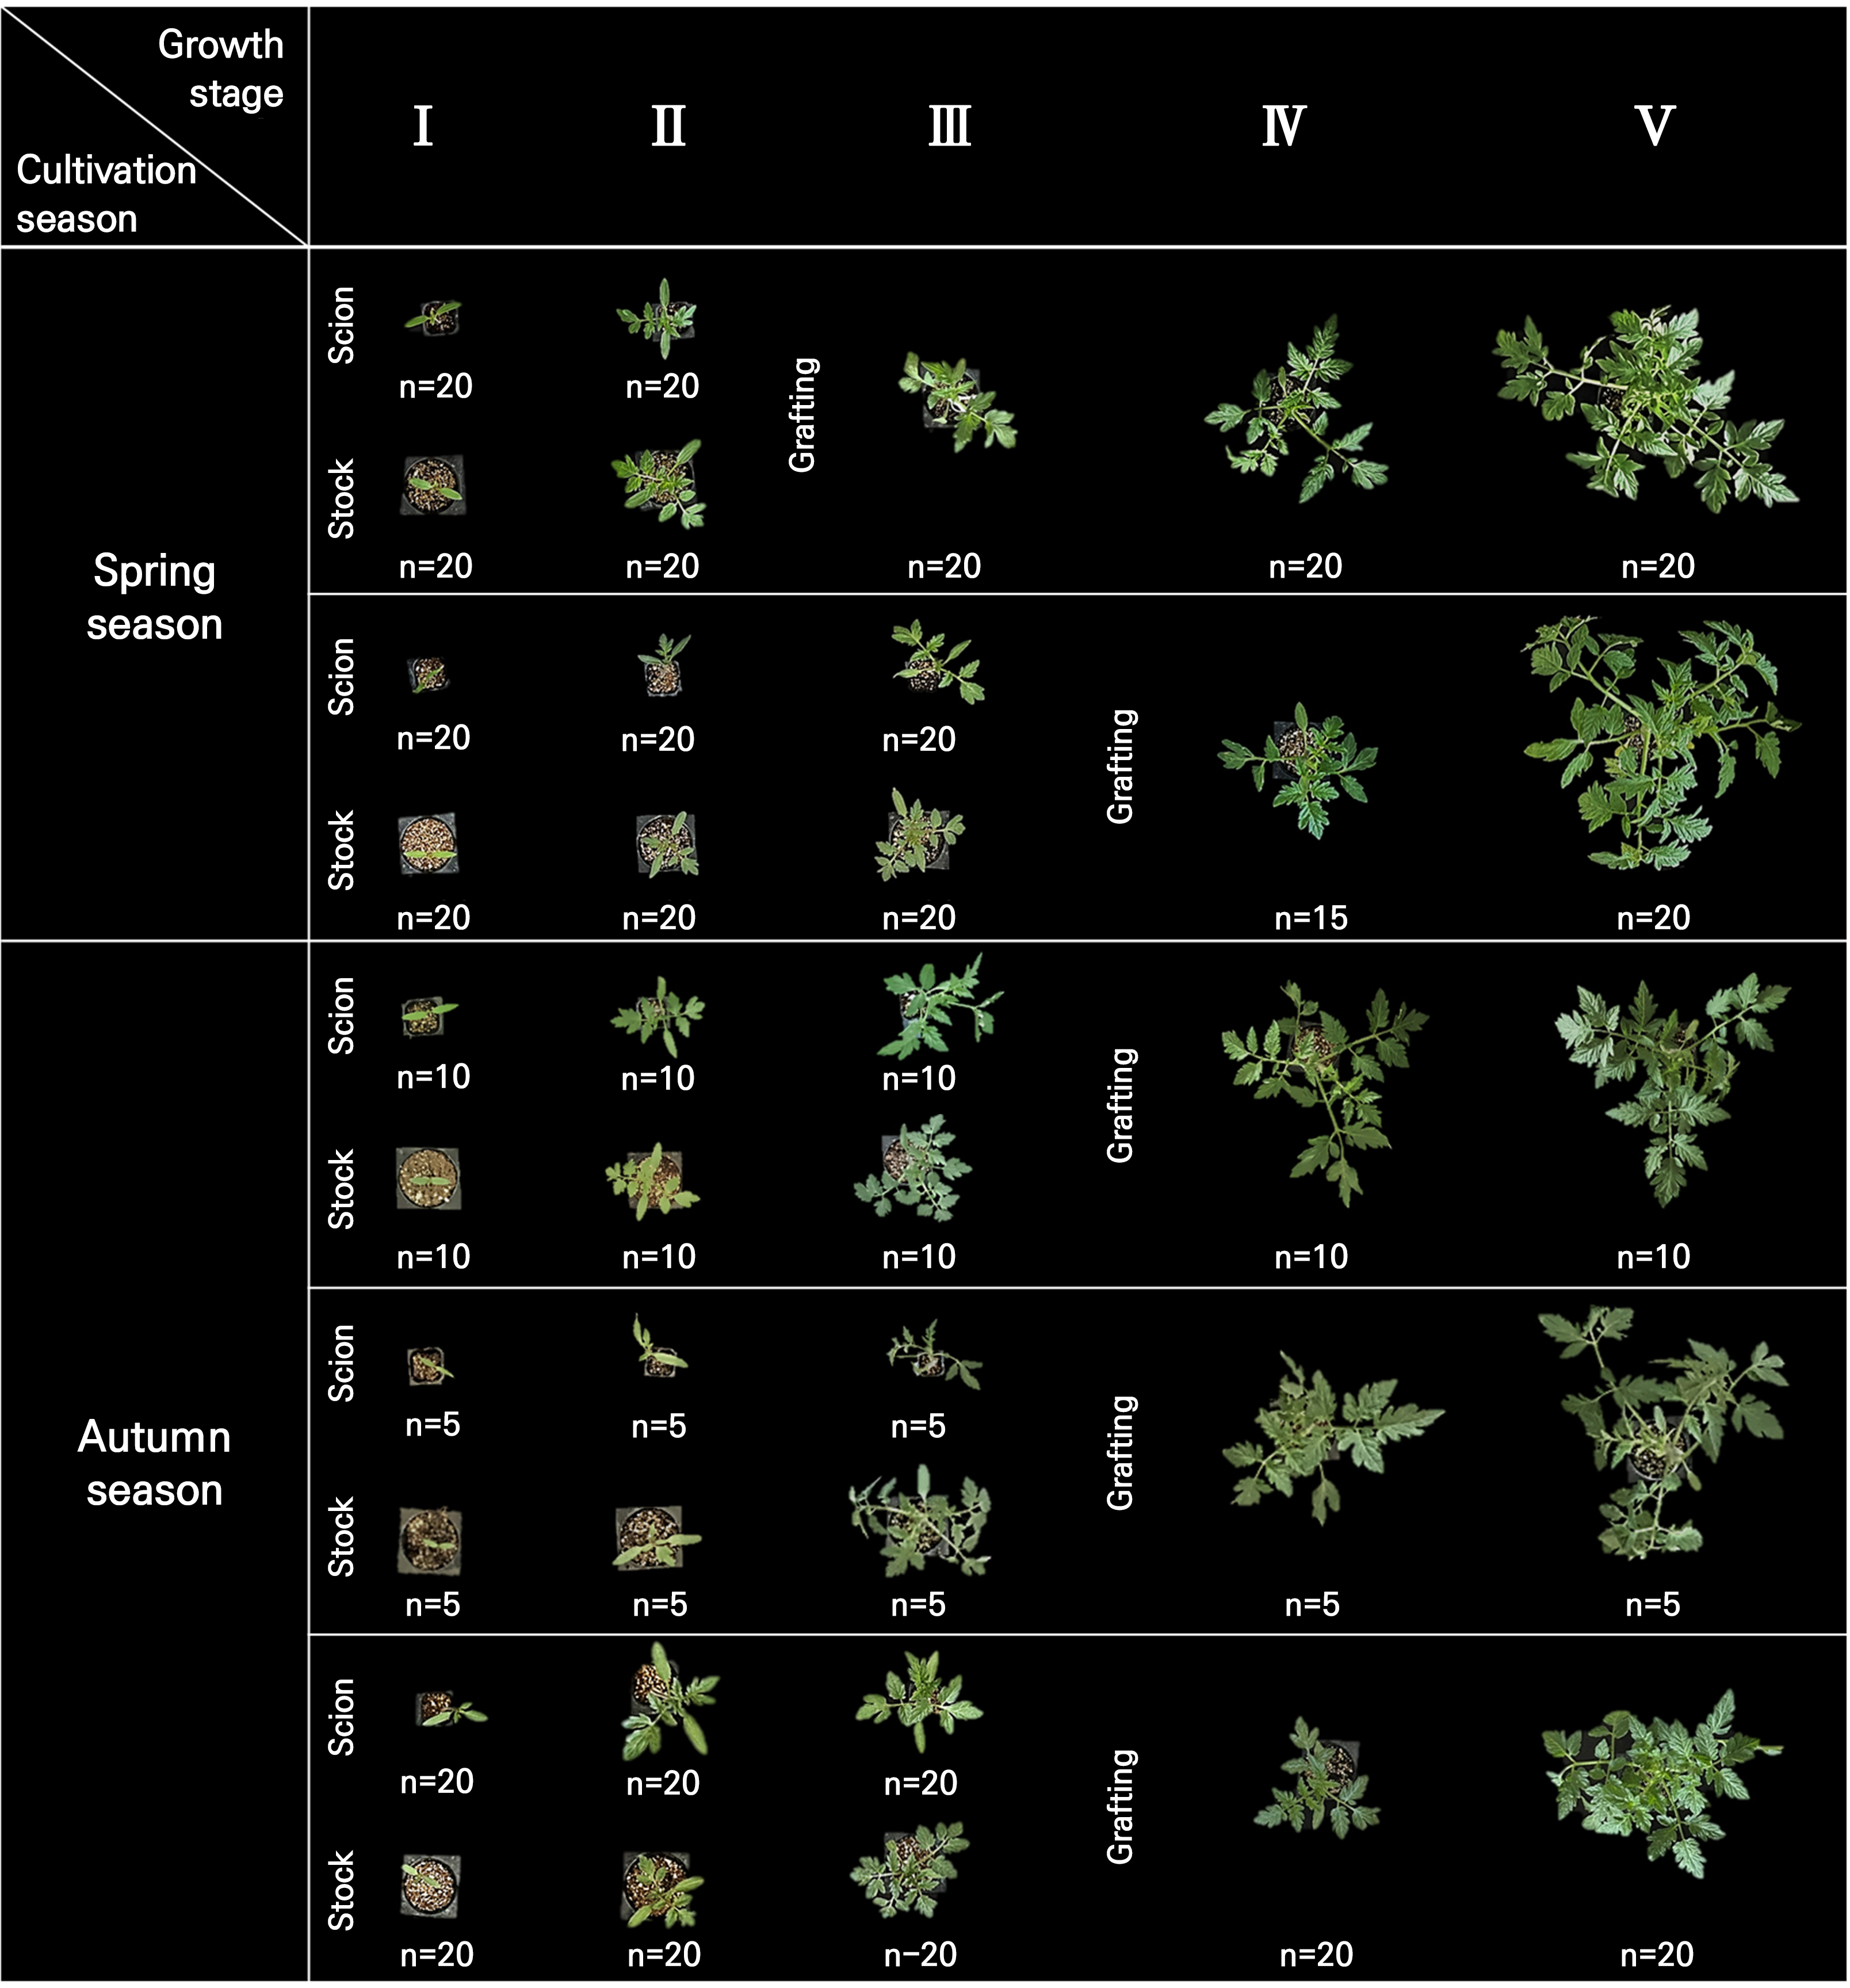
Table 4.
Growth characteristics of tomato seedlings based on the growth stage for all experimental trials
|
Days after sowing |
Growth stagez |
Grafting condition |
Plant height (cm) |
Leaf length (cm) |
Leaf width (cm) |
Leaf number |
Stem diameter (mm) |
Leaf area (cm2) |
Shoot fresh weight (g) |
Shoot dry weight (g) |
| 09 | Ⅰ | Scion | 3.26 ± 0.07 g | -y | - | - | 0.82 ± 0.02 g | - | 0.073 ± 0.003 g | 0.006 ± 0.001 g |
| Stock | 2.78 ± 0.05 h | - | - | - | 0.87 ± 0.02 g | - | 0.073 ± 0.002 g | 0.006 ± 0.001 g | ||
| 17 | Ⅱ | Scion | 5.17 ± 0.08 e | 4.18 ± 0.09 e | 3.33 ± 0.11 d | 2.2 ± 0.1 d | 1.89 ± 0.03 f | 9.38 ± 0.57 f | 0.493 ± 0.018 f | 0.043 ± 0.002 f |
| Stock | 4.53 ± 0.11 f | 4.14 ± 0.11 e | 3.17 ± 0.11 d | 2.5 ± 0.1 d | 1.99 ± 0.04 e | 10.54 ± 0.78 f | 0.570 ± 0.029 f | 0.044 ± 0.002 f | ||
| 25 | Ⅲ | Scion | 7.45 ± 0.20 b | 7.02 ± 0.23 c | 5.84 ± 0.18 c | 3.2 ± 0.1 c | 2.52 ± 0.03 d | 28.61 ± 1.03 d | 1.350 ± 0.045 d | 0.117 ± 0.005 d |
| Stock | 6.53 ± 0.13 c | 6.64 ± 0.16 c | 5.38 ± 0.10 b | 4.3 ± 0.1 b | 2.83 ± 0.02 c | 31.56 ± 1.28 c | 1.871 ± 0.069 c | 0.154 ± 0.005 c | ||
| Grafted | 5.69 ± 0.19 d | 6.27 ± 0.19 d | 5.31 ± 0.21 c | 3.0 ± 0.1 c | 2.51 ± 0.06 d | 21.93 ± 1.45 e | 0.931 ± 0.044 e | 0.084 ± 0.004 e | ||
| 35 | Ⅳ | Grafted | 8.38 ± 0.21 b | 9.09 ± 0.28 b | 7.48 ± 0.18 b | 4.4 ± 0.1 b | 3.19 ± 0.03 b | 47.70 ± 2.05 b | 2.693 ± 0.099 b | 0.230 ± 0.009 b |
| 49 | Ⅴ | Grafted | 17.69 ± 0.27 a | 13.94 ± 0.25 a | 11.52 ± 0.15 a | 7.7 ± 0.1 a | 3.95 ± 0.05 a | 171.24 ± 4.16 a | 9.375 ± 0.273 a | 0.900 ± 0.030 a |
zⅠ: cotyledon stage; Ⅱ: true leaf stage; Ⅲ: before or after grafting; Ⅳ: after grafting; and Ⅴ: shipping stage.
Graphical tracking of seedlings and grading of seedling quality
The graphical tracking system revealed distinct growth trajectories for eight key parameters across 49 d from sowing to shipping (Fig. 4). Plant height increased from approximately 3 cm at the cotyledon stage to 18 cm at shipping, with the grafted seedlings initially showing intermediate values between scion and rootstock before surpassing both parent genotypes after day 35. Leaf number followed a sigmoid pattern, remaining at zero during the cotyledon stage and then increasing rapidly to reach the eight-leaf stage by the shipping stage. Leaf dimensions showed parallel development patterns, with leaf width expanding from 0 to 12 cm and leaf length from 0 to 14 cm. Both parameters demonstrated similar trajectories, with rootstock initially outperforming scion until grafting, followed by synchronized growth in grafted plants. Stem diameter exhibited a linear progression from 0.8 to 4.0 mm across all genotypes, with rootstock maintaining slightly larger diameters throughout development. The most drastic changes occurred in the leaf area and shoot biomass. The leaf area remained below 50 cm2 until day 35 and then increased exponentially to reach 171 cm2 by shipping. Similarly, the shoot fresh weight exhibited minimal accumulation (< 3 g) until post-grafting, followed by a rapid increase to 9.4 g, whereas the shoot dry weight reached 0.9 g. These parameters clearly illustrate the grafting effect, with temporary growth suppression at day 25 followed by accelerated development exceeding both parent genotypes (Runkle 2007).
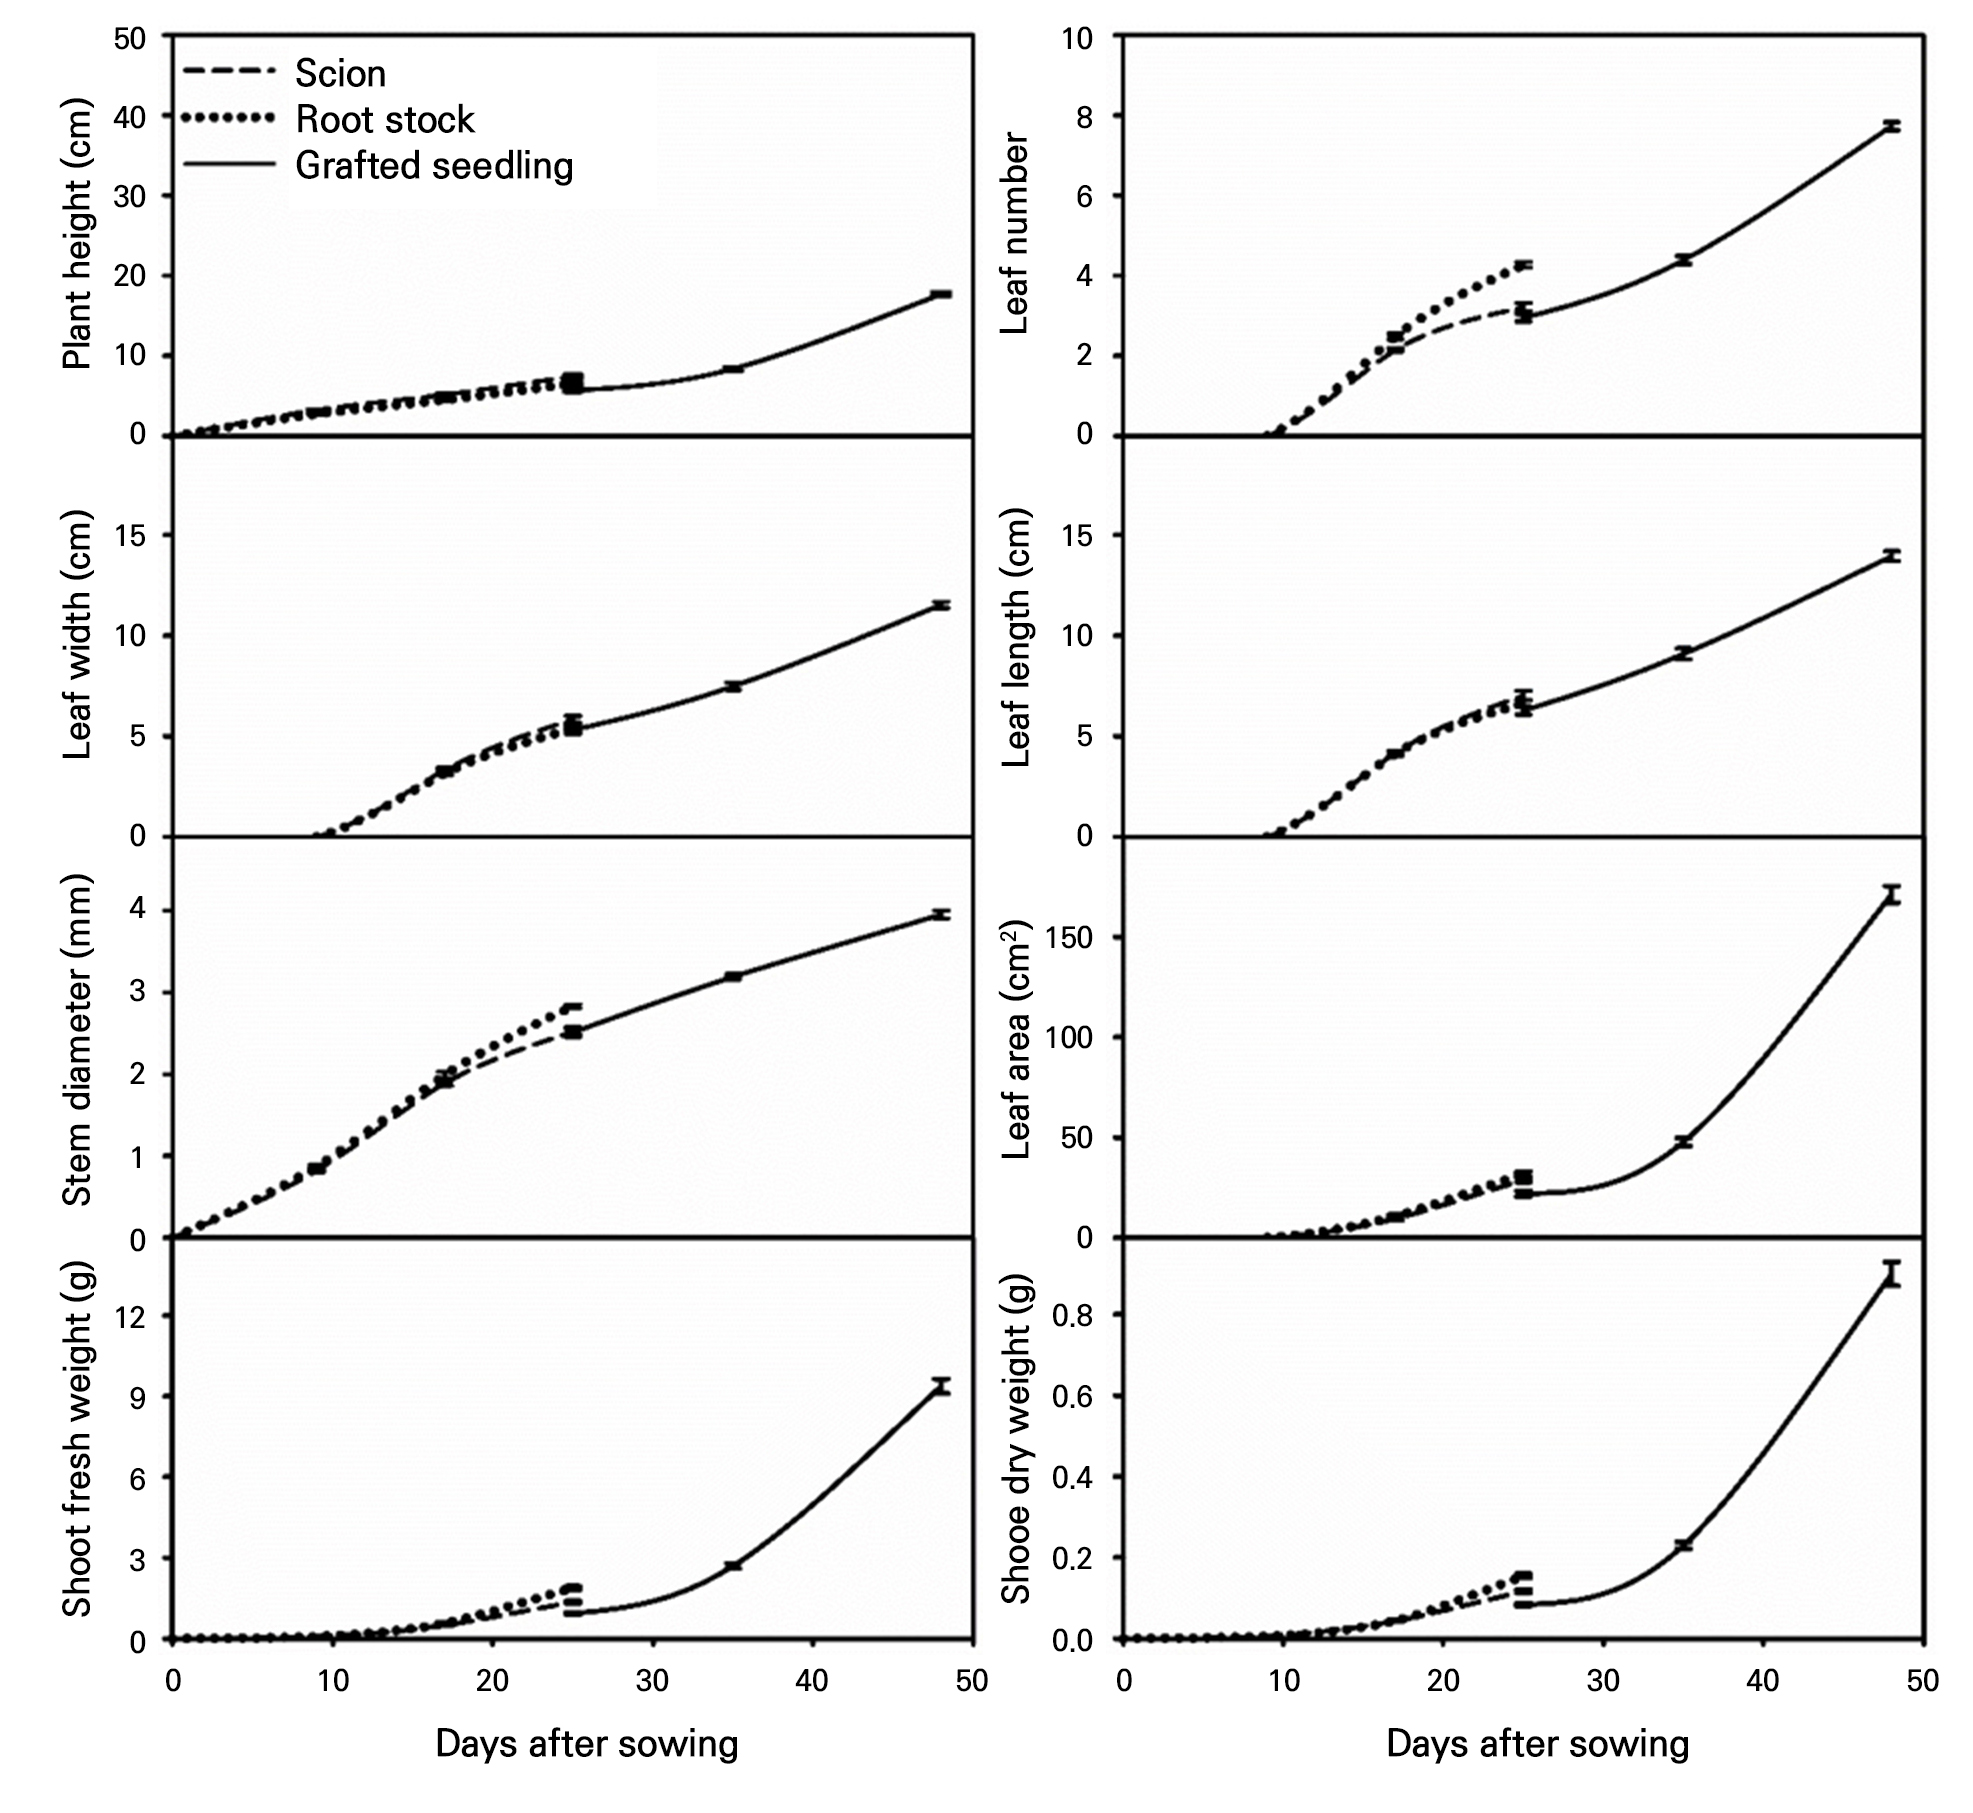
Fig. 4.
Standard growth trajectories illustrating the dynamic development of grafted tomato seedlings from sowing to shipping. These curves visualize the continuous changes in key growth parameters over 49 days, serving as a visual tool that complements the quantitative benchmarks provided in the tables to track development. Experiments were conducted in 2022, 2023, and 2024 with 15, 40, and 20 replications, respectively, for each year. The error bars represent the standard errors of 75 replicates.
A five‐point quality grading system was developed to quantitatively assess seedling quality (Table 5). The mean (Average) and standard deviation (SD) of each parameter were calculated for the population of seedlings at a given developmental stage. Seedlings with values within ±0.5 SD of the mean were assigned a score of 5 (excellent quality). Values between ±0.5 and ±1.5 SD were scored as 3 (moderate quality), and values between ±1.5 and ±2.5 SD were scored as 1 (poor quality). Seedlings with measurements exceeding ±2.5 SD were considered outliers and excluded from further analysis. The overall seedling quality grade was calculated as the average of the individual parameter scores across seven growth traits.
Table 5.
Arbitrary scoring system for the grading of tomato seedlings
| Scorez | Range | ||||
| Lower bound value | Standard reference value | Higher bound value | |||
| 1 | Average + 3/2*SD | ≤ | Average + 4/2*SD | ≤ | Average + 5/2*SD |
| 3 | Average + 1/2*SD | ≤ | Average + 2/2*SD | ≤ | Average + 3/2*SD |
| 5 | Average–1/2*SD | ≤ | Average | ≤ | Average + 1/2*SD |
| 3 | Average–3/2*SD | ≤ | Average–2/2*SD | ≤ | Average–1/2*SD |
| 1 | Average–5/2*SD | ≤ | Average–4/2*SD | ≤ | Average–3/2*SD |
Discussion
Our comprehensive analysis of grafted tomato seedling development provides quantitative insights into growth dynamics under controlled nursery conditions, with direct implications for commercial production. The integration of both linear and exponential regression analyses with accumulated light integral (LI) and growing degree days (GDD) enabled us to identify distinct growth-environment relationships that would have been overlooked using a single model type. The decision to apply both models was based on the physiological rationale that some growth processes proceed at a relatively constant rate (linear) while others accelerate as environmental resources accumulate (exponential). This dual-model approach is consistent with previous studies involving controlled horticultural environments, where plant responses to cumulative environmental factors showed variable patterns depending on the trait examined (e.g., Kitaya et al. 1998; Kahlen and Stützel 2011; Runkle 2006).
The strong correlations observed between LI and several key growth parameters, in this case the leaf number (R2 > 0.84), stem diameter (R2 > 0.84), and biomass (R2 ≈ 0.85), provide a robust quantitative basis for predicting and managing seedling development. For plant height, the more linear relationship with LI (R2 = 0.7185) contrasts with the stronger exponential fit with GDD (R2 = 0.8268), suggesting that vertical growth is thermally accelerated but progresses more steadily as light levels increase. This interpretation is supported by the distinct phytohormonal regulation pathways for stem elongation in response to light and temperature, as reported by Lee et al. (2012) and Shibaeva et al. (2022).
Leaf development parameters displayed variable responses, reflecting the complex interplay of morphogenetic and photosynthetic factors. Leaf length exhibited high sensitivity to both temperature (exponential R2 = 0.8111) and light (linear R2 = 0.7362), whereas leaf width responded more linearly to LI (R2 = 0.8694). Such trait-specific differences suggest that leaf length and width may be regulated by partially independent physiological processes, as also noted in other nursery crop studies (Heuvelink 1995; Niu et al. 2015). The stronger exponential fit for leaf area with both LI and GDD highlights the multiplicative effect of length and width on the total photosynthetic surface.
Biomass accumulation showed consistently stronger exponential relationships with both GDD and LI, indicating accelerated growth as environmental resources accumulate. For example, shoot fresh weight had an exponential R2 of 0.8490 with LI and 0.6982 with GDD, compared with substantially lower linear R2 values. This pattern aligns with the theoretical expectation that biomass production in photosynthetically active plants involves positive feedback loops between leaf expansion, carbon assimilation, and resource allocation (Runkle 2006; Marcelis and Heuvelink 2007).
Seasonal variation between spring and autumn production cycles, despite similar developmental patterns, underscores the importance of integrating seasonal light and temperature profiles into nursery scheduling. The 18% reduction in biomass and leaf area in autumn is likely attributable to reduced daily LI and shorter photoperiods, a factor previously identified as critically affecting nursery crop performance (Gent 2007).
Methodologically, the use of five clearly defined developmental stages allowed for precise temporal mapping of environmental effects, revealing that the post-grafting to shipping period (Stages Ⅳ to Ⅴ) is particularly critical, with a 2.1-fold increase in height and a 3.6-fold increase in leaf area within 14 days. This finding reinforces the need for targeted management practices during this phase to ensure optimal seedling quality.
The graphical tracking and quantitative grading systems developed in this study offer nursery managers a predictive tool for detecting deviations from expected growth trajectories. By establishing benchmark growth curves for seven parameters, it becomes possible to intervene promptly to correct suboptimal conditions. Consistent with previous grafting research, rootstock genotypes outperformed scions in terms of early vegetative traits, providing a stronger foundation for subsequent scion growth (Lee et al. 2010). The observed growth dip immediately after grafting, followed by the rapid recovery and surpassing of both parental growth rates, exemplifies the grafting responses reported in multiple horticultural crops.
In conclusion, linking environmental indices to growth parameters through both linear and exponential models provides a nuanced understanding of grafted tomato seedling development. This methodological framework—supported by comparable studies in controlled environments—offers a scientifically robust and practically applicable basis for predictive modeling in nursery operations. By tailoring management strategies to the distinct environmental sensitivities of each growth parameter, nursery production efficiency and seedling quality can be significantly enhanced.
Conclusion
In this study, we successfully established comprehensive growth standards and objective quality assessment methods for producing grafted tomato seedlings through a systematic analysis of developmental patterns across multiple seasons. The quantitative characterization of growth parameters at five distinct developmental stages provides reliable benchmarks for commercial nursery operations, addressing the crucial need for standardized evaluation criteria in the rapidly expanding industry of grafted vegetable transplants. These proposed growth standards and quality evaluation methods offer nursery managers clear, quantifiable targets for each developmental stage, enabling the consistent production of high-quality seedlings and facilitating industry-wide adoption of standardized practices. The graphical tracking system developed in this research enables real-time monitoring of seedling development against established standards, facilitating proactive management decisions for environmental adjustments. The novel five-point quality grading system represents a marked advancement in objective seedling assessment, replacing subjective evaluations with quantifiable metrics based on the degree of statistical deviation from optimal growth parameters. Seasonal variations identified between spring and autumn production cycles highlight the importance of season-specific standards for maintaining consistent quality. The superiority of spring production growth parameters suggests optimal timing for commercial operations, whereas the successful establishment of autumn standards enables year-round production planning. Future research must focus on expanding these standards across multiple commercial nurseries to account for regional variations and diverse production systems. Integrating additional quality parameters based on feedback from growers, the development of automated tracking software, and correlation studies between seedling grades and field performance would further enhance the practical application of these standards. The methodologies and standards established in this study provide a foundation for advancing the production of grafted tomato transplants toward greater efficiency, consistency, and quality assurance, ultimately supporting the continued growth of sustainable vegetable production systems.
