

Introduction
Materials and Methods
Experimental site and cultivation system
Environmental and energy monitoring
Aeroponic irrigation and nutrient management
Growth stage-based nutrient conditions
Water balance, yield, and WUE calculations
Data analysis
Results
System-level water balance
Environmental conditions, tier microclimate, and energy cost
Water use efficiency
Productivity and yield performance
Vertical system uniformity
Discussion
Introduction
Strawberry (Fragaria × ananassa Duch.) is one of the most economically important horticultural crops because of its high market value and strong consumer demand. However, strawberry production is often associated with intensive water use and relatively low water use efficiency (WUE), particularly in conventional soil-based systems where water loss occurs through evaporation, percolation, and inefficient irrigation practices (Dsouza et al. 2023; Zebro et al. 2025). Controlled environment agriculture (CEA) provides an opportunity to improve resource-use efficiency by enabling precise control of light, temperature, humidity, and nutrient supply (Dsouza et al. 2023). Recent studies have also demonstrated the potential of data-driven environmental optimization for strawberry cultivation in CEA systems (Lu et al. 2023). LED-based plant factory studies have shown that supplementary blue light can improve strawberry transplant production efficiency, supporting the importance of controlled lighting strategies in strawberry CEA (Lee et al. 2023). Within CEA, vertical farming can improve land-use efficiency through multilayer cultivation while reducing dependence on external weather conditions. Aeroponics is an efficient cultivation method in which roots are suspended in air and intermittently supplied with nutrient solution, reducing drainage losses and improving root-zone aeration (Garzón et al. 2023; Regmi et al. 2024).
Nevertheless, irrigation efficiency alone does not fully explain WUE in CEA systems. At the plant level, WUE is strongly influenced by transpiration, which is regulated by vapor pressure deficit (VPD). Because VPD affects stomatal conductance, it alters both water loss and carbon assimilation (Grossiord et al. 2020). Recent strawberry transpiration modeling based on a simplified Penman–Monteith approach under different irrigation regimes further supports the need to interpret WUE together with irrigation supply and atmospheric demand (Sim et al. 2025). WUE in indoor cultivation should therefore be interpreted as the outcome of interactions among irrigation management, environmental control, and plant physiological responses. Despite the growing interest in vertical farming, most previous studies have focused on leafy vegetables or short production cycles, while studies on fruiting crops and system-level analyses remain relatively limited (Chowdhury et al. 2023; Panotra et al. 2024; Sowmya et al. 2024). Recent work has shown that plant-driven precision irrigation based on real-time turgor sensing can improve water-use performance in aeroponic lettuce, but such approaches have mainly been evaluated in non-fruiting crops rather than fruiting species such as strawberry (Karnoutsos et al. 2025). In addition, vertical production systems often create microclimatic gradients between cultivation layers, leading to differences in light interception, humidity, and airflow that may affect transpiration and productivity. These issues are particularly important in partially recirculating aeroponic systems, where water-saving benefits must be balanced against stable crop performance and water quality management (Ehret et al. 2001; Qureshi et al. 2025). Recent work has shown that UV-C decontamination of recirculating nutrient solution can support vegetable production while helping maintain water hygiene in closed soilless systems (Perez et al. 2024).
The cultivar ‘Seolhyang’ is widely cultivated in Korea, but its performance in a closed aeroponic vertical system has not been sufficiently characterized. The present study was designed as a follow-up to An et al. (2026), which evaluated 0%, 30%, and 50% partial recirculation in the same two-tier indoor aeroponic strawberry platform and identified 30% recirculation as a practical threshold for maintaining yield while reducing fresh-input demand. Therefore, this study aimed to quantify water balance and WUE using explicit denominators (supplied water and net consumption) and to relate these values to tier-level yield, air VPD, CO2 stability, measured canopy PPFD, and electricity cost during a 180-day crop cycle.
Materials and Methods
Experimental site and cultivation system
Table 1 summarizes the experimental setup and operating conditions used in this study. Strawberry plants (Fragaria × ananassa Duch. cv. ‘Seolhyang’) were transplanted and cultivated in 2024 for 180 days, covering establishment, vegetative growth, flowering, and fruiting stages. The cultivation frame consisted of two vertically stacked beds, with the lower bed installed at 0.6 m above the floor and the upper bed at 1.5 m, resulting in an inter-tier distance of 0.9 m. A total of 500 plants were grown at a density of 20 plants·m‒2 in a 25 m2 cultivation area. Lighting was controlled using a target PPFD of 300 µmol·m‒2·s‒1; however, direct measurements at the strawberry canopy indicated an average measured PPFD of approximately 280 µmol·m‒2·s‒1 in both upper and lower tiers. The measured value was reported as a representative canopy-level mean because small output differences among individual lighting modules and local sensor positions made a single-point value unsuitable. Environmental conditions also included a 16-h photoperiod, day/night temperatures of 22/18°C, and 60–70% relative humidity. The principal system specifications, including target and measured PPFD, are summarized in Fig. 1 and Table 1.
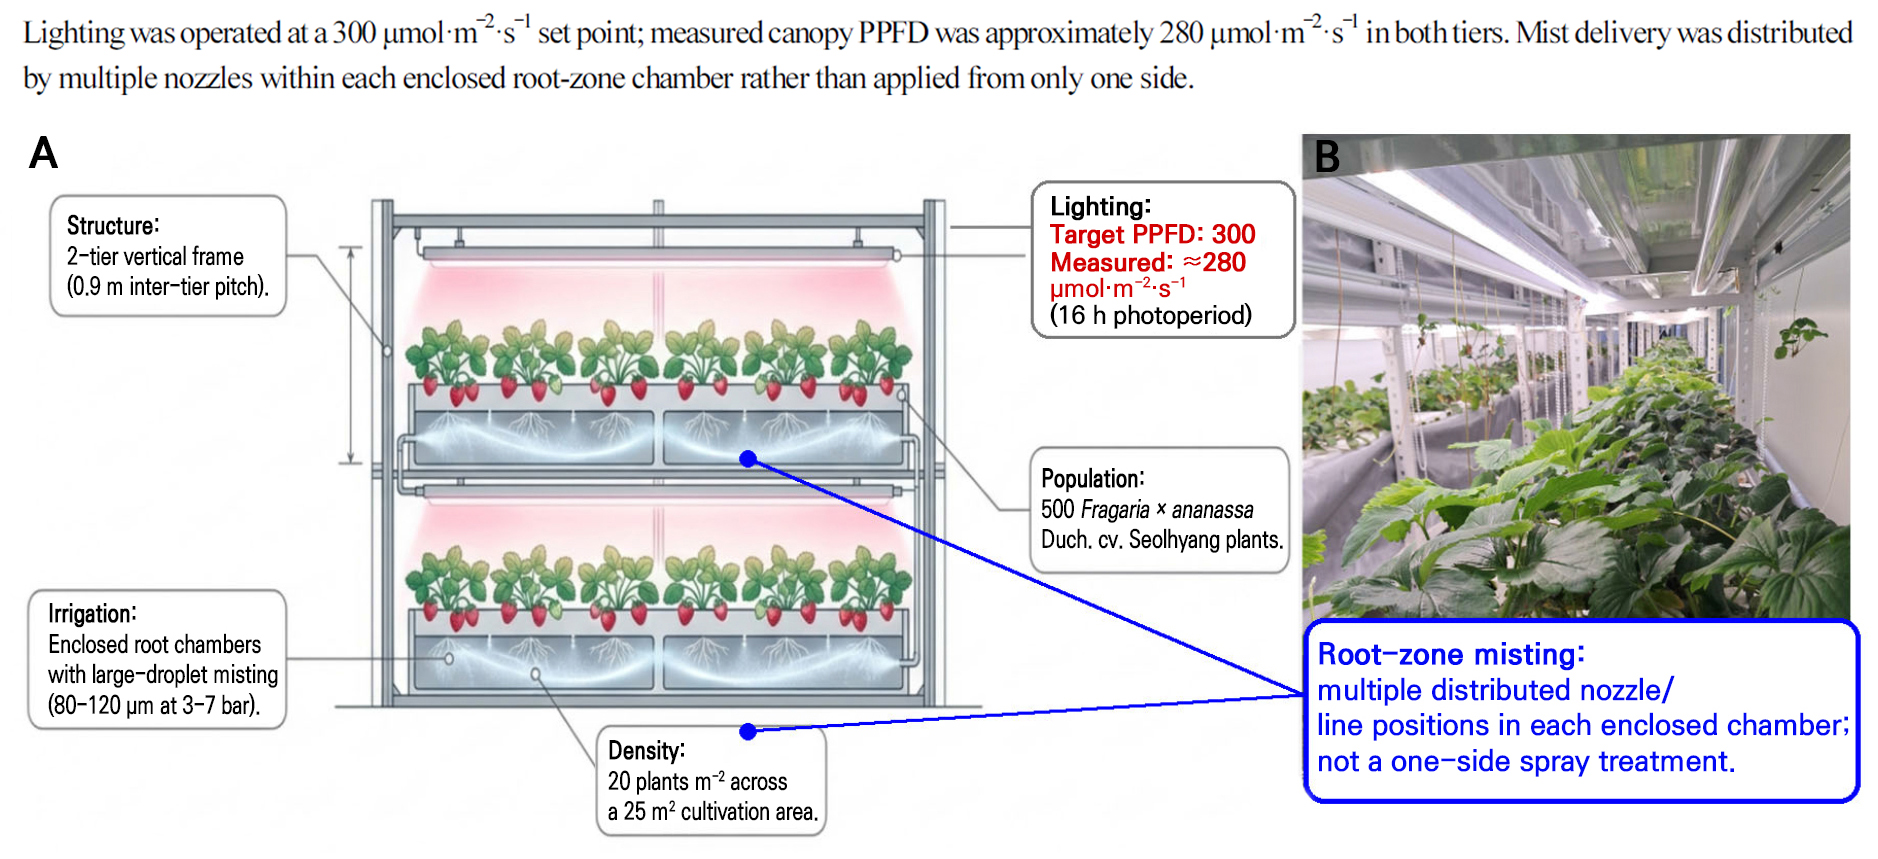
Table 1.
Experimental conditions and system configuration
| Parameter | Value |
| Experimental site | SW University, Seoul, Korea |
| System type | Closed two-tier aeroponic vertical farming system |
| Number of plants | 500 |
| Planting density | 20 plants·m‒2 |
| Cultivation area | 25 m2 |
| Cultivation period | 180 days |
| Target PPFD (lighting set point) | 300 µmol·m‒2·s‒1 |
| Measured PPFD at strawberry position | ≈280 µmol·m‒2·s‒1 in both tiers; canopy-level mean. |
| Photoperiod | 16 h·d‒1 |
| Temperature (day/night) | 22/18°C |
| Relative humidity | 60–70% |
| Droplet size | 80–120 µm (3–7 bar; approximately 45–100 psi) |
| Recirculation rate | 30.0% recovered and reused (16.2/54.0 m3) |
| Sterilization | UV-C (254 nm, 640 W) |
| CO2 concentration | 400 ± 50 ppm (monitored setpoint range) |
| Microclimate and PPFD measurements | Tier-level temperature/RH/air VPD; canopy PPFD at strawberry positions. |
| Transplant material | One screened ‘Seolhyang’ lot; flower-bud stage not assessed at transplanting. |
| Routine crop management | Visual scouting, senescent leaf/runner removal, and harvest at commercial ripeness; no layer-specific management. |
| Recirculated nutrient-solution management | UV-C-treated recovered solution was blended into the reservoir; final EC/pH followed Table 2 targets. |
At transplanting, a single commercial ‘Seolhyang’ transplant lot was used. Plants were visually screened for uniform vigor and allocated to the upper and lower tiers to minimize visible initial differences. Crown diameter, leaf number, and flower-bud differentiation stage were not destructively assessed at transplanting; therefore, potential initial physiological non-uniformity among seedlings cannot be completely excluded.
Environmental and energy monitoring
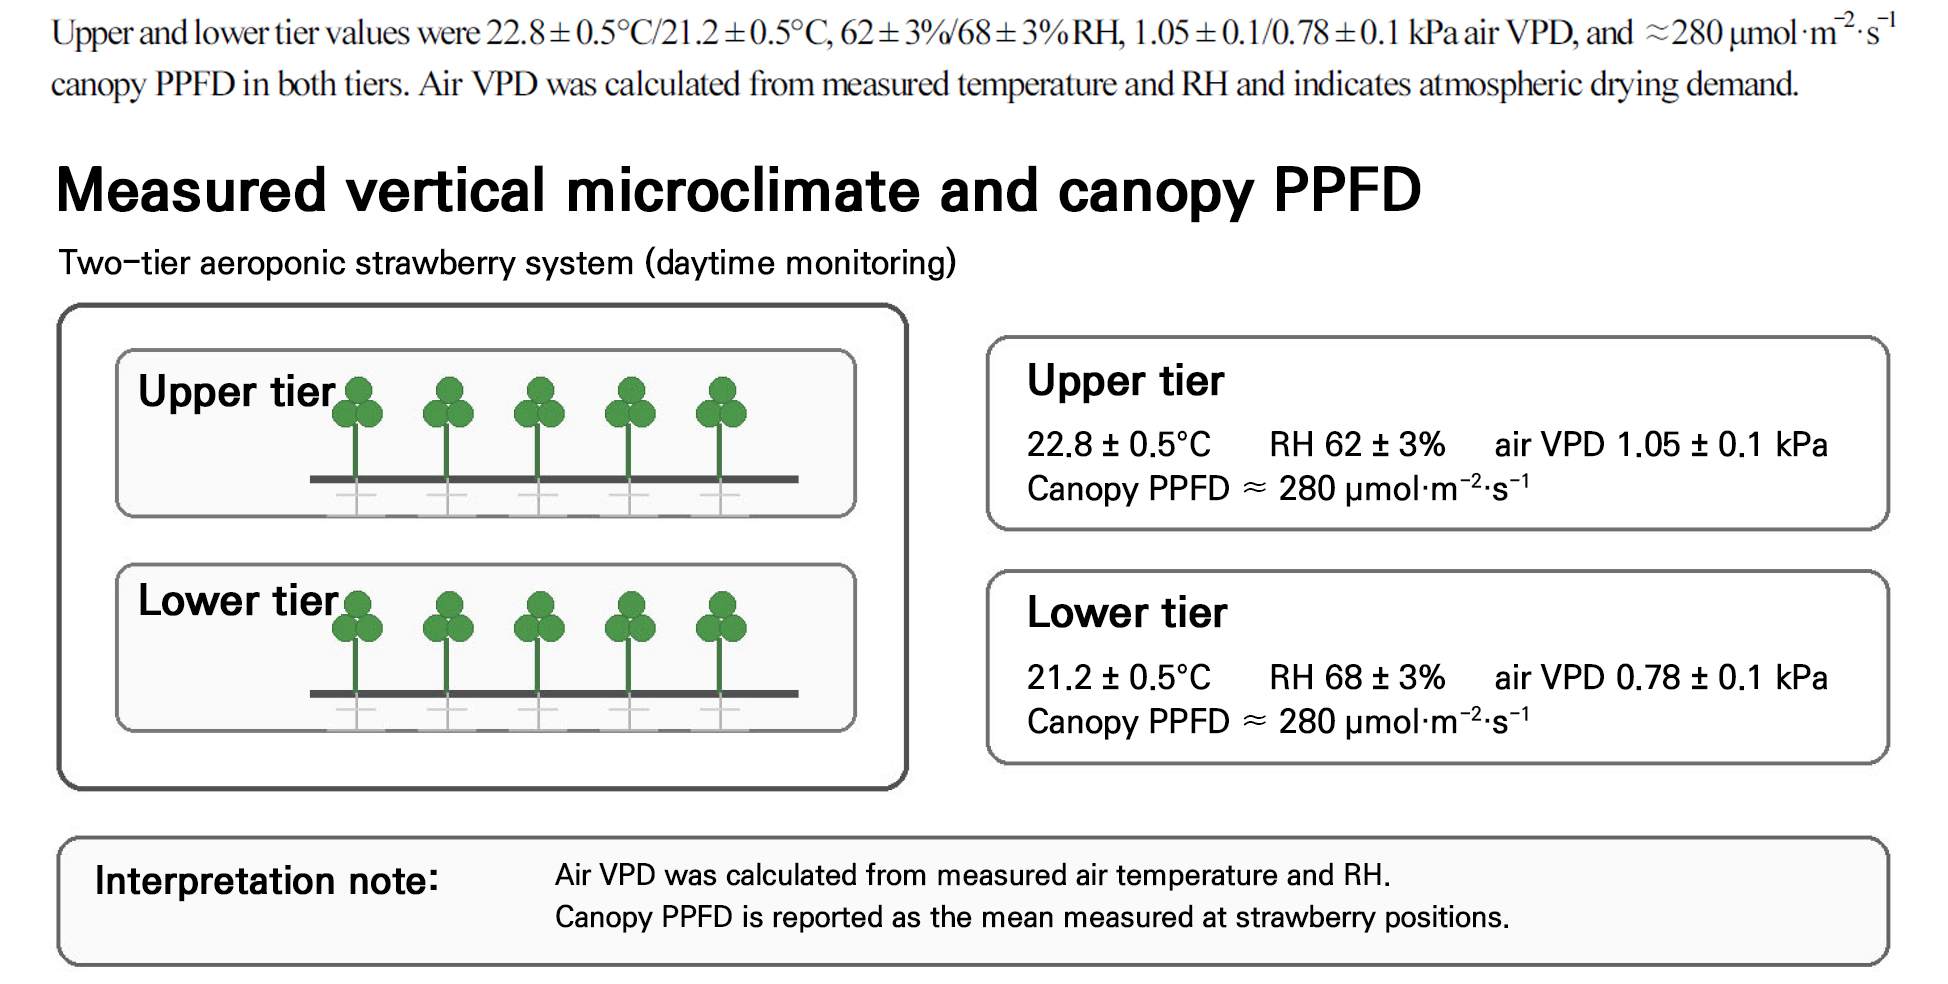
CO2 concentration in the cultivation space was monitored and maintained at 400 ± 50 ppm. Daytime microclimate was monitored separately for the upper and lower tiers, and air VPD was calculated from measured temperature and RH. The upper tier averaged 22.8 ± 0.5°C, 62 ± 3% RH, and 1.05 ± 0.1 kPa air VPD, whereas the lower tier averaged 21.2 ± 0.5°C, 68 ± 3% RH, and 0.78 ± 0.1 kPa air VPD; the whole-system daytime average was 22.0°C, 65.0% RH, and 0.92 kPa air VPD. For lighting validation, the target PPFD was 300 µmol·m‒2·s‒1, while measured PPFD at strawberry positions averaged approximately 280 µmol·m‒2·s‒1 in both tiers. Measured PPFD is reported as a canopy-level mean and was not used as a separate tier-level light treatment. Table 3 shows that electrical energy use was recorded as monthly electricity billing data ; however, there costs may be somewhat overestimated because the billing records included electricity use associated with other system operation expenses.
Aeroponic irrigation and nutrient management
The aeroponic system operated using large-droplet misting (80–120 µm), as droplet size and spray interval have been shown to influence root-zone conditions, plant growth, and physiological responses in aeroponic systems (Tunio et al. 2022). A baseline cycle of 3–10 s ON and 3–10 min OFF was adjusted according to plant developmental stage.
During establishment, more frequent misting (5–10 s ON / 3–5 min OFF) was applied to promote root acclimation. During vegetative growth, the OFF interval was extended (3–5 s ON / 5–8 min OFF) to improve root aeration. During flowering and fruiting, moderate intervals (3–5 s ON / 4–6 min OFF) were used to minimize water stress while supporting fruit development and fruit quality.
Routine crop management during the cultivation period consisted of regular visual scouting, removal of senescent leaves and runners when observed, and harvesting of marketable fruit at commercial ripeness. No layer-specific pruning, thinning, runner removal, or fruit-load adjustment treatment was intentionally applied; therefore, management practices were not used as a layer treatment.
A nutrient solution based on the standard Korean hydroponic formulation for ‘Seolhyang’ strawberry was supplied and replenished as needed to maintain chemical stability. The nutrient solution contained N–P–K at 150–40–200 mg·L‒1, with Ca and Mg supplied at 120 and 40 mg·L‒1, respectively, and micronutrients provided according to standard recommendations for greenhouse strawberry production (Zebro et al. 2025). Although the system was designed to distribute equal volumes to both tiers, the upper tier received 48.5% of the total supplied water and the lower tier received 51.5%, likely because of minor hydraulic differences, nozzle positioning, and gravitational effects. Tier-level distribution values were based on controller settings and flow checks; routine operation indicated a water-delivery variation of approximately ±5–7% between supply events, so small upper–lower differences were interpreted cautiously.
For the reused fraction, EC and pH were not controlled as a separate nutrient recipe. Recovered solution was blended back into the reservoir after UV-C treatment, and the mixed supply solution was adjusted to the same stage-specific EC and pH ranges shown in Table 2. Thus, the EC and pH reported in Table 2 represent the final supplied solution after blending fresh and recovered nutrient solution.
Table 2.
Growth stage-based nutrient conditions
The recirculation fraction was defined as recovered-and-reused volume divided by total supplied volume. In this system, 16.2 m3 of 54.0 m3 was recovered after drainage collection, UV-C treated in the return loop, blended into the reservoir, and reused, giving a 30.0% recirculation fraction. This fraction was selected to reduce water loss while limiting EC drift and hygiene risk in the pilot-scale loop. The return flow was operated continuously rather than as a separately stored batch.
Growth stage-based nutrient conditions
Electrical conductivity (EC) and pH of the nutrient solution were adjusted according to crop developmental stage (Table 2). Higher EC was maintained during the fruiting stage to meet increased nutrient demand.
Water balance, yield, and WUE calculations
Water input was monitored continuously using inline flow meters installed in the irrigation system. Water balance was evaluated on a system basis using three variables: total water supplied, recirculated water volume, and net water consumption. Approximately 30% of the supplied nutrient solution was recovered and reused after ultraviolet sterilization (254 nm, 640 W).
Fruit yield was recorded at each harvest and summarized monthly for each cultivation tier from 120 to 180 days. Water use efficiency was calculated as:
WUE = Y / W,
where Y is the total fruit yield (kg) and W is the total water supplied (m3). In addition to whole-system WUE, tier-specific WUE was calculated by dividing cumulative yield in each tier by the corresponding tier water input.
Stage-level WUE was defined as monthly fruit yield (kg) divided by monthly system-level water input (m3) for the month assigned to each dominant crop stage. During the first 60 days after transplanting, marketable fruit yield was zero or negligible, so monthly water input is reported mainly to show the timing of crop water demand. From that point until the end of the experiment, the metric represents crop-system fruit WUE and does not partition water used by fruit organs from water used for transpiration, canopy maintenance, or root-zone wetting.
Vapor pressure deficit (VPD) was estimated from the measured air temperature and relative humidity using a standard psychrometric approach:
VPD = es × (1 − RH/100),
where es is the saturation vapor pressure at air temperature T. The saturation vapor pressure was calculated as:
es = 0.6108 × exp[17.27T/(T + 237.3)],
where T is in °C and VPD is expressed in kPa.
The VPD used in this study represents air VPD calculated from tier-level air temperature and RH. It describes atmospheric drying demand within each tier and is not interpreted as direct evidence of leaf-level gas exchange or transpiration response.
Data analysis
Data were summarized as system-level totals, monthly totals, tier-wise comparisons, measured daytime microclimate means, and target/measured PPFD values. Pearson correlation coefficients and simple linear regression between monthly water input and monthly fruit yield were calculated as exploratory diagnostics. Inferential tests for tier or treatment effects were not performed because the dataset consisted of one system-level time series with six monthly observations and three fruiting months; therefore, no error bars are presented. Initial flower-bud differentiation was not independently assessed, so tier-wise yield shifts may reflect both measured microclimate and seedling-origin variation.
Results
System-level water balance
During the 180-day cultivation period, total water input was 54.0 m3, equivalent to 108 L·plant‒1 for the 500 plants in the system. Of this volume, 16.2 m3 (30%) was recirculated after ultraviolet sterilization, resulting in a net water consumption of 37.8 m3 or 75.6 L·plant‒1. Based on net water consumption, the system required approximately 168 L of water to produce 1 kg of fruit.
The recovered-and-reused volume equals 16.2 m3, or 30.0% of the total supplied volume. This fraction was UV-C treated within the return loop and blended into the reservoir; final reservoir EC and pH were then adjusted to the stage-specific targets before supply.
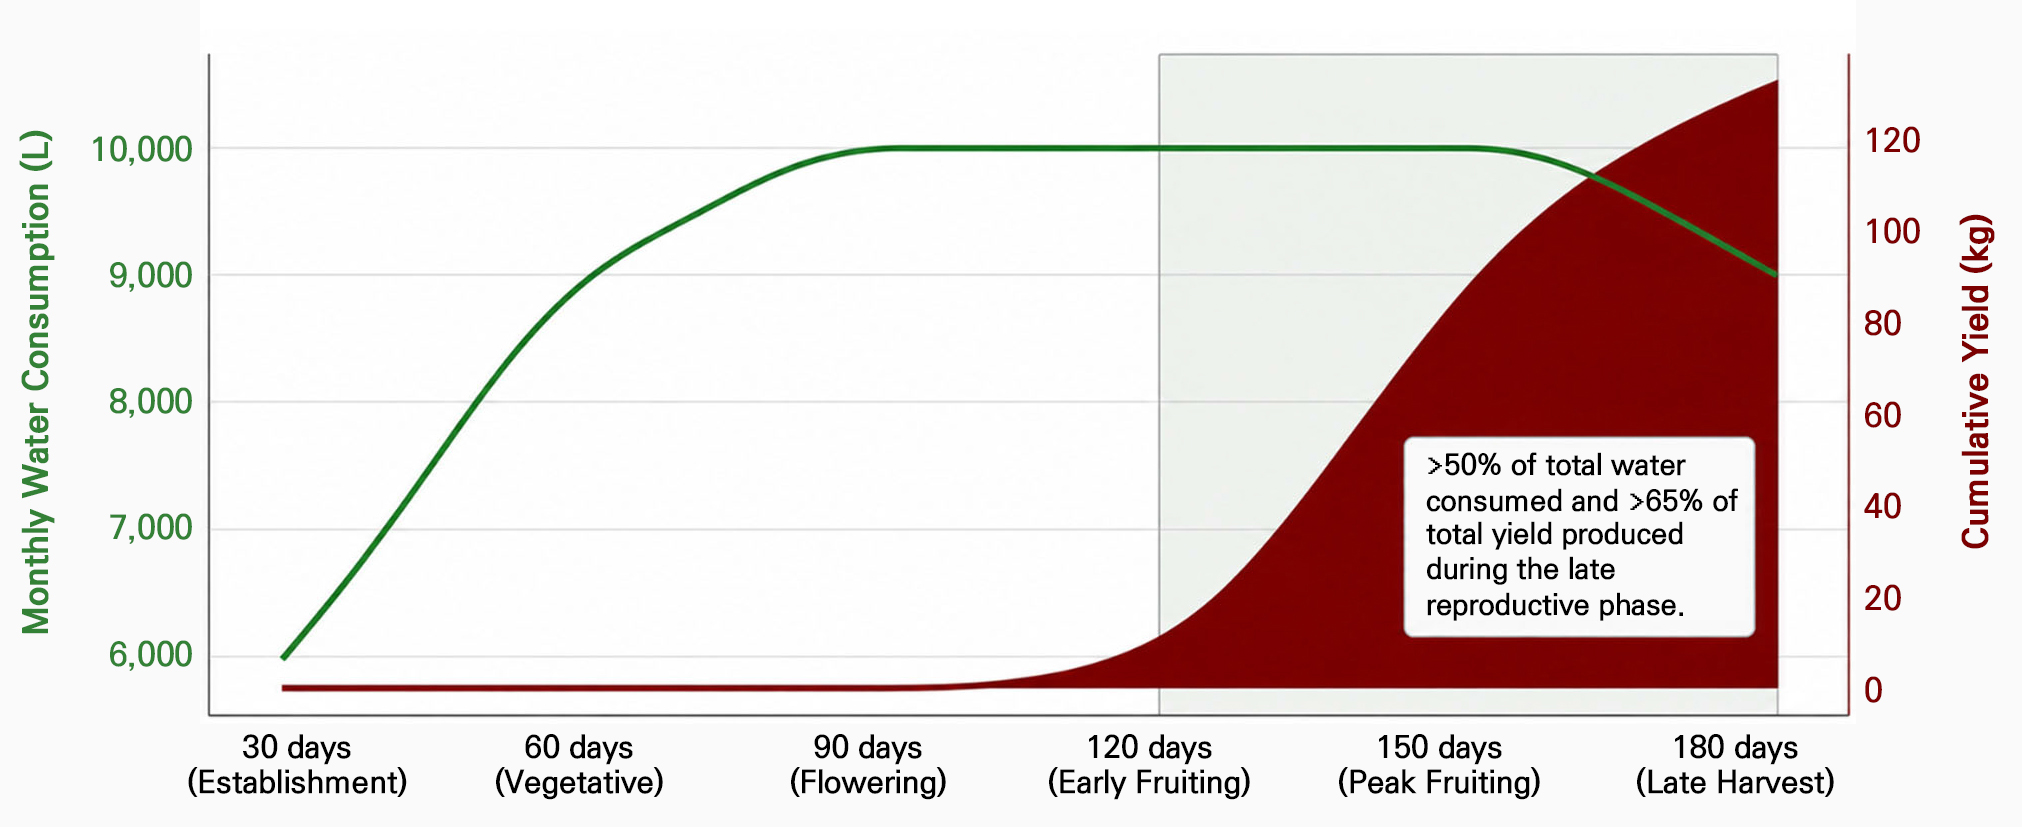
Monthly water use increased from 6,000 L during establishment to 9,000 L during vegetative growth and reached 10,000 L during flowering and fruiting before declining slightly to 9,000 L during late harvest (Table 3 and Fig. 2). More than 50% of the total water input was consumed during the reproductive period, indicating that system-level water demand was closely associated with canopy development and fruit production.
Table 3.
Monthly water use, tier distribution, and electricity cost
Electricity cost represents monthly billing data rather than direct kWh-metered energy consumption; however, there costs may be somewhat overestimated because the billing records included electricity use associated with other system operation expenses. Tier distribution values are setting-based estimates, and actual water delivery may vary by approximately ±5–7% during each supply event. The recirculation fraction was defined as recovered-and-reused volume divided by total supplied volume (16.2/54.0 m3 = 30.0%).
Water distribution between tiers was slightly uneven throughout cultivation. Of the total water supplied, 26.19 m3 was delivered to the upper tier and 27.81 m3 to the lower tier (Table 3). This 1.62 m3 difference corresponded to approximately 6% of the mean tier input and was within the estimated ±5–7% water-delivery variation of the system; therefore, it was not considered sufficient by itself to explain tier productivity differences.
Environmental conditions, tier microclimate, and energy cost
CO2 was maintained at 400 ± 50 ppm throughout the cultivation period. The mean monthly electricity cost over the 180-day, experimental period was 642,500 KRW·month‒1 (Table 3). Because electricity use was available only as billing data and may have included electricity consumption for purposes other than the experimental cultivation system, the reported energy cost may be somewhat overestimated. Therefore, these values should be interpreted mainly as operational cost data showing the overall monthly trend in electricity costs, rather than as direct energy consumption in kWh for the crop production system alone.
Measured daytime microclimate differed between tiers (Table 4 and Fig. 3). The upper tier was 1.6°C warmer than the lower tier (22.8 ± 0.5 vs 21.2 ± 0.5°C), had lower RH (62 ± 3 vs 68 ± 3%), and showed a higher air VPD (1.05 ± 0.1 vs 0.78 ± 0.1 kPa). The 0.27 kPa VPD difference indicates greater atmospheric drying demand in the upper tier, whereas the lower tier maintained a cooler and more humid microenvironment. The lighting set point was 300 µmol·m‒2·s‒1 and measured canopy PPFD was approximately 280 µmol·m‒2·s‒1 in both tiers; PPFD is therefore reported as both a set point and a canopy-level measured value.
Table 4.
Daytime tier-specific PPFD and microclimate conditions in the two-tier aeroponic strawberry system
Values are summarized from daytime tier-level monitoring. The ± values represent the reported monitoring variation for each layer; system-average values are shown without variation terms. PPFD values are canopy-level means measured at strawberry positions and are reported alongside the 300 µmol·m‒2·s‒1 lighting set point.
Water use efficiency
The system produced 225 kg of fruit during the cultivation period, corresponding to an overall WUE of 4.17 kg·m‒3 when calculated on the basis of total water supplied (Table 5). On a net water consumption basis, this corresponded to approximately 5.95 kg·m‒3, or 168 L of water per kg of fruit produced.
Table 5.
Tier-wise yield distribution and water use efficiency during the fruiting period
Tier-specific WUE values were 4.32 kg·m‒3 in the upper tier and 4.03 kg·m‒3 in the lower tier, a 0.29 kg·m‒3 difference (approximately 7% relative to the mean tier WUE). This difference was comparable to the ±5–7% water-delivery variation and occurred with a measured air VPD difference of 0.27 kPa; therefore, the tier WUE values indicate modest quantitative separation rather than a strong layer response.
The relationship between water use and production changed over time. During early growth, water inputs mainly supported canopy and root establishment and produced little or no marketable yield. From day 120 until the end of the experiment, monthly yield per supplied water increased as fruit production became the dominant output. In this manuscript, ‘stage-level WUE’ denotes monthly fruit yield divided by monthly system water input; it is a crop-system metric, not organ-specific water-use efficiency.
Exploratory correlation analysis across the six monthly observations showed a non-significant relationship between monthly water input and monthly fruit yield (r = 0.42, P = 0.406; R2 = 0.18). When only the three fruiting months were considered, the relationship was negligible (r = −0.12, n = 3). These results indicate that water input alone did not explain monthly productivity and that crop stage and operational conditions were more relevant drivers of stage-level system WUE.
Productivity and yield performance
The cultivation system produced 225 kg of fruit over a 25 m2 cultivation area, corresponding to a productivity of 9.0 kg·m‒2 over the 180-day cultivation period (18.3 kg·m‒2·yr‒1 on an annualized basis) and an average yield of 0.45 kg·plant‒1. More than 65% of the total fruit yield was obtained after 120 days from transplanting, showing that production was concentrated in the late reproductive phase.
Yield distribution varied temporally between vertical layers. During early fruiting, the lower tier produced 27.0 kg, compared with 18.0 kg in the upper tier. In December, yields between tiers were nearly identical (51.25 and 50.00 kg in the upper and lower tiers, respectively). At the third harvest, the upper tier became dominant, producing 43.8 kg compared with 35.0 kg in the lower tier (Table 5).
Although dominance shifted between layers over time, cumulative yield remained nearly balanced between tiers, with 113.04 kg in the upper tier and 111.97 kg in the lower tier. These results indicate that temporal dynamics, rather than sustained superiority of one layer, accounted for most of the observed vertical variation in productivity.
Vertical system uniformity
The near-equal cumulative yield of the two tiers (113.04 kg upper vs 111.97 kg lower) indicates acceptable whole-system vertical balance. However, dominance shifted from the lower tier at day 120 to the upper tier by the end of cultivation, showing that vertical uniformity changed over the fruiting period.
Measured microclimate data provide quantitative context for this shift: the upper tier was warmer and drier (22.8°C, 62% RH, air VPD 1.05 kPa) than the lower tier (21.2°C, 68% RH, air VPD 0.78 kPa), while canopy PPFD was ≈280 µmol·m‒2·s‒1 in both tiers. Because cumulative WUE differed only modestly (4.32 vs 4.03 kg·m‒3), the temporal yield shift is best treated as a system-level observation rather than a confirmed layer effect.
Discussion
The present study demonstrates that WUE in indoor aeroponic strawberry production is a dynamic system property rather than a fixed irrigation metric. More than 50% of supplied water and more than 65% of fruit yield occurred during the reproductive period, indicating that system performance depended on synchronizing irrigation supply with fruiting-stage demand. This interpretation is consistent with previous studies indicating that water productivity in controlled environments is influenced by both system design and plant physiological responses (Carotti et al. 2023; Dsouza et al. 2023). The measured air VPD gradient (1.05 ± 0.1 kPa upper vs 0.78 ± 0.1 kPa lower) provides a quantitative basis for interpreting vertical differences in atmospheric drying demand (Grossiord et al. 2020).
Air VPD was calculated from air temperature and RH and should be interpreted as atmospheric drying demand only; leaf-level gas exchange, photosynthesis, and transpiration were not directly measured.
Tier-wise productivity was nearly balanced despite the microclimate gradient. The upper and lower tiers differed by 0.27 kPa in air VPD, 1.62 m3 in supplied water, 1.07 kg in cumulative yield, and 0.29 kg·m‒3 in WUE. These magnitudes suggest that vertical microclimate may have contributed to monthly yield shifts, but cumulative productivity separation remained small. Similar spatial variability and environmental gradients have been reported as important factors influencing crop performance in vertical and controlled environment systems (Garzón et al. 2023; Sowmya et al. 2024).
The main design limitation was the use of one pilot-scale cultivation unit, which prevents formal treatment-level inference. Other constraints can be grouped into three categories: environmental sensing was based on canopy-mean PPFD and air VPD, energy use was recorded as billing cost rather than kWh, and physiological/nutrient diagnostics were limited. Future work should test the same water-balance framework in replicated vertical units with multi-point PPFD mapping, direct energy metering, continuous EC/pH monitoring before and after UV-C treatment, root-zone oxygen sensing, and multiple strawberry cultivars.
Despite these limitations, this study provides a practical framework for evaluating water productivity in indoor fruit production. By integrating total supplied water, recovered-and-reused water, net consumption, tier-wise yield, CO2 control, electricity cost, measured tier-level microclimate, and canopy PPFD, the results identify measurable targets for improving closed aeroponic strawberry systems. Priority improvements are stage-specific irrigation, more uniform water delivery, multi-point light validation, and physiological monitoring linked to fruiting-stage demand.
