

Introduction
Materials and Methods
Plant materials and image acquisition
Dataset construction
AI-based classification model and performance evaluation
Fruit quality measurements
Statistical analysis
Results and Discussion
External appearance and chromaticity differences between marketable and immature mini pumpkins
Performance of the AI-based classification model
Differences in fruit size and morphological characteristics
Internal quality characteristics of marketable and immature mini pumpkins
Relationship between external and internal fruit quality traits
Conclusion
Introduction
The mini pumpkin (Cucurbita maxima × Cucurbita moschata) is becoming more common in fresh produce markets given its small fruit size, high sugar content, and suitability for single-serving consumption (Lee and Park 2025). Given the increase in demand for convenient and high-quality horticultural products, mini pumpkin has emerged as an important crop in vegetable markets. Currently, the harvesting and sorting of mini pumpkins rely heavily on manual labor, with maturity visually determined based on subjective criteria such as rind color and peduncle corking (RDA 2023). Moreover, due to labor constraints, fruits are often harvested simultaneously, resulting in a mixture of mature and immature fruits (Ma et al. 2024). This conventional approach is highly labor-intensive and often leads to inconsistent fruit quality outcomes during distribution due to the lack of objective grading standards (Naranjo-Torres et al. 2020).
Fruit quality is a key factor affecting consumer preference and the market value of horticultural crops (Kader 2008). In commercial production and distribution systems, fruit quality is evaluated based on external characteristics, such as size, color, and shape (Blasco et al. 2003). These visual attributes are commonly used as indicators when grading and sorting fruits in the marketplace. However, such evaluations are often subjective and may not accurately reflect internal quality attributes (Aline et al. 2023). Internal fruit characteristics, such as the soluble solids content (SSC) and firmness, are closely related to fruit maturity and consumer acceptance; however, assessments of these attributes generally require destructive measurements and therefore cannot be directly applied in large-scale fruit sorting systems (El-Mesery et al. 2019). While non-destructive technologies such as near-infrared (NIR) spectroscopy provide accurate internal quality evaluations (Li et al. 2022), their commercial application in real-time sorting is often limited by high equipment costs and slow processing speeds (Walsh et al. 2020).
To address these limitations, previous studies have suggested that external fruit characteristics are associated with the internal quality attributes of various horticultural crops (Pathare et al. 2013; Moreno et al. 2023; Liu et al. 2024). Fruit color, size, and morphological traits have been reported to reflect physiological changes during fruit development and maturation (da Graça et al. 2024). Therefore, identifying reliable relationships between external and internal fruit quality attributes may provide useful indicators for the non-destructive evaluation of fruit maturity and quality.
Recently, artificial intelligence (AI) and deep-learning technologies have been increasingly applied in agricultural production systems for automated fruit grading and classification (Kamilaris and Prenafeta-Boldú 2018). Image-based analysis using AI enables the rapid and objective evaluation of fruit appearance and may provide a practical approach for improving efficiency during the fruit sorting process (Mahendran et al. 2011). In particular, AI-assisted classification based on external fruit characteristics has the potential to support non-destructive quality evaluations of horticultural crops (Lee et al. 2024).
Image-based analysis using AI, particularly computer vision and deep-learning algorithms, provides a practical approach not only for improving fruit sorting efficiency but also for supporting non-destructive quality evaluations of horticultural crops (Chakraborty et al. 2023; Rojas Santelices et al. 2025). Therefore, here the performance of an AI-based classification model for the automated grading of mini pumpkins was evaluated and the relationships between external visual traits and internal fruit quality attributes were analyzed.
Materials and Methods
Plant materials and image acquisition
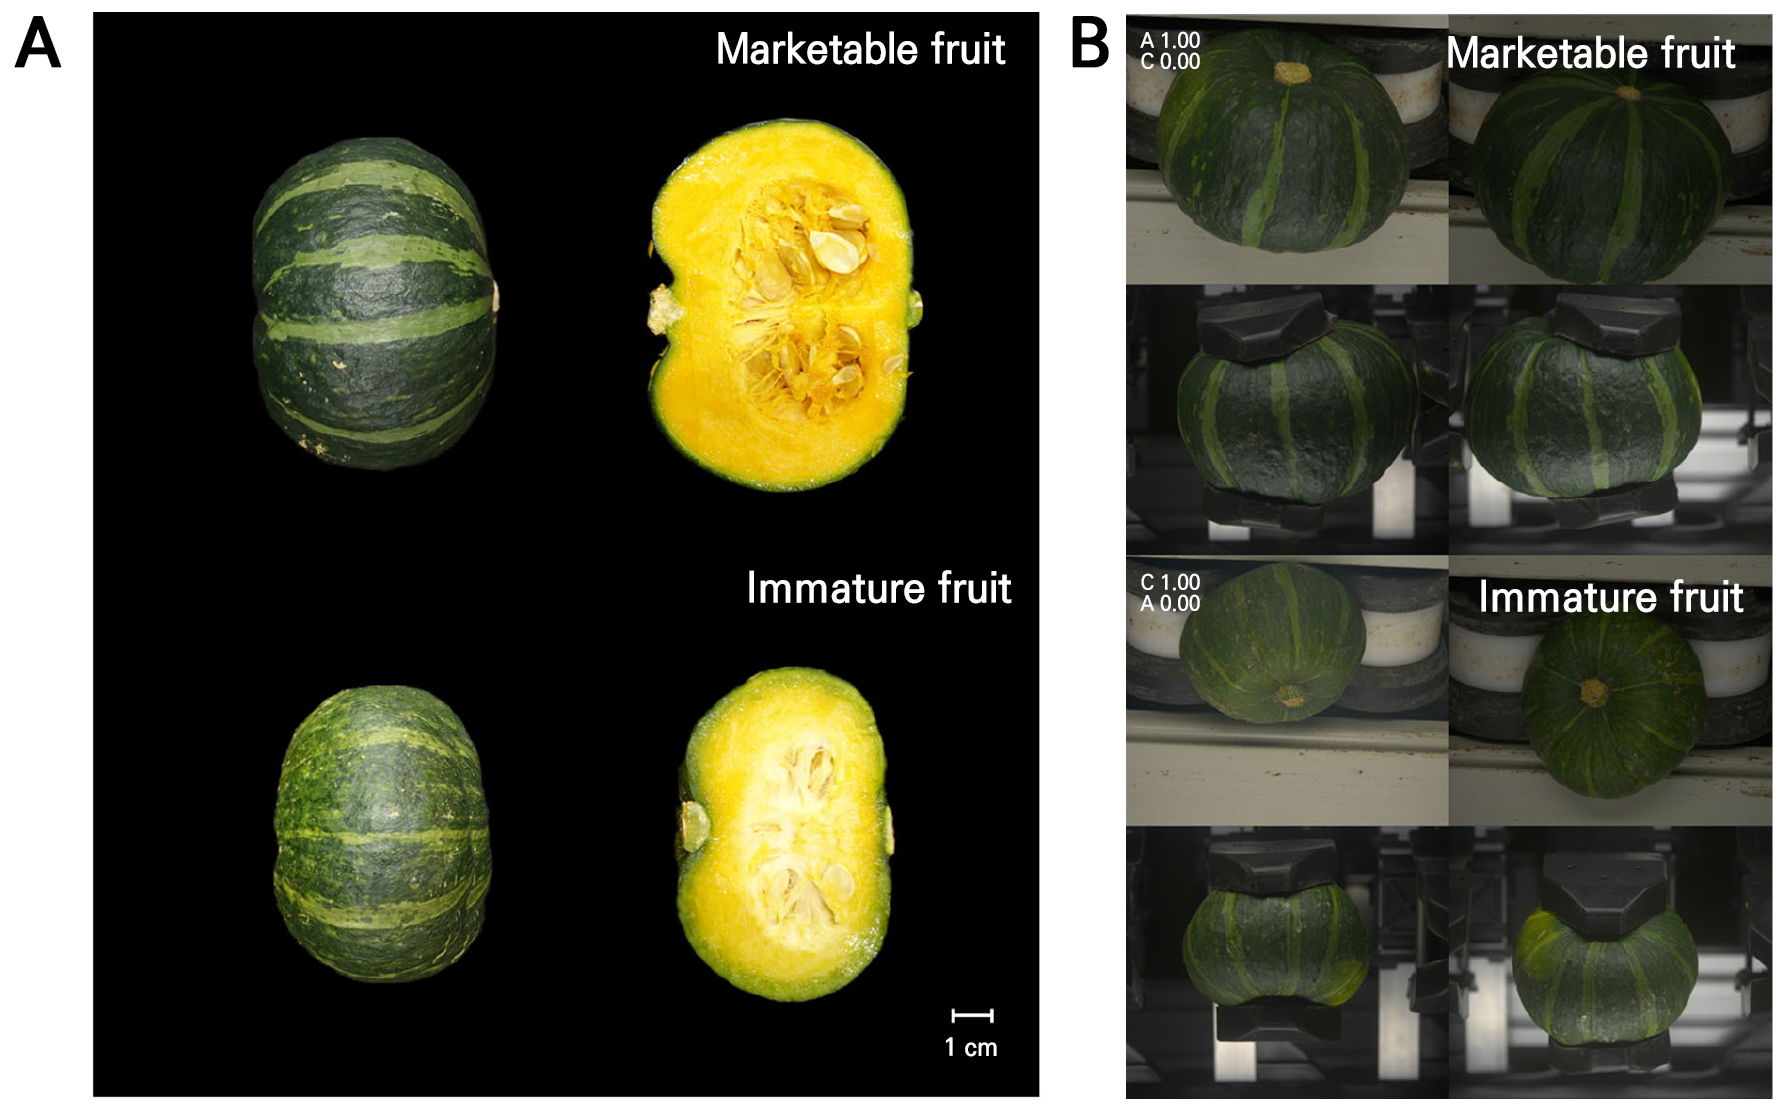
The mini pumpkins (Cucurbita maxima× C. moschata cv. Bojjang) used in this study were harvested on July 22, 2025 from a commercial farm in Muan, Jeollanam-do, Republic of Korea. Immediately after harvest, without any storage treatment, the fruits were visually classified into two groups based on their external appearance and marketability. Marketable fruits were defined as fruits with a dark green rind and normal maturity suitable for commercial distribution, whereas immature fruits were defined as fruits with a lighter green rind and insufficient maturity for commercial distribution (Fig. 1A). Images were acquired using a machine vision system equipped with a red, green, and blue (RGB) industrial camera (acA2440-20gc; Basler AG, Germany) under controlled LED illumination (5,500 K). The camera was mounted approximately 50 cm above the fruit samples. A total of 850 fruits were used for each group, and each fruit was photographed from four different orientations to capture the external characteristics of its surface. Representative images obtained from these four viewpoints are shown in Fig. 1B. All images were acquired against a uniform background to reduce noise during the image processing step. To ensure generalization and prevent any class imbalance, a balanced dataset of 6,800 color images was constructed with 3,400 samples each for the marketable and immature classes. Following standard protocols, the dataset was partitioned into training, validation, and test sets at a strict 7:1:2 ratio.
Dataset construction
To train and evaluate the classification model, the collected image dataset for each fruit class was divided into training (n = 2,380, 70%), validation (n = 340, 10%), and test (n = 680, 20%) sets. The dataset was split at the fruit level before image allocation such that all four images obtained from the same fruit were assigned to the same subset. All images were randomly shuffled before splitting. The 70:10:20 split ratio was adopted to ensure a sufficient number of images for model training while maintaining independent validation and test sets for the performance evaluation. Because the dataset was balanced between the two fruit classes, the validation and test sets contained the same number of images for marketable and immature fruits, reducing any potential bias caused by a class imbalance. This dataset configuration was used to train and evaluate the AI-based classification model for distinguishing between marketable and immature mini pumpkins.
AI-based classification model and performance evaluation
A deep-learning-based image classification model based on the ConvNeXt V2 architecture was used to classify mini pumpkin images into marketable and immature classes. ConvNeXt V2 (Woo et al. 2023) is a state-of-the-art (SOTA) backbone network designed to maximize fine-grained feature extraction by incorporating a fully convolutional masked autoencoder (FCMAE) framework and the global response normalization (GRN) technique into a pure CNN architecture. Owing to its superior computational efficiency and classification accuracy, this architecture has garnered increasing amounts of attention in smart agriculture for tasks such as automated produce grading (Zhao et al. 2025) and crop pest and disease detection (Ashraf et al. 2026). These design characteristics enable robust visual feature extraction and improve classification performance capabilities. In this study, RGB images of each fruit captured from four viewpoints were used as inputs to the model. Each image was resized to 224 × 224 pixels before being fed into the network. Transfer learning was applied by initializing the model with weights pre-trained on the ImageNet dataset, with this followed by fine-tuning using the mini pumpkin image dataset. The model was implemented in Python using the PyTorch deep-learning framework and trained on a workstation equipped with an NVIDIA GPU RTX4090 with VRAM 24GB. The training process employed the Adam optimizer with a learning rate of 0.0001 and batch size of 32. Cross-entropy loss was used as the objective function for the binary classification task. To prevent overfitting, model training was performed with a maximum of 500 epochs and an early stopping strategy. The validation loss was monitored at each epoch, and training was terminated when no further improvement was observed for 100 consecutive epochs. The lowest validation loss was obtained at epoch 103, and training was stopped at epoch 203. The model weights saved at epoch 103 were used for the final performance evaluation. To evaluate the performance of the proposed classification model, a confusion matrix was generated, and four commonly used evaluation metrics were calculated. These were accuracy, precision, recall, and the F1-score, as follows:
TP (True Positive) represents cases in which marketable fruits were correctly classified as marketable, TN (True Negative) represents cases where immature fruits were correctly classified as immature, FP (False Positive) represents cases where immature fruits were incorrectly classified as marketable, and FN (False Negative) represents cases where marketable fruits were incorrectly classified as immature.
Fruit quality measurements
The fruit quality characteristics were analyzed using 20 replicates per class. Morphological and physicochemical properties, specifically the fruit size, chromaticity, SSC, and firmness, were measured. The morphological characteristics measured here consisted of the fruit height, width, weight, and fruit shape index (FSI). The FSI was calculated as the ratio of the fruit height to the fruit width. Rind and flesh chromaticity were measured using a colorimeter (CR-400 Chroma Meter, Konica Minolta, Japan). Fruits were cut at the equatorial region, and color values were measured at the rind and central flesh tissues. Chromaticity was recorded in the CIE L*a*b* color space, where L* represents lightness, a* represents the red–green axis, and b* represents the yellow–blue axis.
Chroma (C*) and hue angle (h°) were calculated as follows:
SSC was measured using a digital refractometer (PAL-1, Atago Co., Japan).
Fruit firmness was measured using a texture analyzer (CT3, Brookfield Engineering Laboratories, USA) equipped with a 2 mm cylindrical probe (TA39). Firmness was measured to a penetration depth of 5.0 mm at a test speed of 2.0 mm·s⁻¹.
Statistical analysis
Differences in fruit quality characteristics between marketable and immature fruits were analyzed using an independent sample t-test. Pearson’s correlation analysis was conducted to evaluate the relationships between external fruit traits (rind chromaticity, fruit height, fruit width, fruit weight, and FSI) and internal fruit traits (flesh chromaticity, SSC, and firmness). All statistical analyses were performed using SPSS Statistics version 29 (IBM Corp., Armonk, NY, USA). Statistical significance was determined at p < 0.05.
Results and Discussion
External appearance and chromaticity differences between marketable and immature mini pumpkins
Clear differences in external appearance were observed between marketable and immature mini pumpkins. Immature fruits exhibited a relatively light rind color, whereas marketable fruits showed a darker rind color. These visual differences reflect the physiological maturity of the fruits and suggest that their external appearance serves as a potential indicator of fruit marketability (Karki et al. 2024). External visual traits are widely used as primary criteria for grading horticultural products in commercial distribution systems (Bhargava and Bansal 2018). In particular, rind color and fruit maturity have been reported as key factors affecting consumer preferences and the market value of pumpkin and squash crops (de Almeida et al. 2019; Ruwanthika et al. 2023). Consistent with these observations, significant differences in chromaticity were detected between marketable and immature fruits (Table 1). The rind lightness (L*) value of marketable fruits (30.7) was lower than that of immature fruits (36.0), indicating that marketable fruits had a darker rind color. The a* value was higher in marketable fruits (‒3.8) than in immature fruits (‒7.0), suggesting reduced green coloration in mature fruits. In contrast, immature fruits showed higher b* values (15.4) compared to those of marketable fruits (6.1), indicating stronger yellow–blue chromatic characteristics. Color information has been reported as one of the most important visual indicators during fruit quality evaluations (Bhargava and Bansal 2018). Apostolopoulos et al. (2023) reported that color-related features significantly improved the classification accuracy of fruit grading models. Therefore, the significant chromatic differences observed in this study likely contributed to the high classification performance of the AI model.
Table 1.
Comparison of rind and flesh chromaticity between marketable and immature mini pumpkins
| Classification | Rind chromaticity | Flesh chromaticity | |||||||||
| L* | a* | b* | C* | h° | L* | a* | b* | C* | h° | ||
| Marketable | 30.7 ± 1.4z | ‒3.8 ± 1.0 | 6.1 ± 2.0 | 7.2 ± 2.3 | 122.0 ± 63.0 | 66.1 ± 2.7 | 13.0 ± 1.6 | 71.7 ± 2.4 | 72.8 ± 2.9 | 79.7 ± 1.1 | |
| Immature | 36.0 ± 3.8 | ‒7.0 ± 2.9 | 15.4 ± 5.4 | 16.9 ± 6.1 | 114.7 ± 61.7 | 71.7 ± 3.4 | 5.4 ± 2.9 | 63.6 ± 4.4 | 63.8 ± 5.3 | 85.1 ± 2.6 | |
| Significance | ***y | *** | *** | *** | ** | *** | *** | *** | *** | *** | |
Performance of the AI-based classification model
The performance of the deep-learning-based classification model was evaluated using a confusion matrix and commonly used classification metrics (Fig. 2 and Table 2). Among the 1,360 test samples, 671 of 680 marketable fruits (98.7%) were correctly classified as marketable, while nine samples (1.3%) were misclassified as immature fruits. Conversely, 676 of 680 immature fruits (99.4%) were correctly classified, whereas four samples (0.6%) were incorrectly classified as marketable fruits. Consequently, the overall classification accuracy reached 99.0% with the entire processing pipeline—from image acquisition to the final grading decision—taking a mere 105 to 124 ms per fruit. The training and validation loss curves indicated stable model convergence, with the lowest validation loss observed at epoch 103 (Fig. 2). These results demonstrate that the AI-based image classification model can effectively distinguish between marketable and immature mini pumpkins based on external visual features. In particular, the ConvNeXt V2 architecture effectively captured complex rind patterns, color variations, and other visual features of mini pumpkins, likely contributing to the high classification performance observed in this study. Previous studies have also reported high classification performance when deep-learning algorithms were applied to fruit maturity and quality classification tasks (Aherwadi et al. 2022). For example, Tapia-Mendez et al. (2023) reported that deep-learning models achieved high accuracy rates on maturity stage detection tasks focused on horticultural crops. Similarly, Ermiş et al. (2025) demonstrated that machine learning models using morphological features could successfully classify pumpkin seed characteristics. Because the AI model was trained using external RGB images, its classification performance should be interpreted as the result of distinguishing external visual traits associated with fruit maturity, rather than directly detecting internal maturity. Previous studies have shown that external visual attributes, including fruit color, size, shape, and surface appearance, are important indicators for image-based fruit quality evaluation and maturity classification assessments (Cubero et al. 2011; Pathare et al. 2013; Bhargava and Bansal 2018). Therefore, the high classification accuracy observed in this study was likely achieved by integrating multiple external features related to maturity and marketability.
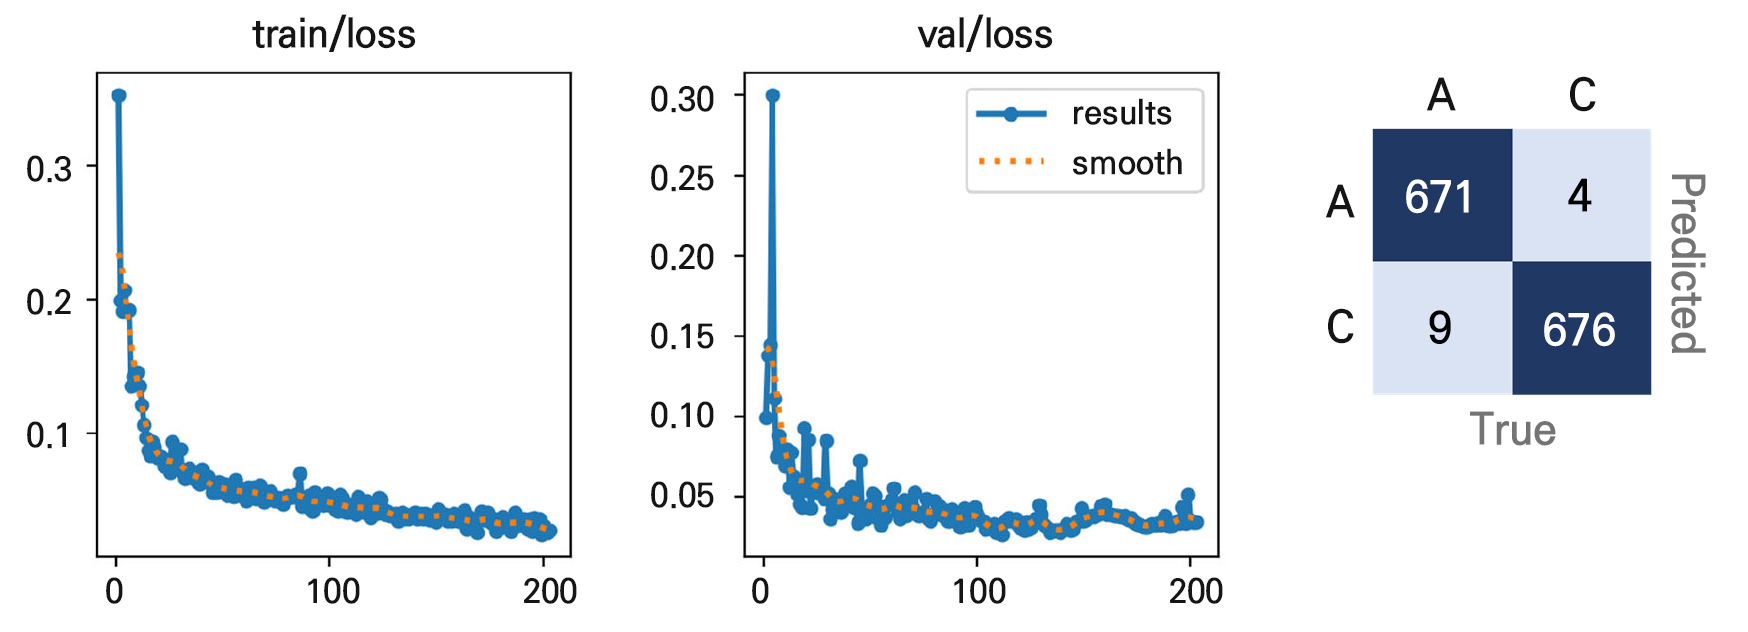
Table 2.
Precision, recall, F1-score, and accuracy of AI-based classification results for mini pumpkins
| Fruit class | Precision | Recall | F1-score |
| Marketable | 0.994 | 0.987 | 0.991 |
| Immature | 0.987 | 0.994 | 0.991 |
| Accuracy | - | - | 0.990 |
Differences in fruit size and morphological characteristics
After evaluating the classification performance of the AI model, we subsequently analyzed external and internal quality attributes to determine whether external fruit characteristics could serve as indicators of fruit quality overall. Fruit morphological characteristics also differed between marketable and immature fruits (Fig. 3). The average height and width of marketable fruits were 5.3 and 9.5 cm, respectively, whereas immature fruits had corresponding values of 4.8 and 9.1 cm, indicating that marketable fruits were larger. However, no significant difference was observed in the FSI between the two fruit classes. Fruit weight was also significantly higher in marketable fruits (300 g) than in immature fruits (250 g). Although fruit weight showed a clear difference between the two fruit classes, it was not directly used as an input variable in the image-based AI model. In addition, the FSI did not differ significantly between marketable and immature fruits, suggesting that size- or shape-related traits alone may not fully explain the classification performance. Fruit size and morphological characteristics are commonly used indicators in visual fruit grading systems, and morphological features such as fruit size and shape are reportedly important variables in image-based fruit classification models (Ropelewska et al. 2022). Nevertheless, the color of the external rind also undergoes distinct changes during maturation and can serve as a visual indicator of fruit maturity (Pathare et al. 2013). Accordingly, the high classification accuracy observed in this study was likely achieved through the combined use of multiple external visual features, specifically the rind color characteristics, fruit size, shape, and surface pattern.
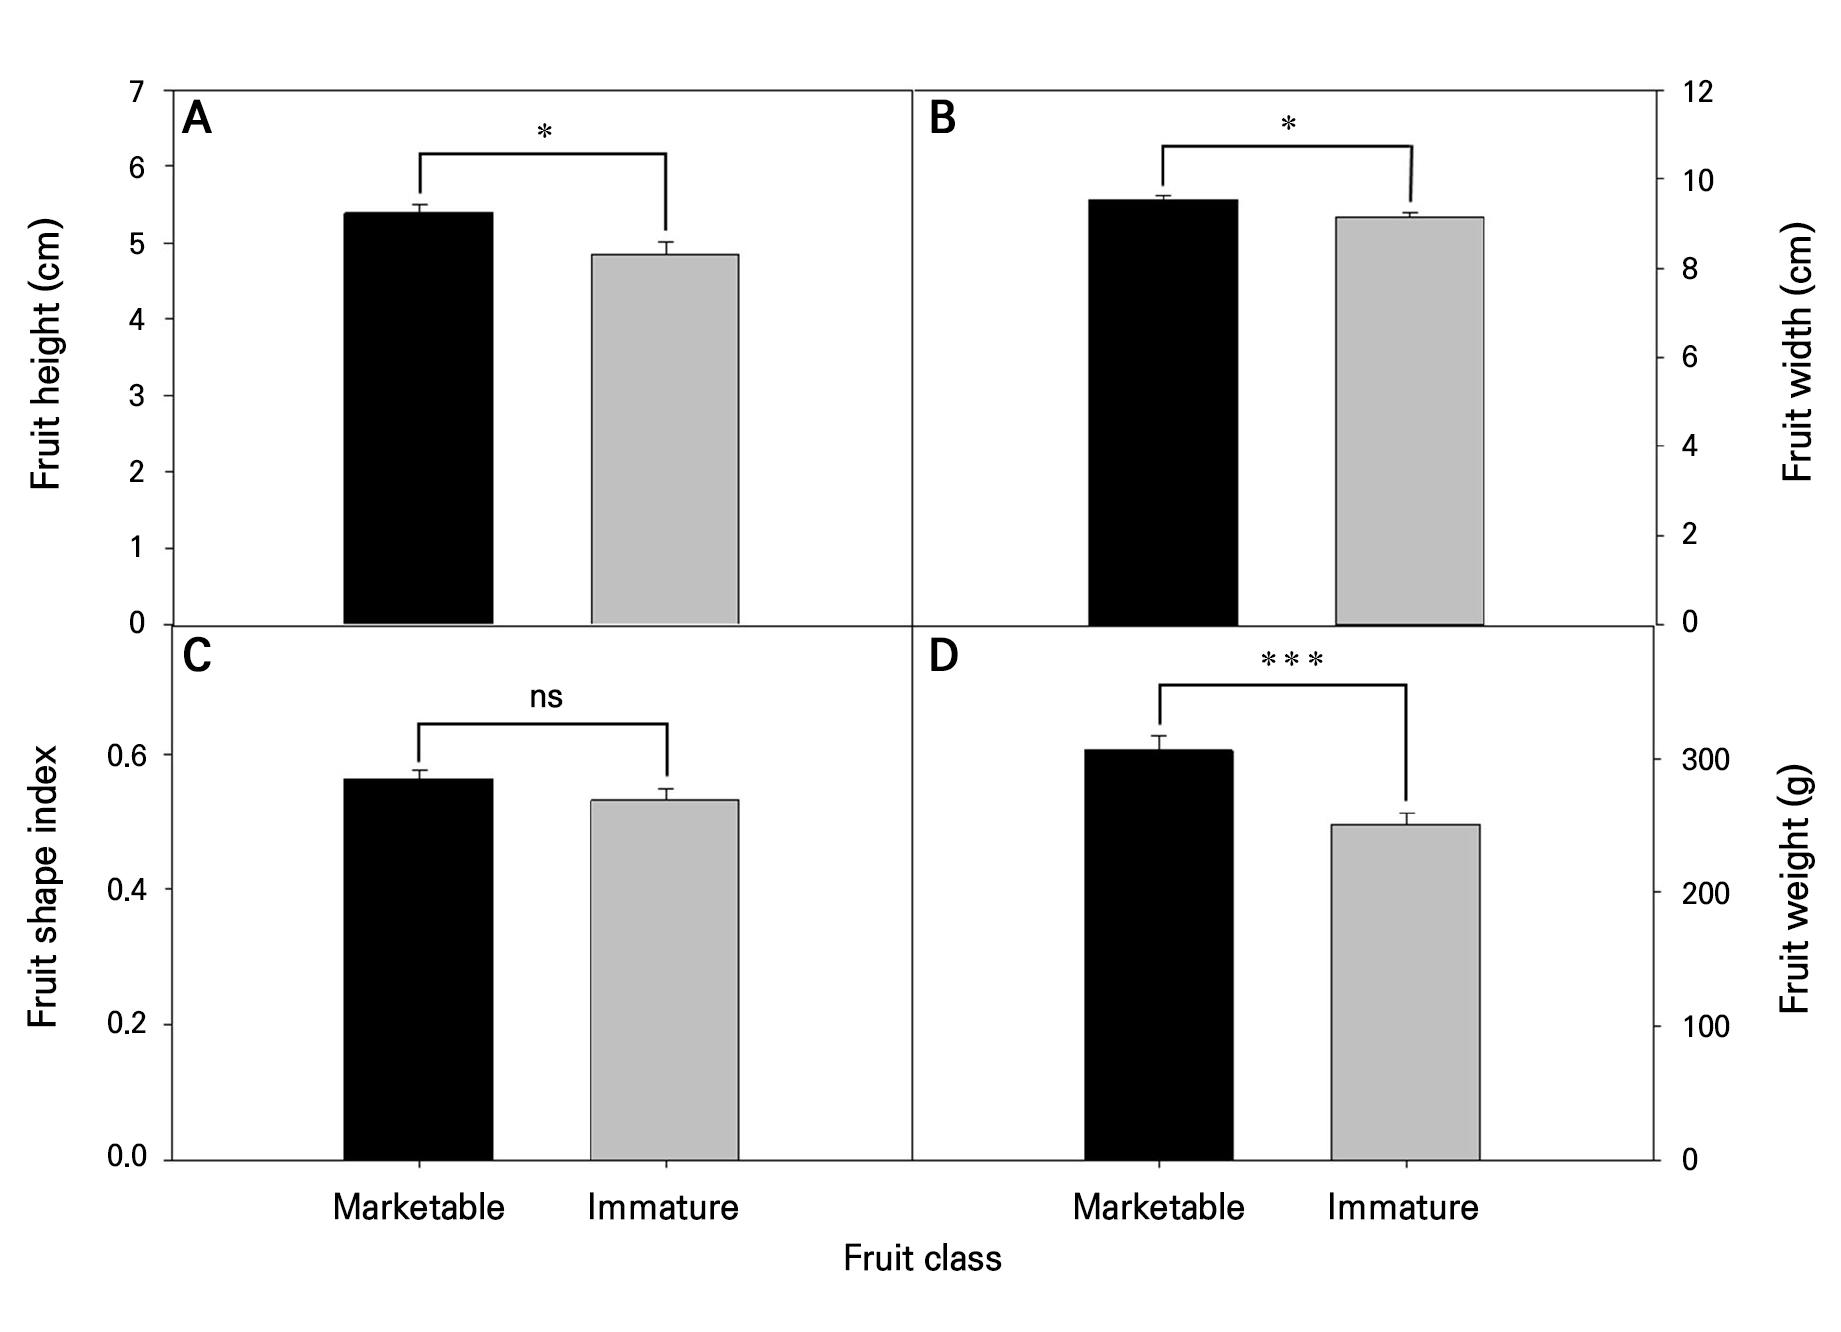
Fig. 3.
Comparison of fruit height (A), fruit width (B), fruit shape index (C), and fruit weight (D) between marketable and immature mini pumpkins; vertical bars represent ± standard error (n = 20); ns, not significant; * and *** indicate significant differences at p < 0.05 and p < 0.001, respectively, by t-test.
Internal quality characteristics of marketable and immature mini pumpkins
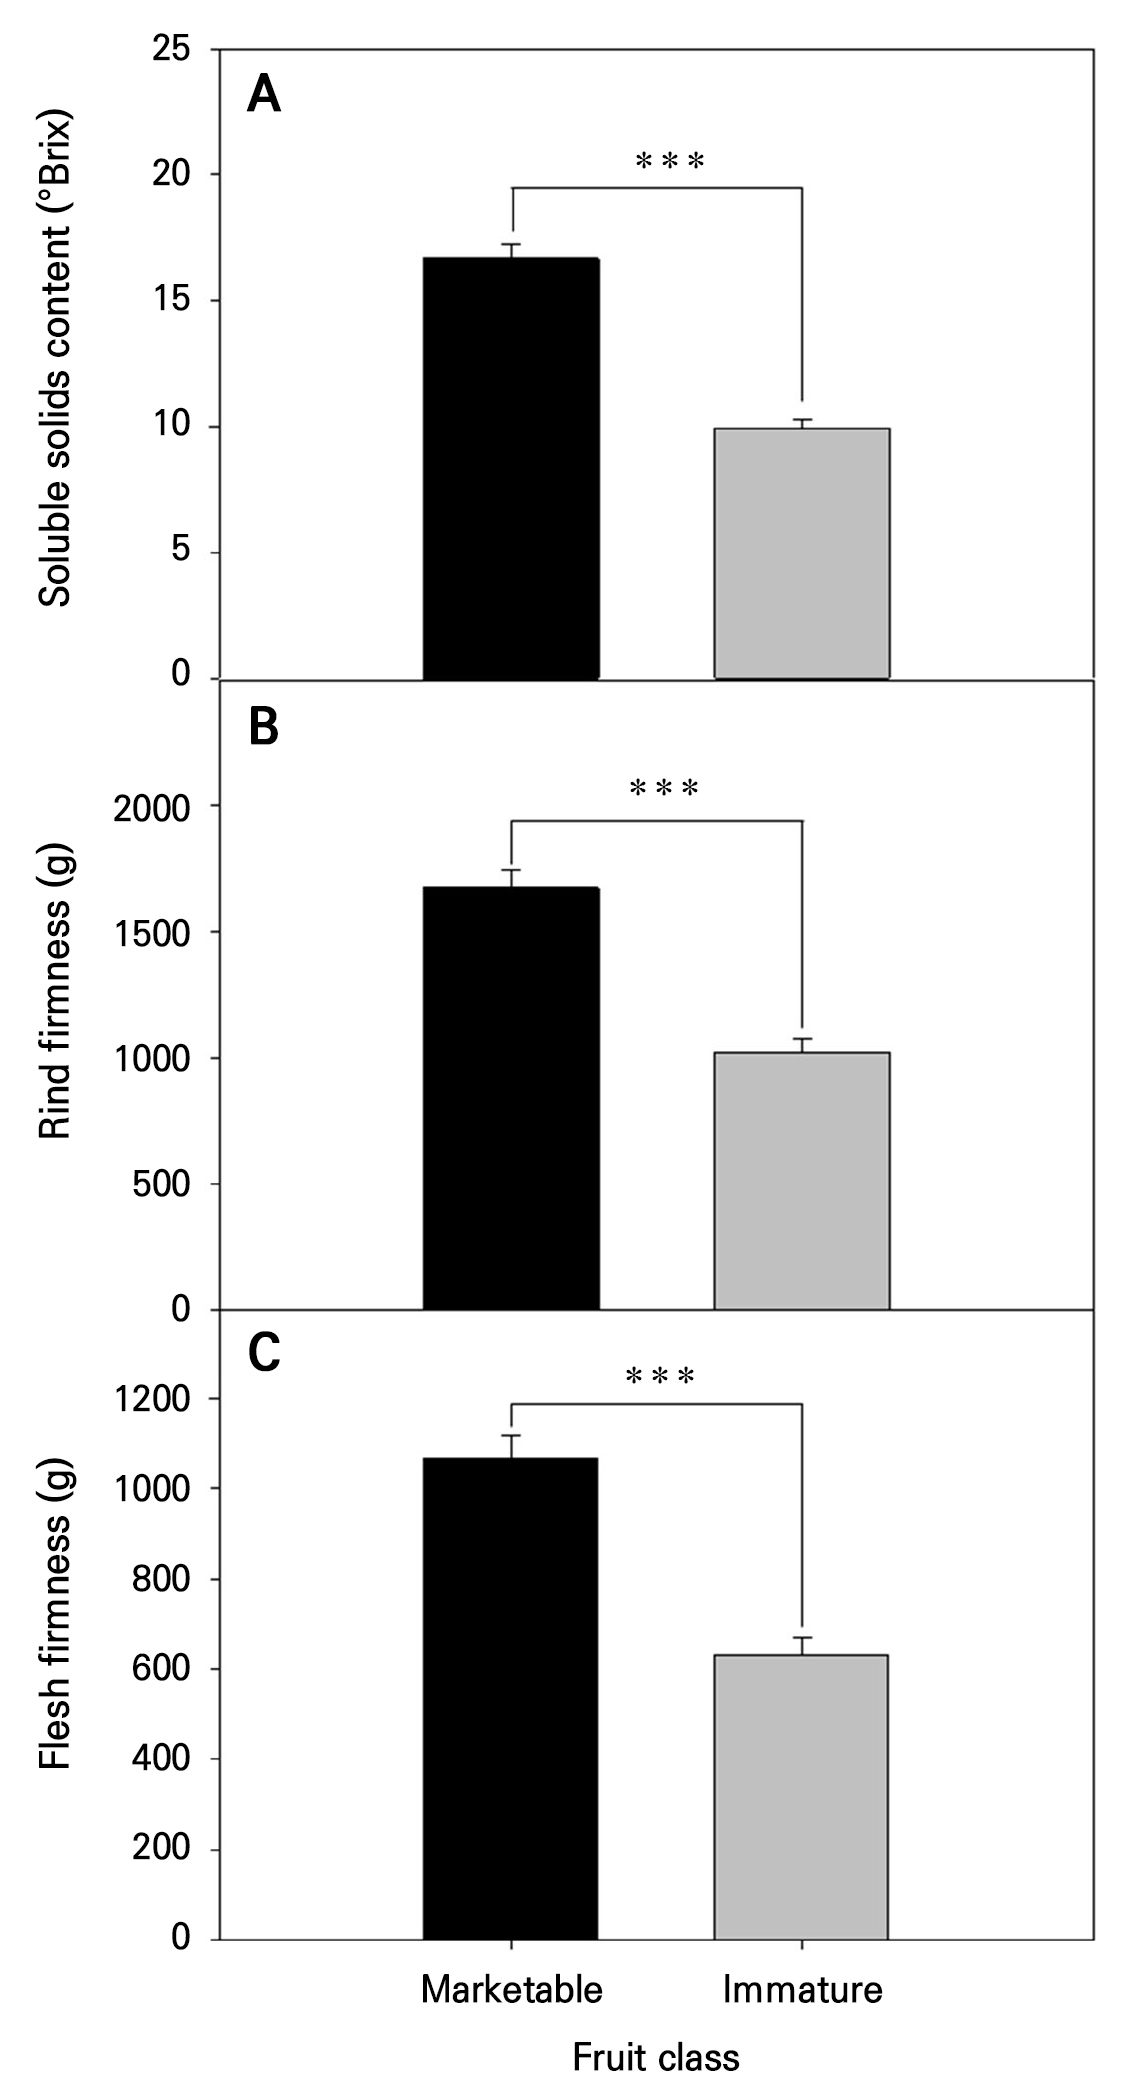
Clear differences in internal appearance were also observed between marketable and immature mini pumpkins. Immature fruits exhibited less developed internal tissues, whereas marketable fruits showed fully developed yellow to orange flesh (Fig. 1A and Table 1). The flesh lightness (L*) value of marketable fruits (66.1) was lower than that of immature fruits (71.7), indicating that the flesh color of marketable fruits was darker. In contrast, the a* value was markedly higher in marketable fruits (13.0) than in immature fruits (5.4), suggesting a greater development of reddish coloration during fruit maturation. The b* value was also higher in marketable fruits (71.7) than in immature fruits (63.6), indicating stronger yellow coloration. In addition, marketable fruits showed higher C* values and lower h° values than immature fruits, suggesting more vivid and mature flesh pigmentation. These differences in flesh color may be associated with increased carotenoid accumulation during fruit maturation (Itle and Kabelka 2009). SSC, which is closely associated with sweetness and consumer preference, was significantly higher in marketable fruits (16.6 °Brix) than in immature fruits (9.9 °Brix) (Fig. 4A). In addition, rind and flesh firmness values were significantly higher in marketable fruits than in immature fruits (Fig. 4B and 4C). Rind firmness was 1,673.5 gf in marketable fruits and 1,021.4 gf in immature fruits, while flesh firmness was 1,070.0 gf and 630.2 gf, respectively. Fruit firmness is closely associated with fruit tissue development and storage stability (Vilhena et al. 2022; Ren et al. 2023). Previous studies have reported that pumpkins with greater firmness values are generally associated with better postharvest quality and market acceptance (Liu et al. 2024). These results indicate that fruit maturation leads to significant changes in internal quality attributes, in this case sweetness and firmness. Because the AI model was based on external images, it could not directly detect internal quality traits such as SSC and firmness. Therefore, the classification performance should be interpreted as being supported by external visual features that are associated with internal quality attributes, rather than by the direct detection of internal maturity. To verify the relationship between external visual traits and internal quality attributes, a correlation analysis was subsequently conducted.
Relationship between external and internal fruit quality traits
Pearson’s correlation analysis revealed significant correlations between external and internal fruit quality attributes (Fig. 5). The strength of the correlation was classified according to standard statistical guidelines (Schober et al. 2018) as follows: very strong (0.9 ≤ |r| ≤ 1.0), strong (0.7 ≤ |r| < 0.9), moderate (0.4 ≤ |r| < 0.7), and weak (0.1 ≤ |r| < 0.4). Rind lightness (L*) showed moderate negative correlations with flesh chroma (C*, r = ‒0.45), fruit weight (r = ‒0.40), SSC (r = ‒0.56), rind firmness (r = ‒0.52), and flesh firmness (r = ‒0.44) values. These results indicate that fruits with a darker rind color tended to have higher fruit weight, SSC, and firmness values. Similarly, rind chroma (C*) showed a weak negative correlation with fruit weight (r = ‒0.37) and moderate negative correlations with SSC (r = ‒0.66), rind firmness (r = ‒0.57), and flesh firmness (r = ‒0.52). In contrast, rind C* showed moderate positive correlations with flesh lightness (r = 0.59) and hue angle (r = 0.63). These correlation coefficients indicate that external visual traits, particularly rind color attributes, were significantly associated with internal quality characteristics related to fruit maturity. Previous studies have reported similar relationships between external color attributes and internal fruit quality in pumpkin crops. Moreno et al. (2023) reported that chromatic parameters, particularly C* and the hue angle, are associated with fruit maturity and quality parameters, and Liu et al. (2024) reported that rind color, firmness, and SSC change simultaneously during pumpkin fruit maturation. Therefore, the significant correlations observed in this study suggest that the AI model classified fruit maturity and marketability by integrating external visual features associated with internal quality status, rather than by directly detecting internal traits. Specifically, a darker rind color, as represented by a lower rind L* value, was associated with higher SSC and firmness, while lower rind C* values were also associated with increased SSC and firmness levels. These relationships support the interpretation that external fruit characteristics can serve as useful indirect indicators of internal quality attributes. However, because the image-based AI model relies solely on external RGB images, it is inherently limited with regard to its ability to detect internal defects or quality disorders that do not exhibit visible symptoms on the fruit surface. Despite this limitation, AI-assisted image analysis may provide a practical tool for non-destructive fruit grading and automated sorting in commercial pumpkin production systems.
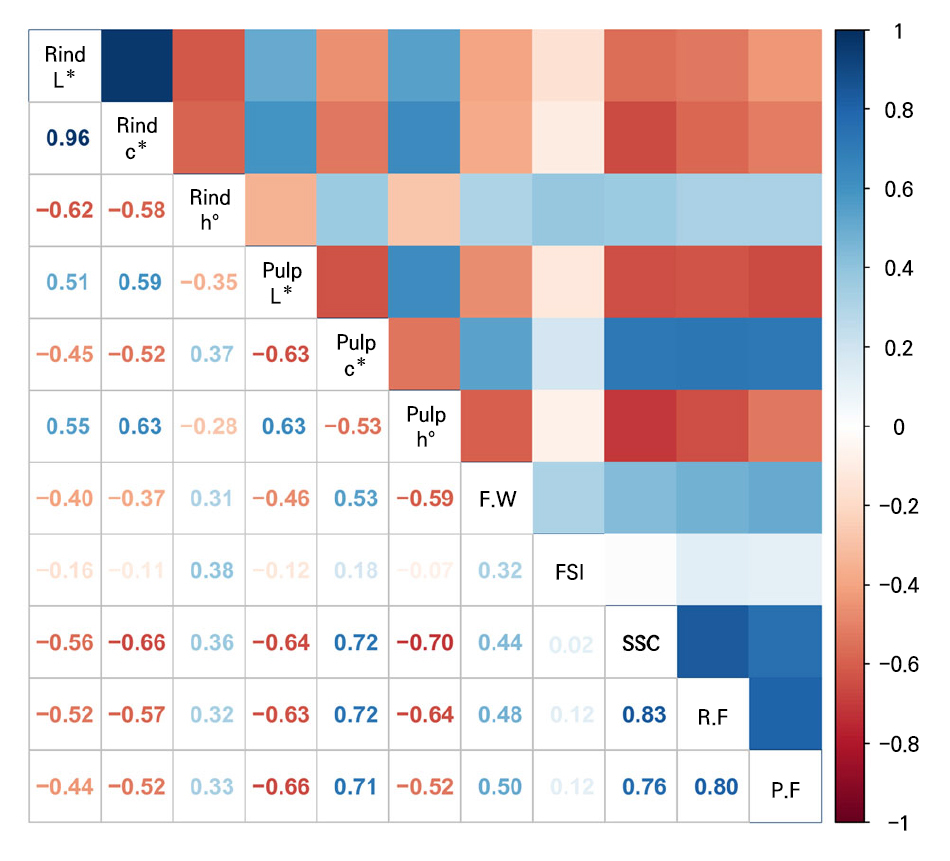
Fig. 5.
Correlation analysis between external and internal quality attributes of mini pumpkins. Rind L*, rind lightness; rind C*, rind chroma; rind h°, rind hue angle; flesh L*, flesh lightness; flesh C*, flesh chroma; flesh h°, flesh hue angle; F.W., fruit weight; FSI, fruit shape index; SSC, soluble solids content; R.F., rind firmness; F.F., flesh firmness. The figure legend indicates the correlation coefficient (r) results. Red and blue denote negative and positive correlation coefficients between the variables, respectively.
Conclusion
This study evaluated the performance of an AI-based image classification model for distinguishing between marketable and immature mini pumpkins and investigated the relationships between external fruit traits and internal quality attributes. The deep-learning model achieved high classification performance, with an overall accuracy rate of 99.0%, indicating that image-based AI analysis can effectively identify fruit marketability based on external visual characteristics. Significant differences were observed between marketable and immature fruits in terms of rind chromaticity, fruit size, SSC, and firmness. In addition, a correlation analysis revealed significant associations between external visual characteristics and internal fruit quality parameters, particularly between rind color attributes and SSC or firmness. These findings suggest that external fruit traits can serve as useful indirect indicators of internal fruit quality. However, because the image-based AI model relies solely on external RGB images, it has inherent limitations in detecting internal defects or quality disorders that do not exhibit visible symptoms on the fruit surface. Despite this, AI-assisted image analysis may provide a practical tool for non-destructive fruit grading and automated sorting in commercial pumpkin production systems.
