

Introduction
Materials and Methods
Materials and experimental site
Greenhouse structure and climate control system
Sap flow measurements
Growth and yield measurements
Statistical analysis
Results and Discussion
Comparison of internal and external environments in the PP-SCG vs. NP-SCG
Comparison of the sap flow in PP-SCG vs. NP-SCG
Comparison of growth characteristics in PP-SCG vs. NP-SCG
Introduction
Paprika (Capsicum annuum L.) is a high-value vegetable crop rich in minerals, vitamins, and bioactive compounds, including carotenoids, phenolic compounds, and capsaicinoids, making it an important food resource (Nazzaro et al. 2009; Škrovánková et al. 2017). Exports—primarily to Japan—represent a significant portion of total production, and as domestic consumption increases, the establishment of a stable, year-round production system has become a critical issue (aTkati 2018; Yoon et al. 2021). Consequently, greenhouse cultivation utilizing smart-farm technology is expanding in Korea, offering a more stable growth environment for paprika (Jeon et al. 2022; Venkatesan et al. 2022; Kim et al. 2023).
The structure and design of smart-farm greenhouses significantly influence the precision of environmental control and are therefore essential factors related to the maintenance of both crop growth stability and productivity (Jeong et al. 2009). Recently, semi-closed greenhouses have been developed that actively mix and regulate external and internal air while maintaining positive pressure. This design enables precise control of environmental factors such as the temperature, humidity, and CO2 concentration, while also preventing the entry of external pests and diseases and improving the uniformity of the internal environment (Opdam et al. 2005; Sapounas et al. 2020; Kim et al. 2023). Shamshiri and Ismail (2013) emphasized the need for automated technologies that integrate key environmental parameters in greenhouses, allowing them to respond in real time to crop growth stages and microenvironmental changes. Non-pressurized semi-closed greenhouses (NP-SCG) primarily rely on natural ventilation through roof vents to exchange indoor and outdoor air, thereby regulating the temperature, relative humidity, and CO2 concentration. In contrast, positive-pressure semi-closed greenhouses (PP-SCG) use roof vents to maintain positive pressure, and within the corridor, side vents and air-handling fans actively control the exchange of air between the interior and exterior, as well as internal air circulation, thereby enabling precise environmental management inside the greenhouse (Sapounas et al. 2020). In particular, when an air-handling corridor and an air distribution system are installed, environmental conditions can be controlled more flexibly. For example, freshly conditioned air can be introduced for heating, cooling, or dehumidification. Additionally, internal greenhouse air can be recirculated and reconditioned or mixed with external and internal air as needed (Sapounas et al. 2020). These control modes allow for comprehensive management of the air temperature, water vapor content, and airflow.
Sap flow, driven by xylem transpiration, plays a crucial role in distributing water, nutrients, and hormones within plants, supplying water for photosynthesis, and maintaining turgor and water balance (Kim and Lee 2024). Monitoring the sap flow using micromachined, needle-like calorimetric sensors is done to optimize water use, manage nutrient and water supply levels, and detect diseases (Fernández et al. 2008; McElrone et al. 2010; Ferreira et al. 2012; Urban and Dvořák 2014; Yoon et al. 2020; Saitta et al. 2021; Jin et al. 2024). To date, greenhouse cultivation has relied on the indirect management of crop growth by monitoring environmental factors such as the internal temperature, humidity, light intensity, and CO2 concentration (Ehret et al. 2001). However, this method is limited in its ability to reflect the actual physiological responses of plants in real time. In contrast, sap flow sensors allow for the direct quantification of the internal water status and physiological responses, enabling more accurate crop assessments and proactive management (Fernández et al. 2008; Park et al. 2019; Chai et al. 2021; Zhang et al. 2024).
Accordingly, this study compared the internal environment, growth and yield traits, and sap flow characteristics of paprika cultivated in PP-SCG and NP-SCG systems to identify differences in growth and productivity attributable to the greenhouse structure.
Materials and Methods
Materials and experimental site
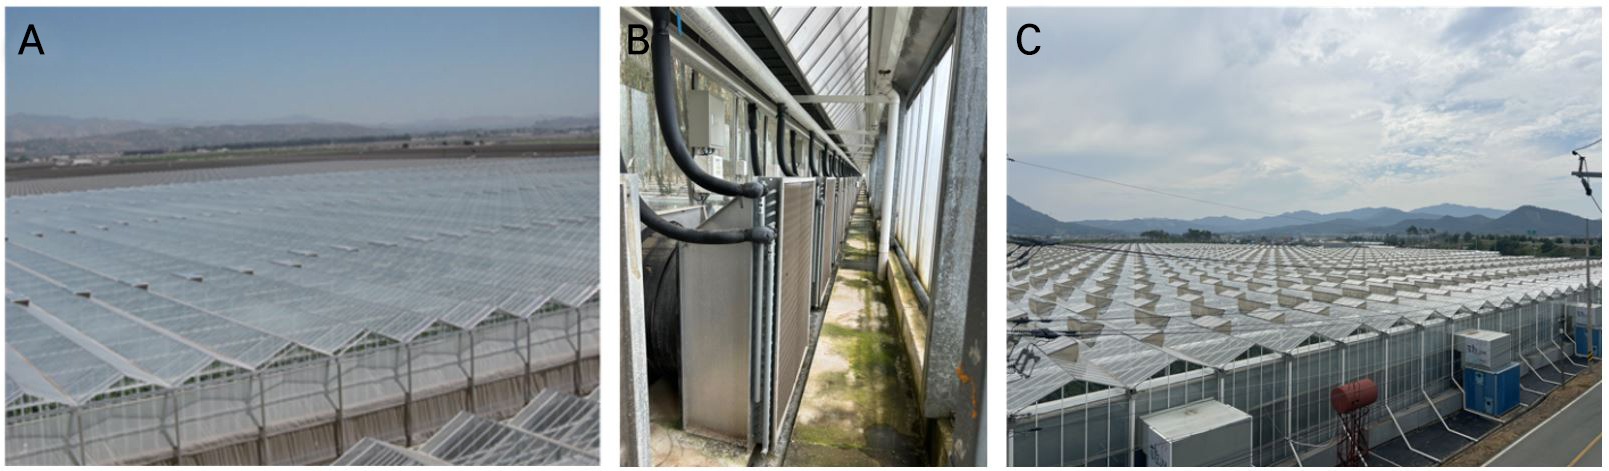
This study was conducted in a PP-SCG owned by Suninus Agricultural Corporation, located in Doam-myeon, Gangjin-gun, Jeollanam-do, South Korea (34.57°N, 126.76°E), and in an NP-SCG owned by ArtFarm Agricultural Cooperative Corporation, located in Gangjin-eup, Gangjin-gun, Jeollanam-do, South Korea (34.62°N, 126.77°E) (Fig. 1).
Paprika (Alzamora, Rijk Zwaan, Netherlands) was selected as the experimental crop. Seeds were sown on May 2, 2024, in 240-hole rock wool trays (Planto Plug NG2, Grodan, Netherlands) and covered with vermiculite. The seedlings were transplanted on June 5, 2024, into a coco peat substrate (Daeyoung GS, Korea), marking the beginning of cultivation in each greenhouse. Both greenhouses employed an irrigation control program (Synopta, Ridder, Netherlands) that triggered fertigation based on cumulative solar radiation. The nutrient solution was maintained within an electrical conductivity (EC) range of 2.5–3.0 d·S m-1 and pH of 5.5–6.0, and it was applied at a dose of 2 cm3·J-1·m-2 of accumulated radiation.
Greenhouse structure and climate control system
The NP-SCG was covered with regular low-iron glass (direct light transmittance: 91.4%; haze: 0%). This greenhouse utilized natural ventilation through roof vents that opened in both directions, regulating the temperature and humidity by adjusting vent openings based on the wind direction. Sixteen air-handling units (Sewon ENG, Korea), each with a maximum flow rate of 69,000 m3·h-1, circulated air through 300 mm diameter polyethylene ducts installed beneath the gutters. A total of 42 circulation fans (FC040 4E_2F, Ziehl Abegg, Germany), each with an airflow capacity of 5,000 m3·h-1, were installed near the greenhouse roof vents. The PP-SCG was covered with low-iron diffuse glass (direct light transmittance: 94%; haze: 50%). A forced-circulation air conditioning system (Ultra Clima, Kubo, Netherlands) circulated internal air through 940 mm and 1,020 mm ducts using 120 supply fans (ZN 091, Ziehl Abegg, Germany), each with a maximum flow rate of 33,000 m3·h-1.
The internal temperature and humidity of the greenhouses were measured using dry- and wet-bulb temperature sensors (MTV Active, Ridder, Netherlands) installed at the center of each zone: five zones in the NP-SCG and four in the PP-SCG. Data were collected at ten-minute intervals. Each side wall (north and south) featured three lateral inlets to regulate the inflow of external air and further control the internal temperature and humidity. All environmental data were recorded and stored using Ridder Synopta v5 climate control software (Ridder Growing Solution B.V., Netherlands). External air temperature and relative humidity data were also collected at ten-minute intervals from the Gangjin Automatic Weather Station (AWS) via the Korea Meteorological Administration Open Data Portal and were used for a comparative analysis with the internal greenhouse environment.
Sap flow measurements
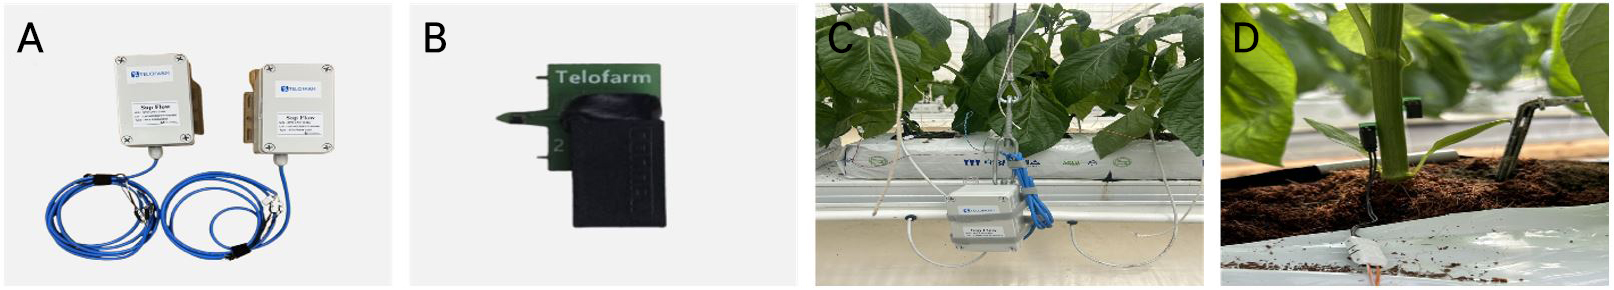
To analyze sap flow within the plants, measurements were taken at ten-minute intervals with four replications per greenhouse from August 1 to September 4, 2024 (Fig. 2). A micromachined, needle-like calorimetric flow sensor (MSF 01, Telofarm Inc., Korea) was installed on the first internode of the stem to collect sap flow data.
Growth and yield measurements
For each greenhouse, nine biological replicates were evaluated on August 3 and August 31. The plant height, stem diameter, number of nodes, number of leaves, total leaf area, leaf area per leaf, and fresh and dry shoot weights were measured. Plant height was measured from the stem base to the shoot apex. The number of nodes and leaves was counted along the main stem, excluding leaves shorter than 1 cm. Leaf area was determined using a leaf area meter (LI 3100C, LI COR, USA) on all leaves, and the mean leaf area per leaf was calculated by dividing the total leaf area by the number of leaves. Stem diameter was measured 1 cm above the stem base using a digital caliper (CD PS, Mitutoyo, Japan). Fresh and dry shoot weights were measured using an electronic scale. Dry weights were obtained after drying the samples in an upright convection oven (JSOF-250T, JSR, Korea) at 70°C for at least 168 h. The yield and fresh fruit weight of paprika were measured using ten replicates per greenhouse. The first harvest was conducted on August 21, followed by weekly harvests thereafter.
Statistical analysis
Statistical analyses were conducted using SPSS software (version 29.0, IBM SPSS Inc., USA). To compare groups, t-tests and Duncan’s multiple range tests were performed to assess statistical differences. Pearson’s correlation analysis and multiple linear regression were used to evaluate the relationships between sap flow and environmental variables. A correlation analysis was conducted to assess linear associations between variable pairs, while the regression analysis treated sap flow as the dependent variable and the internal temperature and relative humidity as independent variables. Graphs were generated using SigmaPlot (version 15.0, Systat Software Inc., USA).
Results and Discussion
Comparison of internal and external environments in the PP-SCG vs. NP-SCG
A comparison of the external average temperature in Gangjin-gun, Jeollanam-do, with the internal temperatures of the PP-SCG and NP-SCG revealed that the NP-SCG closely tracked fluctuations in the external temperature, whereas the PP-SCG consistently maintained a lower average temperature (Fig. 3A). The relatively low and stable internal temperature observed in the PP-SCG was attributed to the air treatment corridor system, which preconditioned the physical properties of the incoming external air, such as temperature and humidity, and actively circulated both internal and external air to maximize the cooling effect (Kittas et al. 2009; Sapounas et al. 2020; Jeon et al. 2022; Kim et al. 2023). Moreover, by minimizing natural ventilation while integrating mechanical cooling systems—including fans, cooling pads, and heat exchangers—the PP-SCG effectively regulated the heat load, thereby enhancing crop stability even during high-temperature periods such as summer (Qian et al. 2011; Dannehl et al. 2014; Kim et al. 2023).

Both the PP-SCG and NP-SCG exhibited average relative humidity levels exceeding 80% (Fig. 3B). According to the Greenhouse Environmental Control Management Guide published by the Rural Development Administration, maintaining a relative humidity range of 70–85% at indoor air temperatures of 30–33°C is considered optimal for crop growth (RDA 2018). However, during the hot and humid summer season in which this experiment was conducted, precise humidity control proved challenging in both greenhouses. Nevertheless, the PP-SCG more frequently maintained daytime relative humidity levels at or below 80% compared to the NP-SCG. High humidity conditions can negatively impact crop physiology and reproductive development by hindering pollen dispersal, which can result in pollination and fertilization failures while also increasing the incidence of disease (Aronne et al. 2020; Iovane et al. 2022). Furthermore, when the leaf surface temperature drops below the dew point and condensation forms, increased relative humidity can become a major factor in disease development (Li et al. 2022). Therefore, although it was difficult to maintain the ideal relative humidity range continuously under summer’s extreme conditions (high temperature and humidity), the PP-SCG’s active dehumidification and ventilation control system effectively reduced the duration of high-humidity events.
The pronounced differences in temperature and relative humidity presented in Fig. 3 appear to have resulted from summer weather conditions and differences in the operation of ventilation and dehumidification systems. In particular, because the NP-SCG relied on natural ventilation, external climatic fluctuations were directly reflected in the internal environment, leading to greater variability in the relative humidity. In contrast, the PP-SCG preconditioned incoming external air through the air treatment corridor system, thereby maintaining a more stable pattern.
Comparison of the sap flow in PP-SCG vs. NP-SCG
A comparison of the sap flow between the PP-SCG and NP-SCG showed that sap flow in the PP-SCG remained consistently higher than that in the NP-SCG throughout the measurement period (Fig. 3C). The PP-SCG provides more favorable conditions for efficient transpiration and photosynthesis by precisely controlling not only the temperature and humidity but also the CO2 concentration and air circulation in an integrated manner (Qian et al. 2011; Sapounas et al. 2020). Stöhr and Lösch (2004) demonstrated that a uniform light environment, combined with an adequate water supply, enhances plant hydraulic conductance, thereby promoting more active water transport. Seginer (2002) further emphasized that transpiration functions not only as a water-loss mechanism but also as a driver of both internal water movement (within the plant) and greenhouse cooling. Katsoulas et al. (2015) reported that maintaining a vapor pressure deficit (VPD) at an optimal level in a PP-SCG can suppress excessive transpiration, enhance water-use efficiency, and reduce variability in crop productivity.
Pearson’s correlation analysis was performed to assess the relative influence of the internal and external temperature and humidity on the sap flow (Table 1). The correlation between the external and internal temperatures was r = 0.850 in the PP-SCG and r = 0.887 in the NP-SCG, indicating stronger coupling in the latter. Similarly, the correlation between external and internal humidity was r = 0.812 in the PP-SCG and r = 0.854 in the NP-SCG, suggesting that the NP-SCG was more sensitive to external environmental fluctuations. This pattern can be attributed to the NP-SCG’s reliance on natural ventilation through roof vents, which allows outdoor climate conditions to directly affect the indoor environment (Kwon et al. 2011; Kim et al. 2022; Park et al. 2022). In contrast, the PP-SCG actively regulates the intake of external air through an indoor–outdoor mixed air-conditioning system; therefore, external temperature and humidity fluctuations have minimal impact on internal conditions. These structural differences may influence physiological responses such as transpiration and water transport in crops, as well as the overall stability of the greenhouse environment (Katsoulas et al. 2015).
Table 1.
Pearson correlation coefficients (r) among the sap flow, internal and external temperature and relative humidity in the PP-SCG and NP-SCG
| PP_xsap | NP_sap | PP_wtemp | NP_temp | Ext_temp | PP_vhum | NP_hum | Ext_hum | |
| zPP_sap | 1 | |||||||
| yNP_sap | 0.692** | 1 | ||||||
| PP_temp | 0.816** | 0.707** | 1 | |||||
| NP_temp | 0.815** | 0.761** | 0.919** | 1 | ||||
| Ext_temp | 0.769** | 0.797** | 0.850** | 0.887** | 1 | |||
| PP_hum | –0.866** | –0.715** | –0.792** | –0.797** | –0.766** | 1 | ||
| NP_hum | –0.744** | –0.723** | –0.712** | –0.817** | –0.763** | 0.795** | 1 | |
| Ext_hum | –0.770** | –0.716** | –0.666** | –0.743** | –0.852** | 0.812** | 0.854** | 1 |
Analyzing the correlation between internal greenhouse environmental factors and the sap flow revealed negative correlations between the internal humidity and sap flow in both greenhouses: r = ‒0.866 for the PP-SCG and r = ‒0.716 for the NP-SCG. A correlation analysis between internal factors and the sap flow showed negative relationships with the internal humidity: r = ‒0.866 in the PP-SCG and r = ‒0.716 in the NP-SCG. Positive correlations were observed between the internal temperature and sap flow, with r = 0.816 in the PP-SCG and r = 0.761 in the NP-SCG. These results indicate that the sap flow is significantly negatively correlated with humidity and positively correlated with the temperature, suggesting that these two variables are the major environmental factors influencing the sap flow.
To quantify their influence further, a multiple linear regression analysis was conducted using internal temperature and humidity as predictors of the sap flow in each greenhouse (Tables 2 and 3). The resulting regression models were as follows:
ypp_sap = 2.956 + 0.043xpp_temp – 0.039xpp_hum
ynp_sap = 0.947 + 0.043xnp_temp – 0.018xnp_hum
Table 2.
Results of the multiple linear regression analysis of paprika sap flow levels in the PP-SCG
| Variable |
Unstandardized coefficients |
Standardized coefficients | t (p) | Tolerance | VIF | |
| B | SE | β | ||||
| (Constant) | 2.956 | 0.151 | 19.537** | |||
| zPP_ytemp | 0.043 | 0.002 | 0.348 | 20.226** | 0.372 | 2.688 |
| PP_xhum | –0.039 | 0.001 | –0.590 | –34.336** | 0.372 | 2.688 |
| F (p) | 3614.389** | |||||
| adj. R2 | 0.795 | |||||
Table 3.
Results of the multiple linear regression analysis for paprika sap flow levels in the NP-SCG
| Variable |
Unstandardized coefficients |
Standardized coefficients | t (p) | Tolerance | VIF | |
| B | SE | β | ||||
| (Constant) | 0.947 | 0.187 | 5.062** | |||
| zNP_ytemp | 0.043 | 0.002 | 0.511 | 20.374** | 0.333 | 3.005 |
| NP_xhum | –0.018 | 0.002 | –0.306 | –12.196** | 0.333 | 3.005 |
| F (p) | 1456.916** | |||||
| adj. R2 | 0.610 | |||||
Both models were highly significant, with F = 3614.389 for the PP-SCG and F = 1456.916 for the NP-SCG. The adjusted coefficient of determination (Adjusted R2) was 0.795 for the PP-SCG and 0.610 for the NP-SCG, indicating that the PP-SCG model exhibited greater explanatory power. Unstandardized coefficients showed that a 1°C rise in the internal temperature led to a 0.043-unit increase in sap flow in both houses, while a 1% RH increase in relative humidity decreased sap flow by 0.039 units in the PP-SCG and 0.018 units in the NP-SCG. Standardized coefficients revealed that internal humidity (β = ‒0.590) was the dominant factor affecting sap flow in the PP-SCG, whereas internal temperature (β = 0.511) played the leading role in the NP-SCG, likely because the NP-SCG relies on natural ventilation, allowing external heat loads to enter directly, with the resulting temperature serving as the primary driver of the increased sap flow velocity (Boulard et al. 1999; Katsoulas et al. 2015). In addition, under highly humid conditions, the water vapor concentration gradient between the leaf and the surrounding air decreases, thereby suppressing transpiration. Even when the stomata remain open, water vapor does not diffuse efficiently, and the tension driving sap flow is weakened (Zhu et al. 2022). This mechanism may explain why, in the NP-SCG, where RH remained high for extended periods, the effect of RH fluctuations was relatively minor. In summary, the PP-SCG’s use of mixed internal and external air, along with positive-pressure maintenance, stabilized the internal conditions of the relative humidity and temperature. As a result, sap flow in the PP-SCG appeared to respond more sensitively to internal environmental changes compared to that in the NP-SCG.
Comparison of growth characteristics in PP-SCG vs. NP-SCG
On August 3, a comparison of growth characteristics between the PP-SCG and NP-SCG revealed significant differences (Fig. 4). In the PP-SCG, plant height was 96.3 cm, the number of nodes was 33.6, the number of leaves was 153, the leaf area per leaf was 47.7 cm2, the fresh weight of the shoot was 688.6 g, and the dry weight of the shoot was 73.6 g. In contrast, the NP-SCG had a plant height of 83.6 cm, 31.1 nodes, 111.4 leaves, a leaf area per leaf of 56.0 cm2, a shoot fresh weight of 611.7 g, and a shoot dry weight of 63.8 g. All differences were statistically significant. However, leaf area per leaf was greater in the NP-SCG, while all other growth parameters were significantly higher in the PP-SCG. Similarly, on August 31, the PP-SCG exhibited significantly higher values for plant height (153.3 cm), the number of nodes (51.7), the number of leaves (203.9), and the leaf area per leaf (50.9 cm2), compared to the NP-SCG, which had the following values: 146.1 cm for plant height, 47.6 nodes, 149 leaves, and 82.3 cm2 of leaf area per leaf. Although the number of leaves was higher in the PP-SCG, the individual leaf area was smaller, likely due to how the diffuse light environment enhances light capture (Wright et al. 2017; Ding et al. 2020). These findings suggest that the relative humidity in the two greenhouses, the crop canopy architecture, and the light environment—particularly the properties of diffuse light—had a substantial impact on plant growth. Previous studies have shown that in a PP-SCG fitted with a diffuse-light covering, light is evenly distributed throughout the canopy, enhancing photosynthesis across all leaf layers and promoting a high-efficiency canopy structure despite narrower individual leaves (Kim et al. 2023). Additionally, Holsteens et al. (2020) reported that diffuse-light coverings in a PP-SCG promote even vertical light distribution, ensuring adequate irradiance for both upper and lower foliage and contributing to efficient canopy-level light interception.
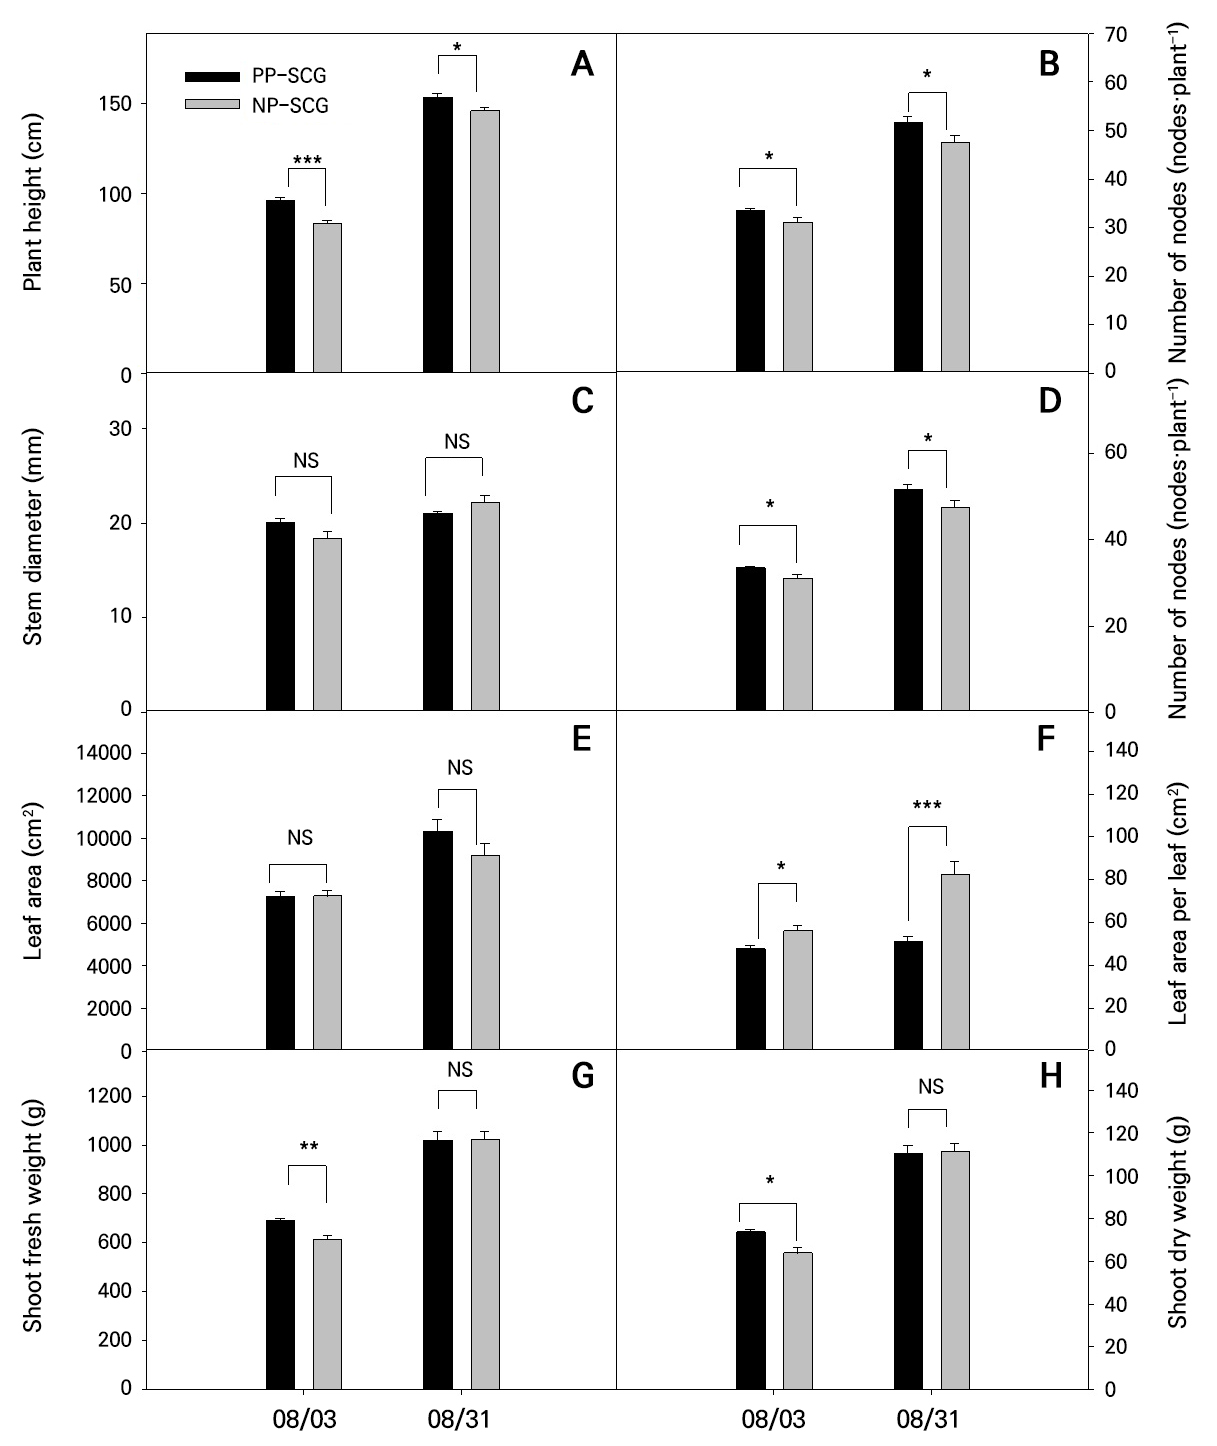
Fig. 4.
Comparison of growth characteristics of paprika between the PP-SCG and NP-SCG: (A) plant height, (B) number of nodes, (C) stem diameter, (D) number of leaves, (E) leaf area, (F) leaf area per leaf, (G) shoot fresh weight, and (H) shoot dry weight. Significance was determined using Student’s t-test. NS, *, **, and *** indicate non-significant or significant differences at p > 0.05, < 0.05, < 0.01, and < 0.001, respectively. Vertical bars represent standard errors (n = 9).
According to the first harvest survey on August 21, the PP-SCG produced an average of 3.6 fruits per plant (average fruit weight: 222.0 g), whereas the NP-SCG produced 2.1 fruits per plant (average fruit weight: 209.2 g), showing significant differences in both the number of fruits harvested and the average fruit weight per plant (Fig. 5). At the subsequent harvest on August 28, the PP-SCG yielded an average of 1.6 fruits per plant (average fruit weight: 211.5 g), while the NP-SCG yielded 0.1 fruits per plant (average fruit weight: 209.0 g), again showing a significant difference. On September 4, the PP-SCG produced an average of 5.4 fruits per plant (average fruit weight: 160.0 g), whereas the NP-SCG yielded 3.5 fruits per plant (average fruit weight: 154.3 g). While the number of fruits was significantly higher in the PP-SCG, the difference in fruit weight was not statistically significant. These results are attributed to the PP-SCG’s lower relative humidity and diffuse light conditions, which promoted evapotranspiration and facilitated even light distribution throughout the plant canopy, thereby enhancing the overall photosynthetic efficiency. It has been reported that uniform light distribution under diffuse light conditions increases assimilate accumulation, accelerating the transition to reproductive growth and increasing the number of fruit sets (Li and Yang 2015; Bao and Sun 2024). Furthermore, the diffuse-light films used in PP-SCGs have been shown to improve light availability and relative humidity throughout the entire growth period of paprika, contributing positively to yield increases (Kim et al. 2023). These characteristics were evident in the present study and resulted in significantly higher PP-SCG yields. Additionally, plants in the PP-SCG that exhibited higher sap flow rates also showed superior growth performance.
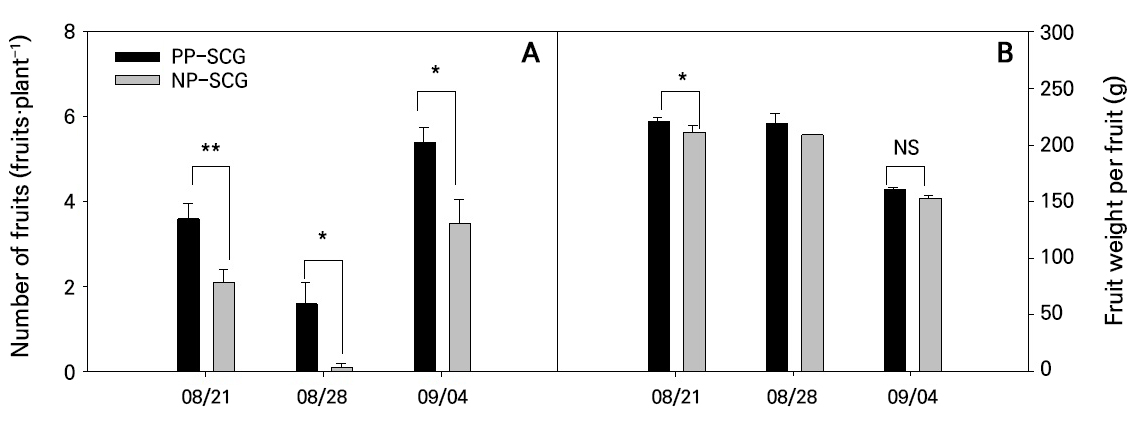
Fig. 5.
Comparison of paprika fruit characteristics between the PP-SCG and NP-SCG: (A) number of fruits per plant, and (B) average fruit weight. Significance was determined using t-tests. NS, *, **, and *** indicate non-significant or significant differences at p > 0.05, < 0.05, < 0.01, and < 0.001, respectively. Vertical bars represent standard errors (n = 10). A statistical analysis for NP-SCG on 08/28 was not conducted because only one fruit was harvested on that date.
However, this study was conducted under summer conditions, and its findings have limitations with regard to their applicability across all four seasons. Seasonal variations in temperatures, solar radiation levels, and the light environment can directly influence crop transpiration and sap flow levels. Therefore, further studies comparing different seasons are needed to validate the generalizability of the results here. In addition, given that the PP-SCG and NP-SCG used different covering materials (low-iron glass vs. diffuse glass), not only structural differences but also variations in the light environment may have interacted to affect physiological responses and yield traits. Thus, these factors should be considered when interpreting the results, and future studies under identical covering materials are necessary to isolate the effects of structural differences.
Despite these limitations, the present study demonstrates that sap flow is not merely an indicator of water movement but is also a reliable growth metric capable of quantifying crop physiological responses in real time. Conventional environmental control has traditionally focused on external factors such as the light intensity, temperature, and humidity. However, integrating sap flow sensors to monitor internal water transport alongside physiological responses would enable a more precise assessment of crop status and facilitate real-time interventions. Such an integrated approach is expected to enhance smart-farm management systems by providing a more accurate reflection of plant physiology responses, surpassing the limitations of control strategies based solely on external conditions.
