

Introduction
Materials and Methods
Greenhouse information and cultivation environment
Poor-environment analysis
Correlation analysis between production and environmental factors
Statistical analysis
Results
Poor environment analysis
Correlation analysis between production and environmental factors
Discussion
Conclusions
Introduction
Paprika (Capsicum annuum L.) is grown 100% in greenhouses in Korea. Its production and production area were 810 thousand tons and 719 ha in 2021, levels which were increased by 11% and 9% compared to those in 2000, respectively (KOSIS, 2023). Paprika is the leading export among fresh fruit vegetables. It is a high-income product with high productivity. Export levels reached 27.4thousand tons and amounted to 82 million dollars in 2021 (KATI, 2023). However, paprika production in Korea has recently decreased. In 2022, the cultivation area for paprika was 705 ha, representing a 2% decrease, and production was 109 tons per ha, a 3% decrease compared to 2021 (KATI, 2023).
KREI (2023) has reported that extraordinarily high temperatures and frequent rainfall recently observed in the Gangwon region in summer are the causes for the decreased paprika production. Heat waves, extended monsoons, typhoons, and droughts frequently threaten crop cultivation during the summer season. The summer temperature in the Gangwon region has increased by approximately 1.2°C compared to that in the 1980s, and the number of heat wave days per year has increased by about 1.8 days compared to the average number per year over the last decade (KMA, 2023b). According to the Korea Meteorological Administration (KMA), the rainy season for the past five years in Gangwon-do lasted from around the end of June to the end of July (26–31 weeks of the year). However, actual rainfall levels over the last two years (2021–2022) were higher in August than during the rainy season.
Paprika cultivation area and production in Gangwon were 258 ha and 22.3 thousand tons in 2021, accounting for 35.9% and 76.7% of the total paprika cultivation area and production, respectively (KOSIS, 2023). Cheorwon (158 ha) was the region producing the largest amount, followed by Pyeongchang (30 ha), Hoengseong (23 ha), and Inje (15.6 ha). The shipping season of Gangwon paprika starts in May and ends in October or November, which plays an essential role in paprika exports to Japan, a major export destination, throughout the year. However, practical production in August and September is clearly lower throughout the shipping period due to environmental conditions in summer from June to August, as described above.
The optimum 24-hour mean temperature for paprika is 19–21°C (Bakker and van Uffelen, 1988). When the 24-hour mean temperature exceeds 24°C, respiration and stem growth will increase. However, rates of falling flowers and fruits will also increase (RDA, 2020). Fruit quality is debased when nighttime temperatures are high due to the lack of the translocation of assimilation products to fruits. The photosynthesis rate of C3 plants is at its peak when the air temperature is at 25°C. It decreases rapidly as the temperature reaches approximately 30°C in general (Bakker, 1989). The decreased photosynthetic rate is caused by an increase in the percentage of carbon emitted from the leaves, which results in decreased fruit weight, thinning, and a loss of firmness (Bakker, 1989). In addition, a plant with high-temperature stress produces a strong oxide that breaks down cells, disrupting cell membranes, proteins, and DNA, among other substances (Dat et al., 2000). In addition, when the nighttime temperature is high or when the light is insufficient after flower bud differentiation, the length of the flower stock becomes longer than the filament, with pollination and fertilization tending to be poor (Lim, 2009; RDA, 2020).
From March through October of the last three years, the average 24-hour mean temperature in Cheorwon and Inje was around 22–23°C, with a maximum temperature of 28°C (KMA, 2023a). For the same period, the temperature inside greenhouses increased to 35°C. During the period from fruit set to harvest (50–90 days after transplant), inappropriate environmental management (e.g., temperature, light) within greenhouses caused a decrease in production (Adams et al., 2001; Lee et al., 2014). To alleviate the effects of high temperatures on paprika production, there have been various attempts, such as shading lights with screens, fogging, cooling roots zones, low-iron diffuse glass greenhouse (Kim et al., 2023a), or selection of appropriate cultivars (Kim et al., 2023c). The temperature was lower at 2–3°C on average if fogging or airflow fans were used (Rhee et al., 2015). Furthermore, a root zone cooling system was successful in lowering the substrate temperature by 1.8–5.0°C (Choi et al., 2014). However, those cooling systems use considerable amounts of energy. The implementation of screens not only reduces energy use but also decreases temperatures by 2°C, 5°C, and 3°C on the leaves, fruits, and flowers, respectively (Kim et al., 2022). However, such screens also reduce the photosynthetic photon flux density (PPFD) by 20%.
It appears to be necessary for producers to select a suitable cooling system while also considering the energy cost. To do this, it is necessary to prioritize environmental factors that have a greater influence on production. Thus, this study attempted to analyze an unpleasant environment that could decrease the production of paprika in the summer in Gangwon-do, Korea.
Materials and Methods
Greenhouse information and cultivation environment
This study was conducted at four commercial farms exporting summer paprika (Capsicum annuum L.), two in Cheorwon-gun (A, B) and two in Inje-gun (C, D) in Gangwon-do, for three years from 2020 to 2022. The size of each greenhouse varied: 3,570 m2 for ‘A’, 3,465 m2 for ‘B’, 4,290 m2 for ‘C’, and 1,457 m2 for ‘D’. Airflow fans and two-layered screens (shading and insulation) were installed at each greenhouse. The greenhouse environment in each case was managed with a complex environmental control system (MAXIMIZER 4.2.0., build 4771 Version, Priva BV, Netherlands). It logged temperature and solar radiation data automatically. The planting density was similar at 6.6–7.0 stem/m2 in a hydroponic cultivation system using rockwool substrates (L × W × H : 120 × 12 × 8 cm, Grodan, Netherlands) (D) or coir substrates (L × W × H : 100 × 15 × 14 cm, Duck Yang, Sri Lanka) (A, B, and C). Irrigation management used a cumulative solar radiation control strategy.
Table 1 shows the paprika cultivation information of the investigated greenhouses for three years. The paprika varieties grown were red-colored varieties (‘Nagano’ and ‘Keessie’, Rijk Zwaan, Netherlands; ‘Lyker’, Monsanto, USA; ‘Viñales’ and ‘Mavera’; Enza Zaden, Netherlands). In A, transplanting took place on March 13, 2020, March 1, 2021, and March 1, 2022. In B, it occurred on March 16, 2020, March 18, 2021, and March 13, 2022 in Cheorwon. Transplanting events in C were done on February 18, 2021, and February 3, 2022. In D, the activity occurred on February 1, 2020, and February 18, 2021 in Inje. The number of days required from the transplanting date to the first harvest date ranged from 73 and 88, showing no notable differences between the farms. However, there was a difference in production per unit area (m2) by greenhouse, which was assumed to be attributable to variations in crop management and technology as well as equipment functioning capabilities.
Table 1.
Farming information of the investigated farms located in Cheorwon (CHR) and Inje (IN), Gangwon-do, South Korea from 2020 to 2022
| Year | Provincez | Farm code | Variety |
Transplanting (date) |
The first harvest (date) |
Days requiredy (DAT) |
Production (kg·m-2) |
| 2020 | CHR | A | Nagano | Mar. 18 | May 27 | 71 | 10.4 |
| B | Nagano | Mar. 16 | May 30 | 76 | 10.3 | ||
| IN | D | Keessie | Jan. 7 | Apr. 4 | 88 | 21.3 | |
| 2021 | CHR | B | Keessie | Mar. 14 | May 25 | 73 | 15.1 |
| IN | C | Nagano | Feb. 28 | May 13 | 75 | 12.6 | |
| D | Lyker | Feb. 1 | Apr. 26 | 85 | 23.1 | ||
| 2022 | CHR | A | Mavera | March 7 | May 25 | 80 | 12.7 |
| B | Keessie | Mar. 15 | May 26 | 73 | 15.6 | ||
| IN | C | Nagano | Feb. 7 | May 3 | 86 | 13.8 |
Poor-environment analysis
We used temperature and solar radiation data based on days after transplant (DAT) of each greenhouse to assess inadequate cultivation environmental factors leading to low production of paprika in the summer. The environments in the paprika greenhouses during the cultivation period were classified into quartile groups (Q1, high temperature-strong light; Q2, low temperature-strong light; Q3, low temperature-low light; and Q4, high temperature-low light) using the optimal temperature range for paprika cultivation and the average of the median of solar radiation in the surveyed greenhouses. According to the above classification, we present the daily greenhouse environments between transplanting and the 24th week in a quartile scatter graph. Temperatures were divided into high and low temperatures based on 27°C during the daytime and 21°C at night (Bakker and Uffelen, 1988). The standard to distinguish between high and low light was 15 MJ·m-2, the average of the median of the daily cumulative solar irradiance in nine cropping seasons investigated in this research.
Correlation analysis between production and environmental factors
Monthly production was calculated by converting the monthly harvest data (June, July, August, and September) of nine cultivation seasons into the production per unit area (kg·m-2). Using the bivariate Pearson correlation analysis approach, we initially analyzed the relationship between monthly production and total production. We then analyzed the relationship between environmental parameters and monthly production.
The numbers of hours the plants were exposed to unfavorable daytime and nighttime temperatures (daytime temperature > 27°C and nighttime temperature > 21°C) and integrated solar radiation (ISR) were subjected to a correlation study. We accumulated environmental data in increments of 30 days, i.e., 30 DAT (1–30 days), 60 DAT (1–60 days), 90 DAT (1–90 days) and up to 210 DAT (1–210 days), to determine which growth stage was most closely associated with paprika production when a plant was exposed to an unfavorable environment.
Statistical analysis
SPSS (SPSS Statistics 26, IBM, Armonk, NY, USA) was used for all data analyses. Significance testing was conducted using a two-way analysis of variance (ANOVA). Means were compared using Duncan’s multiple range test (DMRT) at a confidence level of 95% (p < 0.05). Correlations between production and environmental factors were evaluated by means of a bivariate Pearson correlation analysis at p < 0.05 because both production and environmental data were time-series continuous data (Chang et al., 2017).
Results
Poor environment analysis
Table 2 shows the monthly 24-hour mean, daytime, and nighttime temperatures of the four farms from March to September for three years (2020–2022). Farm ‘A’ had lower monthly temperatures and farm ‘D’ had mostly higher monthly temperatures in terms of average, daytime, and nighttime temperatures compared to the other farms. The temperature range was from 17 to 26°C, not outside of the optimal range for paprika cultivation (RDA, 2020).
Table 2.
Monthly Average Temperatures (AT, °C), Average Daytime Temperatures (DT, °C), and Average Nighttime Temperatures (NT, °C) in the Four Greenhouses in Cheorwon (CHR) and Inje (IN), Gangwon-do, Korea for Three Years (2020‒2022)
| Province |
Farm code | Mar | Apr | May | Jun | Jul | Aug | Sep | ||||||||||||||||||||
| AT | DT | NT | AT | DT | NT | AT | DT | NT | AT | DT | NT | AT | DT | NT | AT | DT | NT | AT | DT | NT | ||||||||
| CHR | A | 17.7 | 20.6 | 14.8 | 20.5 | 22.4 | 18.2 | 20.5 | 21.7 | 18.4 | 21.6 | 23.5 | 18.5 | 23.8 | 25.6 | 20.9 | 23.4 | 25.0 | 21.3 | 20.8 | 22.9 | 18.4 | ||||||
| B | 19.7 | 22.0 | 17.3 | 20.7 | 23.1 | 17.6 | 21.3 | 23.3 | 18.3 | 22.4 | 24.1 | 19.6 | 24.0 | 25.6 | 21.8 | 23.6 | 25.1 | 21.7 | 20.9 | 22.7 | 18.9 | |||||||
| IN | C | 20.7 | 22.7 | 18.6 | 21.1 | 23.1 | 18.7 | 21.5 | 23.5 | 18.7 | 22.3 | 24.0 | 19.4 | 25.0 | 26.8 | 22.0 | 23.2 | 25.0 | 21.0 | 19.8 | 21.8 | 17.4 | ||||||
| D | 21.1 | 22.8 | 19.2 | 21.0 | 22.9 | 18.7 | 21.4 | 23.1 | 18.7 | 21.7 | 23.9 | 18.7 | 23.1 | 25.4 | 20.1 | 23.3 | 24.9 | 21.0 | 20.9 | 22.8 | 18.2 | |||||||
| Significancez | *** | *** | *** | * | * | *** | *** | *** | ** | ** | ns | *** | *** | ** | *** | ns | ns | ns | *** | *** | *** | |||||||
Table 3 shows the monthly maximum solar radiation and ISR of the four farms from March to September for the three years of this study (2020–2022). The maximum solar radiation was within the range of 422–763 W·m-2. ISR was within the range of 10–18 MJ·m-2. The trend here was similar to that of the temperature data, with farm ‘A’ having lower max solar radiation and ISR levels than the other farms. The maximum solar radiation and ISR were relatively high for farm ‘D’, although they were not significantly different among the ‘B’, ‘C’, and ‘D’ farms. A notable point was that solar radiation and ISR were decreased in August by 40% compared to those in July on all four farms.
Table 3.
Monthly Averaged Maximum Solar Radiation (Max, W·cm-2) and Integrated Solar Radiation (ISR, MJ·m-2) in the Four Greenhouses in Cheorwon (CHR) and Inje (IN), Gangwon-do, Korea for Three Years (2020‒2022)
| Province |
Farm code | Mar | Apr | May | Jun | Jul | Aug | Sep | |||||||||||||
| Max | ISR | Max | ISR | Max | ISR | Max | ISR | Max | ISR | Max | ISR | Max | ISR | ||||||||
| CHR | A | 473.1 by | 10.8 b | 580.1 b | 14.0 b | 568.6 b | 14.1 b | 542.7 b | 13.4 b | 506.8 c | 12.5 c | 422.6 b | 9.3 b | 485.0 b | 11.0 b | ||||||
| B | 615.1 a | 13.7 a | 772.3 a | 18.1 a | 763.8 a | 18.2 a | 727.4 a | 17.4 a | 706.8 b | 16.9 b | 578.6 a | 11.6 a | 663.3 a | 13.2 a | |||||||
| IN | C | 576.5 a | 13.1 a | 725.1 a | 17.7 a | 737.0 a | 18.5 a | 695.6 a | 16.6 a | 731.1 b | 17.3 b | 558.3 a | 12.3 a | 614.0 a | 13.5 a | ||||||
| D | 619.5 a | 15.3 a | 734.5 a | 17.8 a | 719.0 a | 17.5 a | 733.6 a | 18.0 a | 822.7 a | 20.7 a | 527.3 a | 12.1 a | 626.8 a | 13.7 a | |||||||
| Significancez | ** | ** | *** | *** | *** | *** | *** | *** | *** | *** | *** | ** | *** | * | |||||||
As described above, the average daytime and nighttime temperatures of the ten growing seasons were within the optimal temperature range for paprika growth from transplanting to the end of cultivation. In Cheorwon, where the transplanting was done in March, the daytime maximum temperature exceeded 27°C with an increase of 4°C before 15 DAT. It was slightly above 29°C from 118 to 169 DAT (51 days) (Fig. 1A). In addition, the highest nighttime temperature was in the range of 23–25°C, 2–4°C higher than 21°C every day from 105 to 170 DAT (65 days) (Fig. 1B).
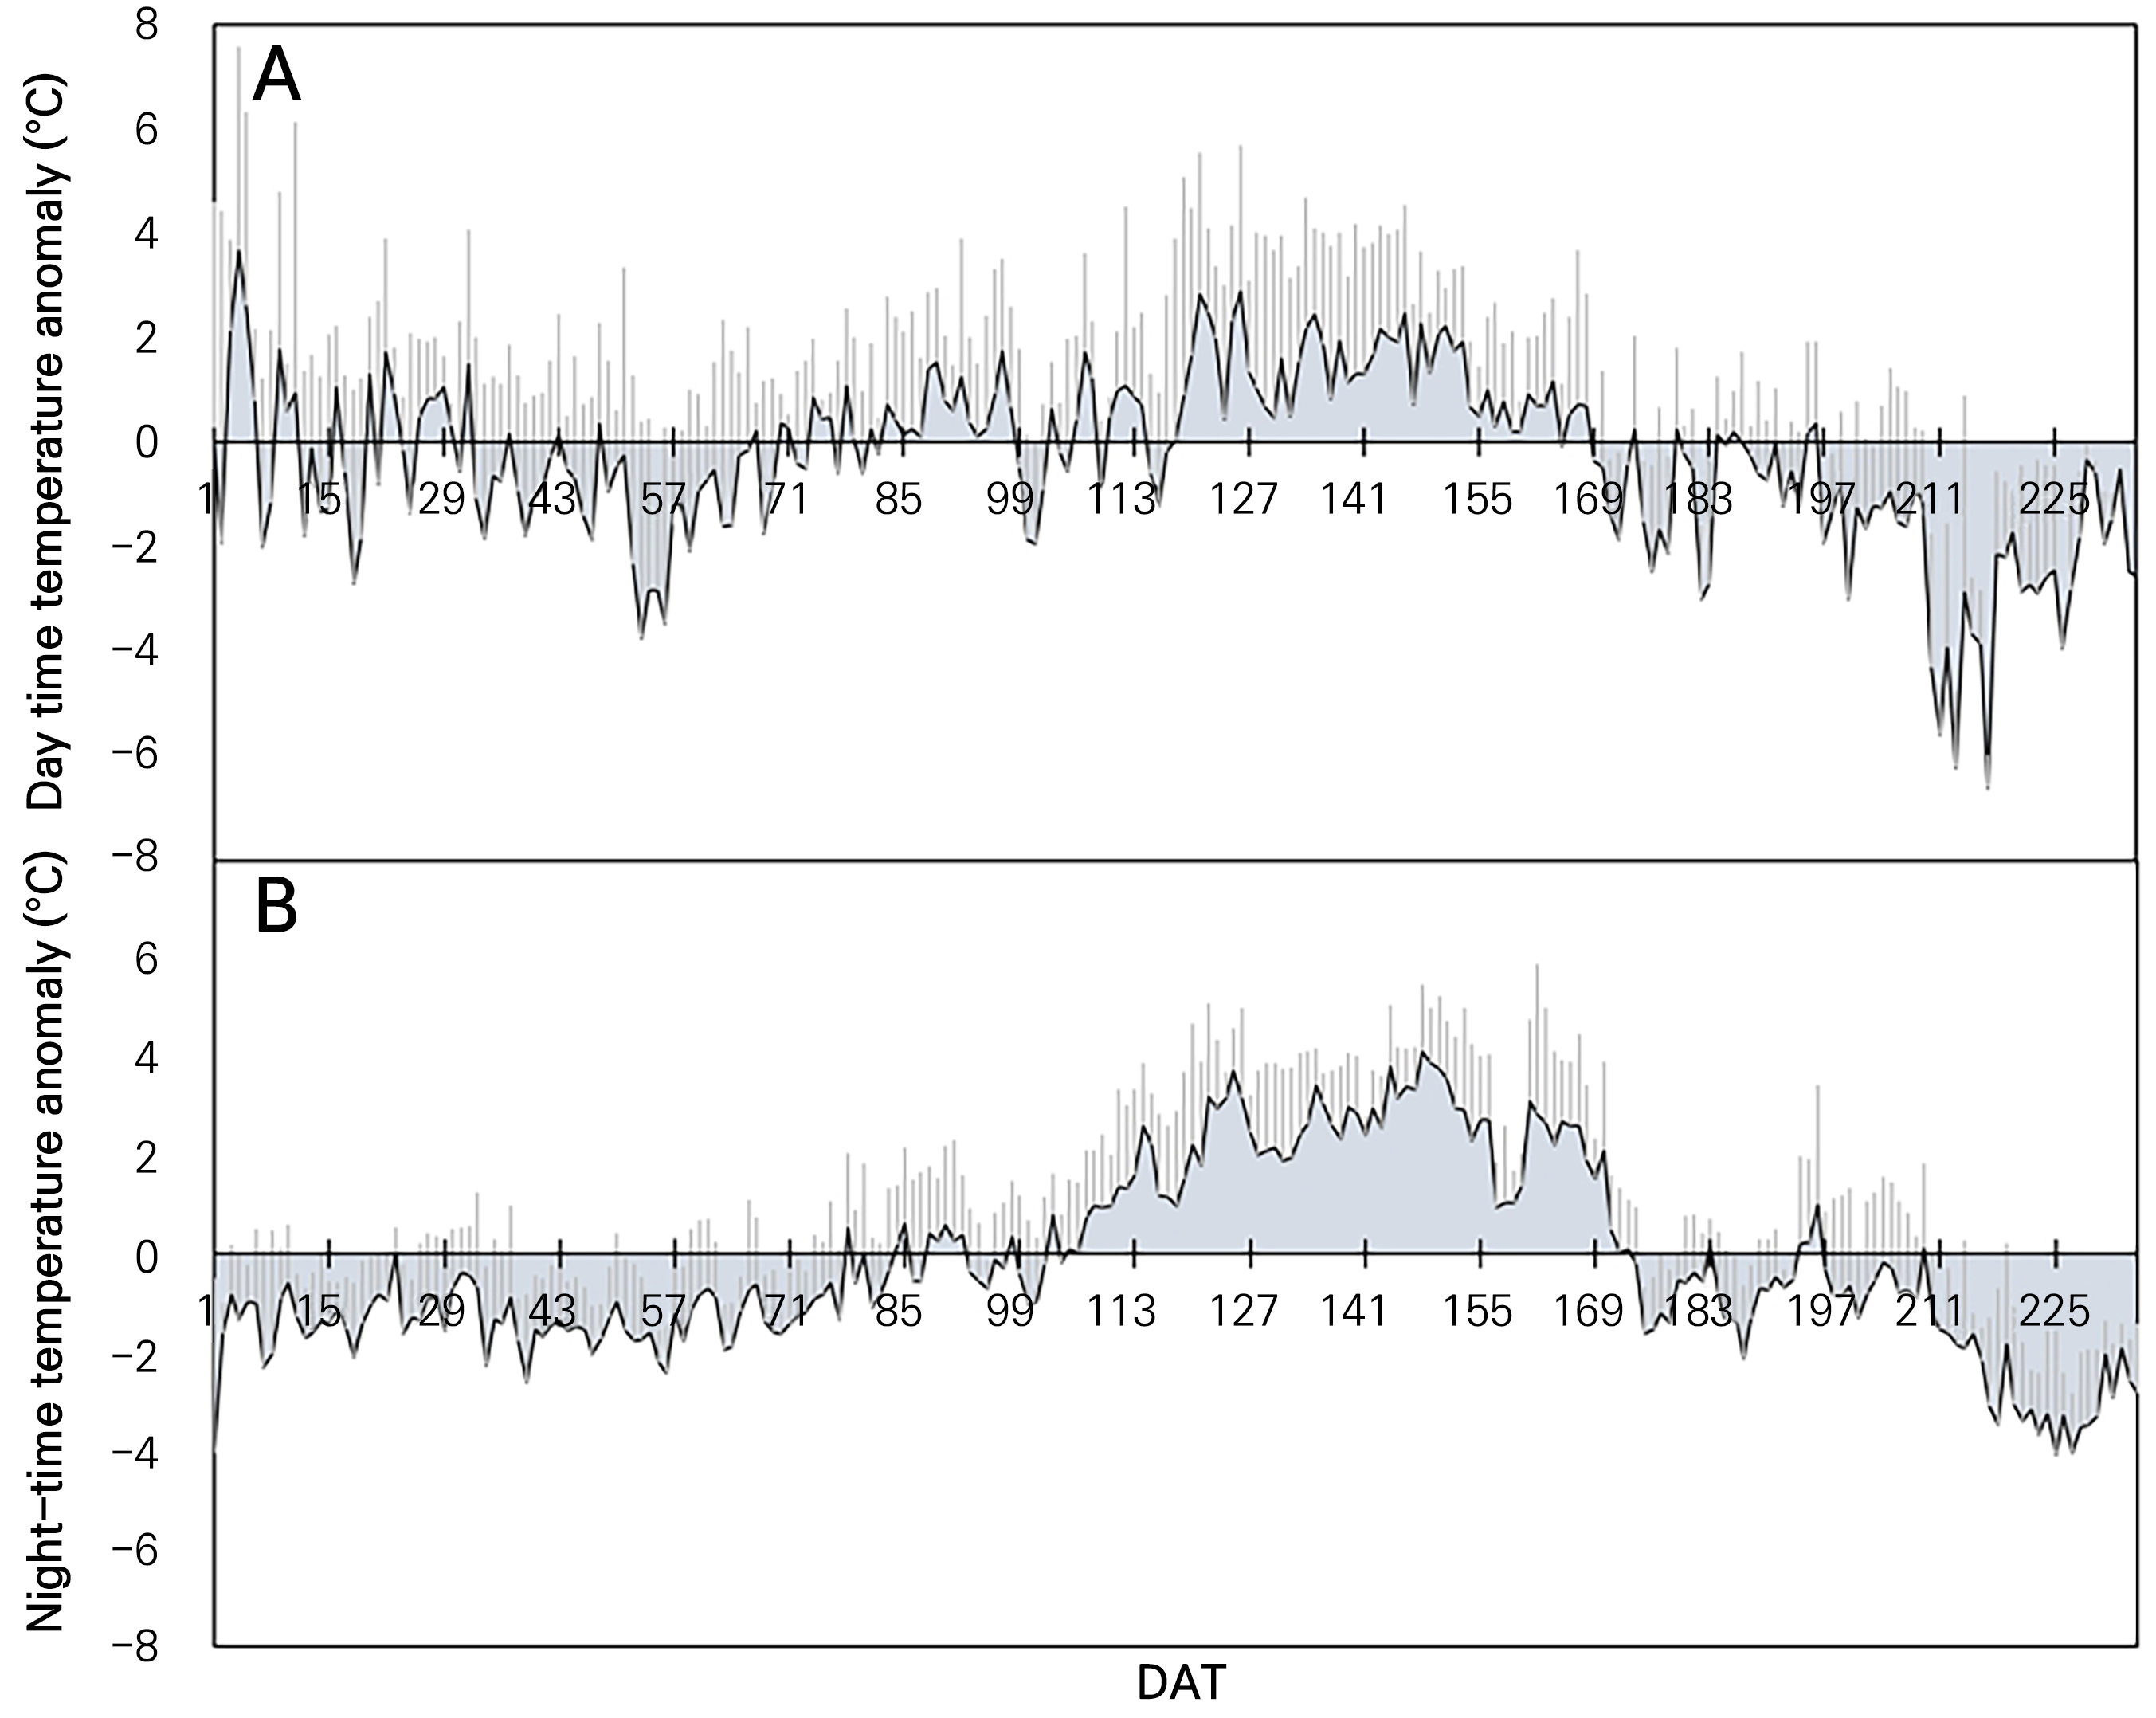
Fig. 1.
Difference in the daytime maximum temperature compared to 27°C (A) and in the nighttime maximum temperature compared to 21°C (B) for two summer-paprika-producing farms located in Cheorwon from one day after transplanting (DAT) to 235 DAT for three years (2020‒2022). Bars indicate the standard deviations.
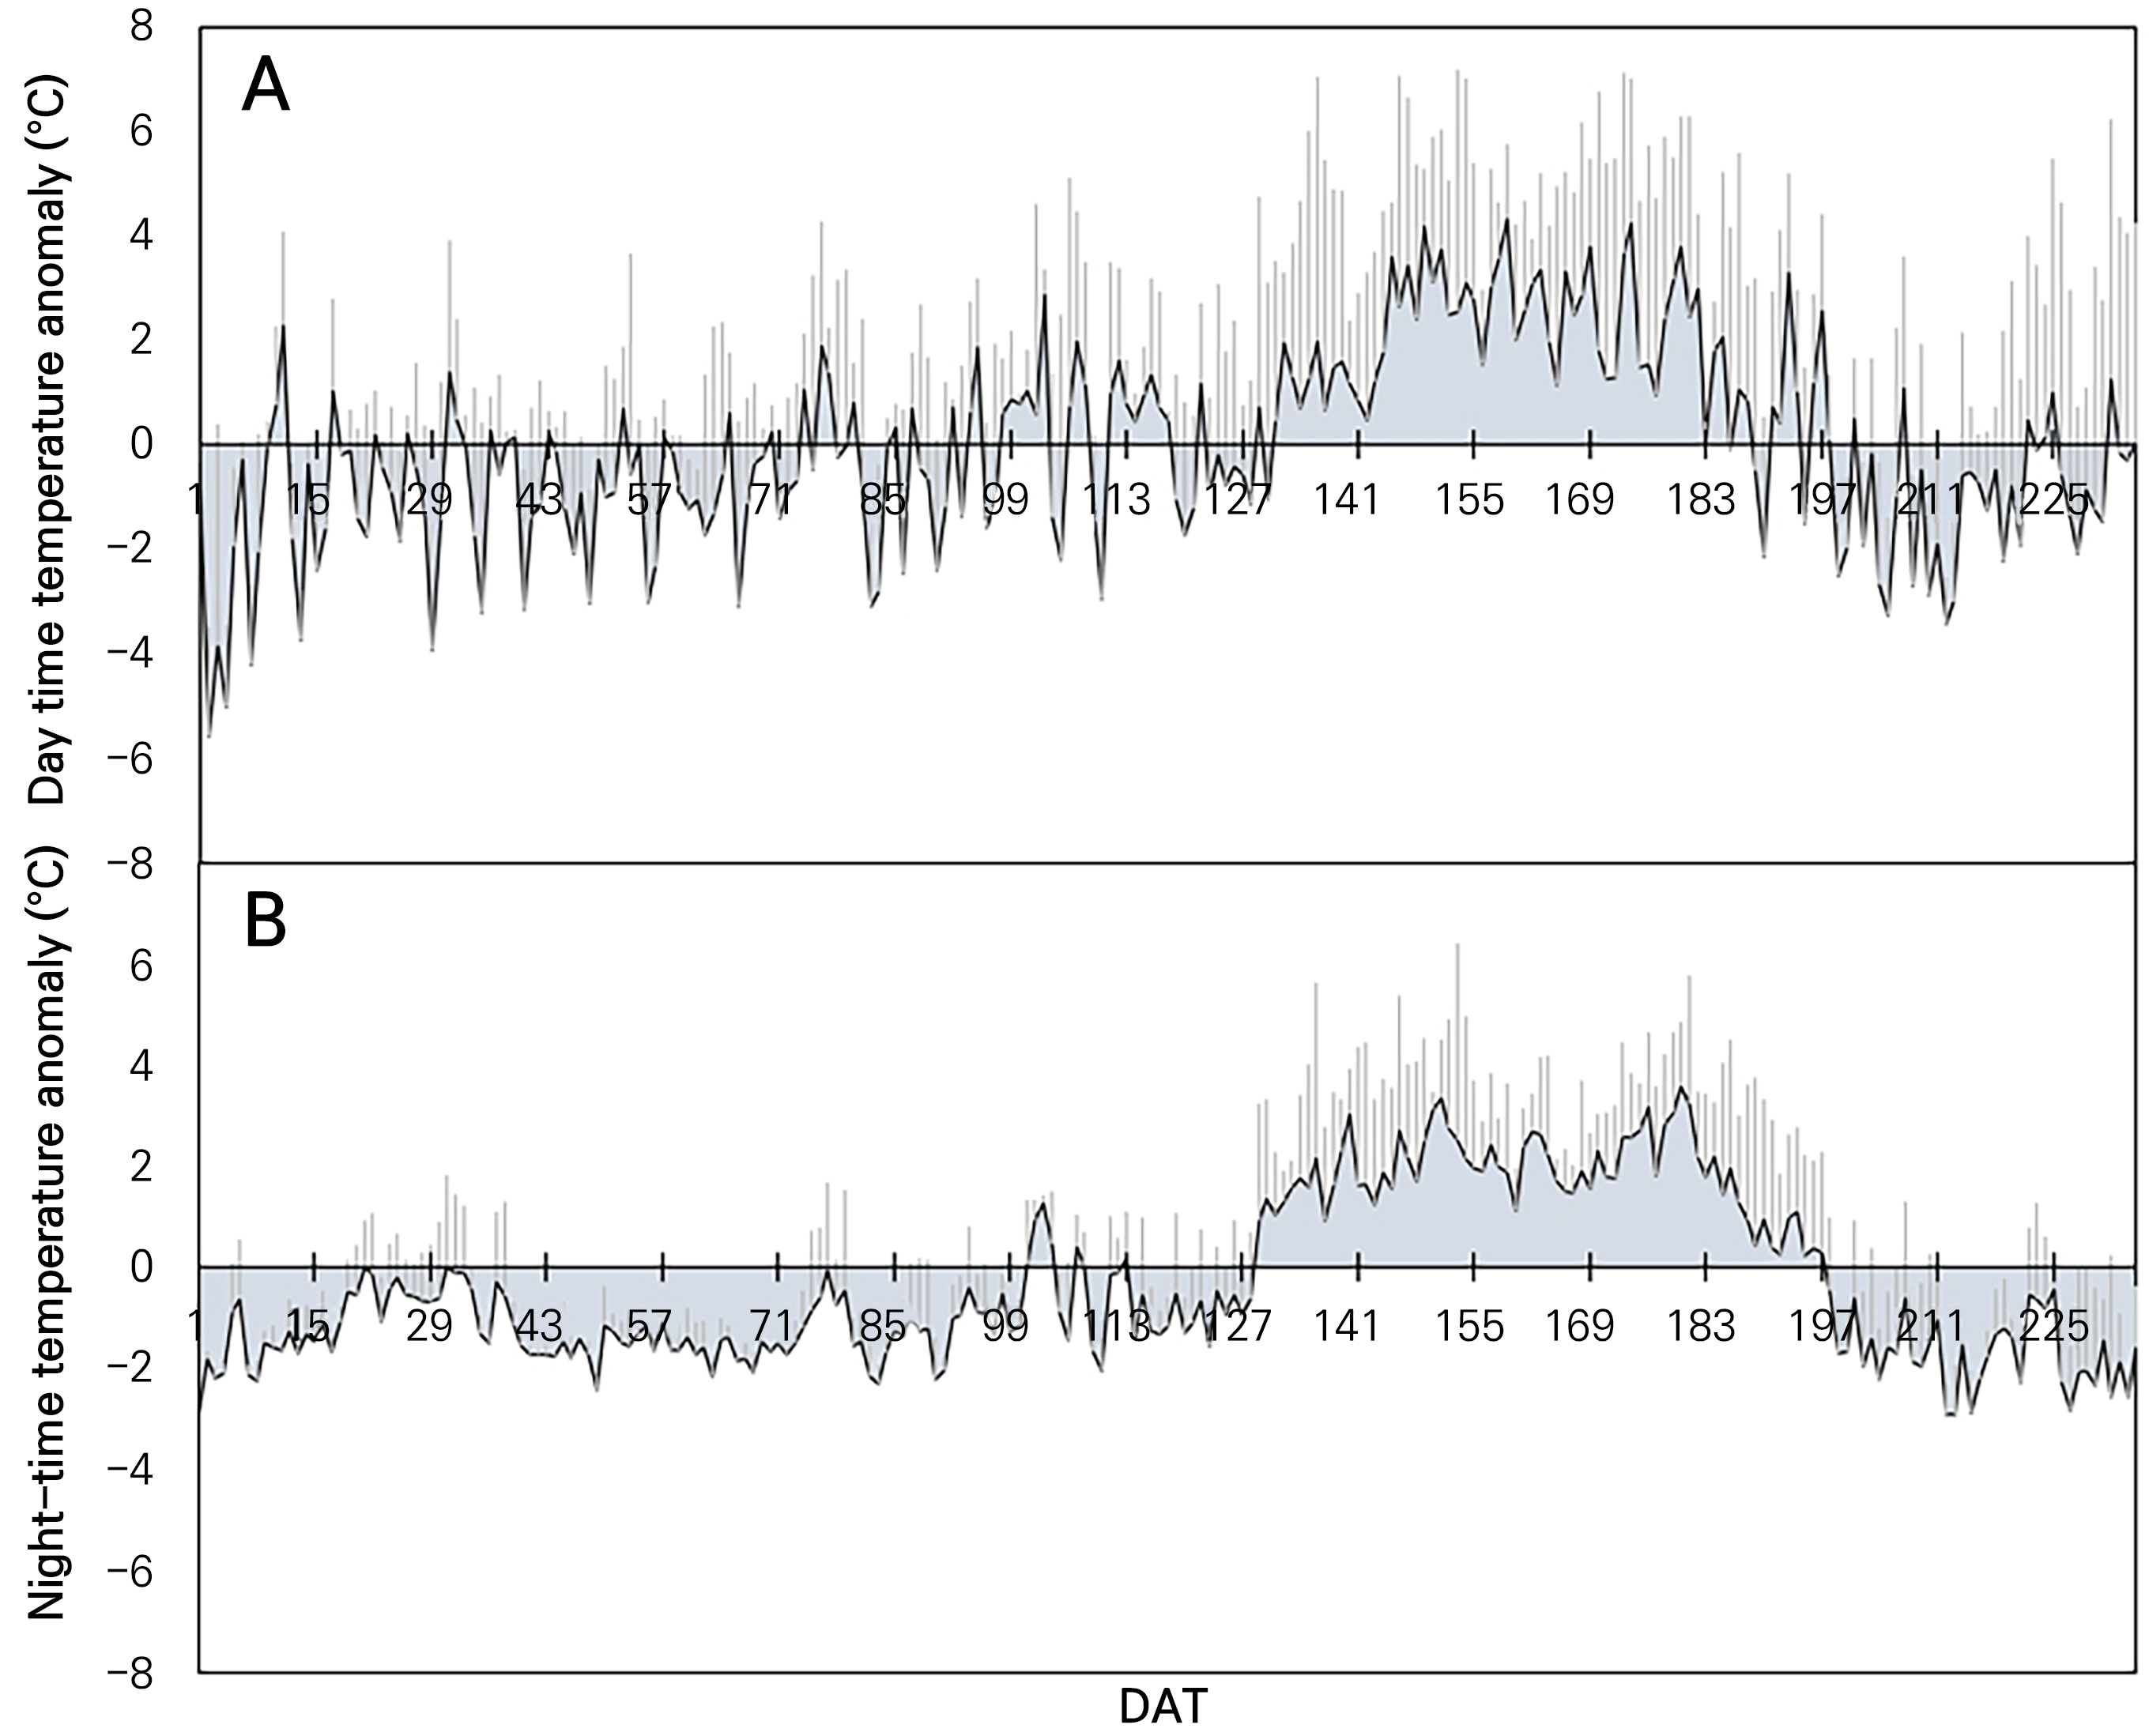
Fig. 2.
Difference in the daytime maximum temperature compared to 27°C (A) and in the nighttime maximum temperature compared to 21°C (B) for two summer-paprika-producing farms located in Inje from one day after transplanting (DAT) to 235 DAT for three years (2020‒2022). Bars indicate the standard deviations.
For Inje, where transplanting was done in February, the daytime temperature at the beginning of the growth stage was lower than that of Cheorwon. Nevertheless, the daily maximum temperature exceeded the optimum range from 131 to 185 DAT (54 days) (Fig. 2A). The maximum temperature at night was high every day from 129 to 197 DAT (68 days) (Fig. 2B). It exceeded approximately 4°C both day and night. From June to August, paprika was subjected to high daytime and nighttime temperatures of 110–170 DAT in Cheorwon-gun and 130–190 DAT in Inje-gun.
When the environment was divided into four categories using the maximum temperature and ISR, 17% of the 24 weeks after transplanting had a maximum temperature of 27°C or higher with an ISR of 15 MJ·m-2 or relatively low (below average) (Fig. 3). High temperatures and low light weeks tended to occur in the fifth week (about early March) and during the 22nd to 24th weeks (around mid-late July to early August).
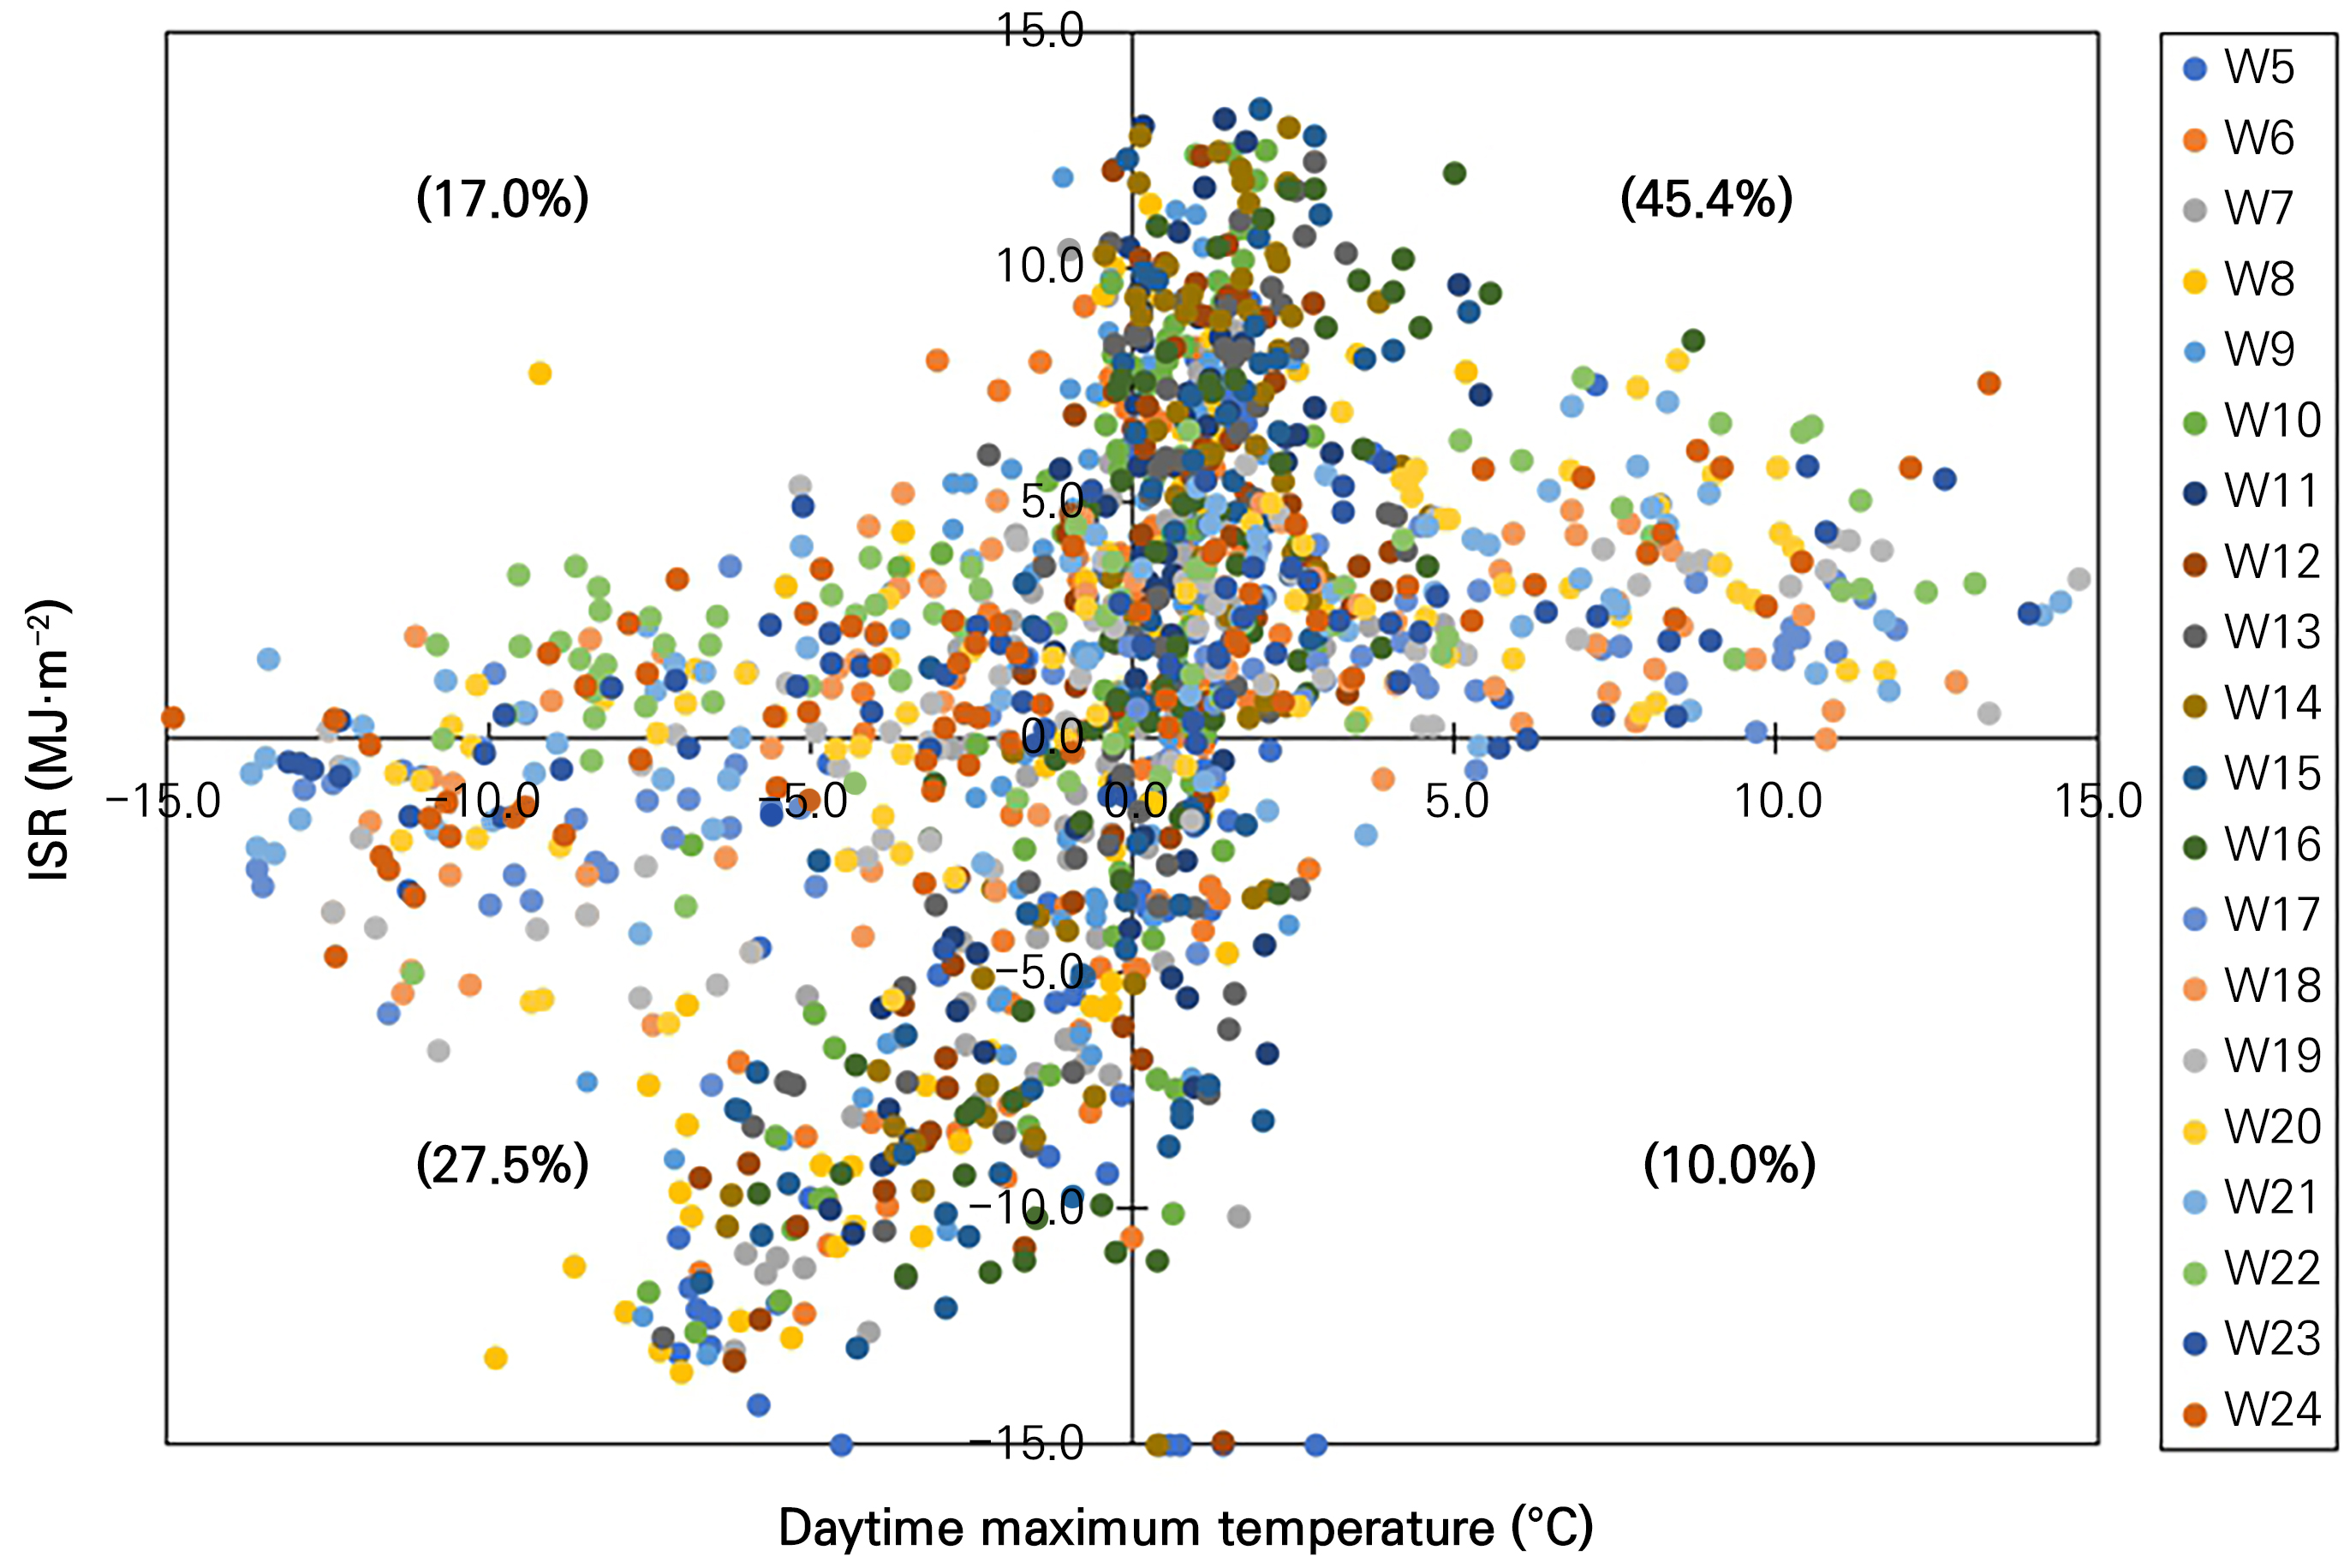
Fig. 3.
Weekly daytime maximum temperature and integrated solar radiation (ISR) for the whole cultivation period for three years (2020-2022), divided into quartile groups: Q1, high-temp. and high-ISR; Q2, low-temp. and high-ISR' Q3, low-temp. and low-ISR; and Q4, high-temp. and low-ISR. '0.0' indicates a temperature of 27°C or 15 MJ·m-2. The week of transplanting was the first week.
Correlation analysis between production and environmental factors
As shown in Fig. 4, we statistically analyzed nine of the ten cultivations for monthly production. Total production differed by greenhouse each year. Regardless of the greenhouse conditions, the typical trend of monthly fluctuation in production was noted throughout the year. The average value of each month’s production from nine cultivations was significantly higher in June, followed by July and August. It was lowest in September.
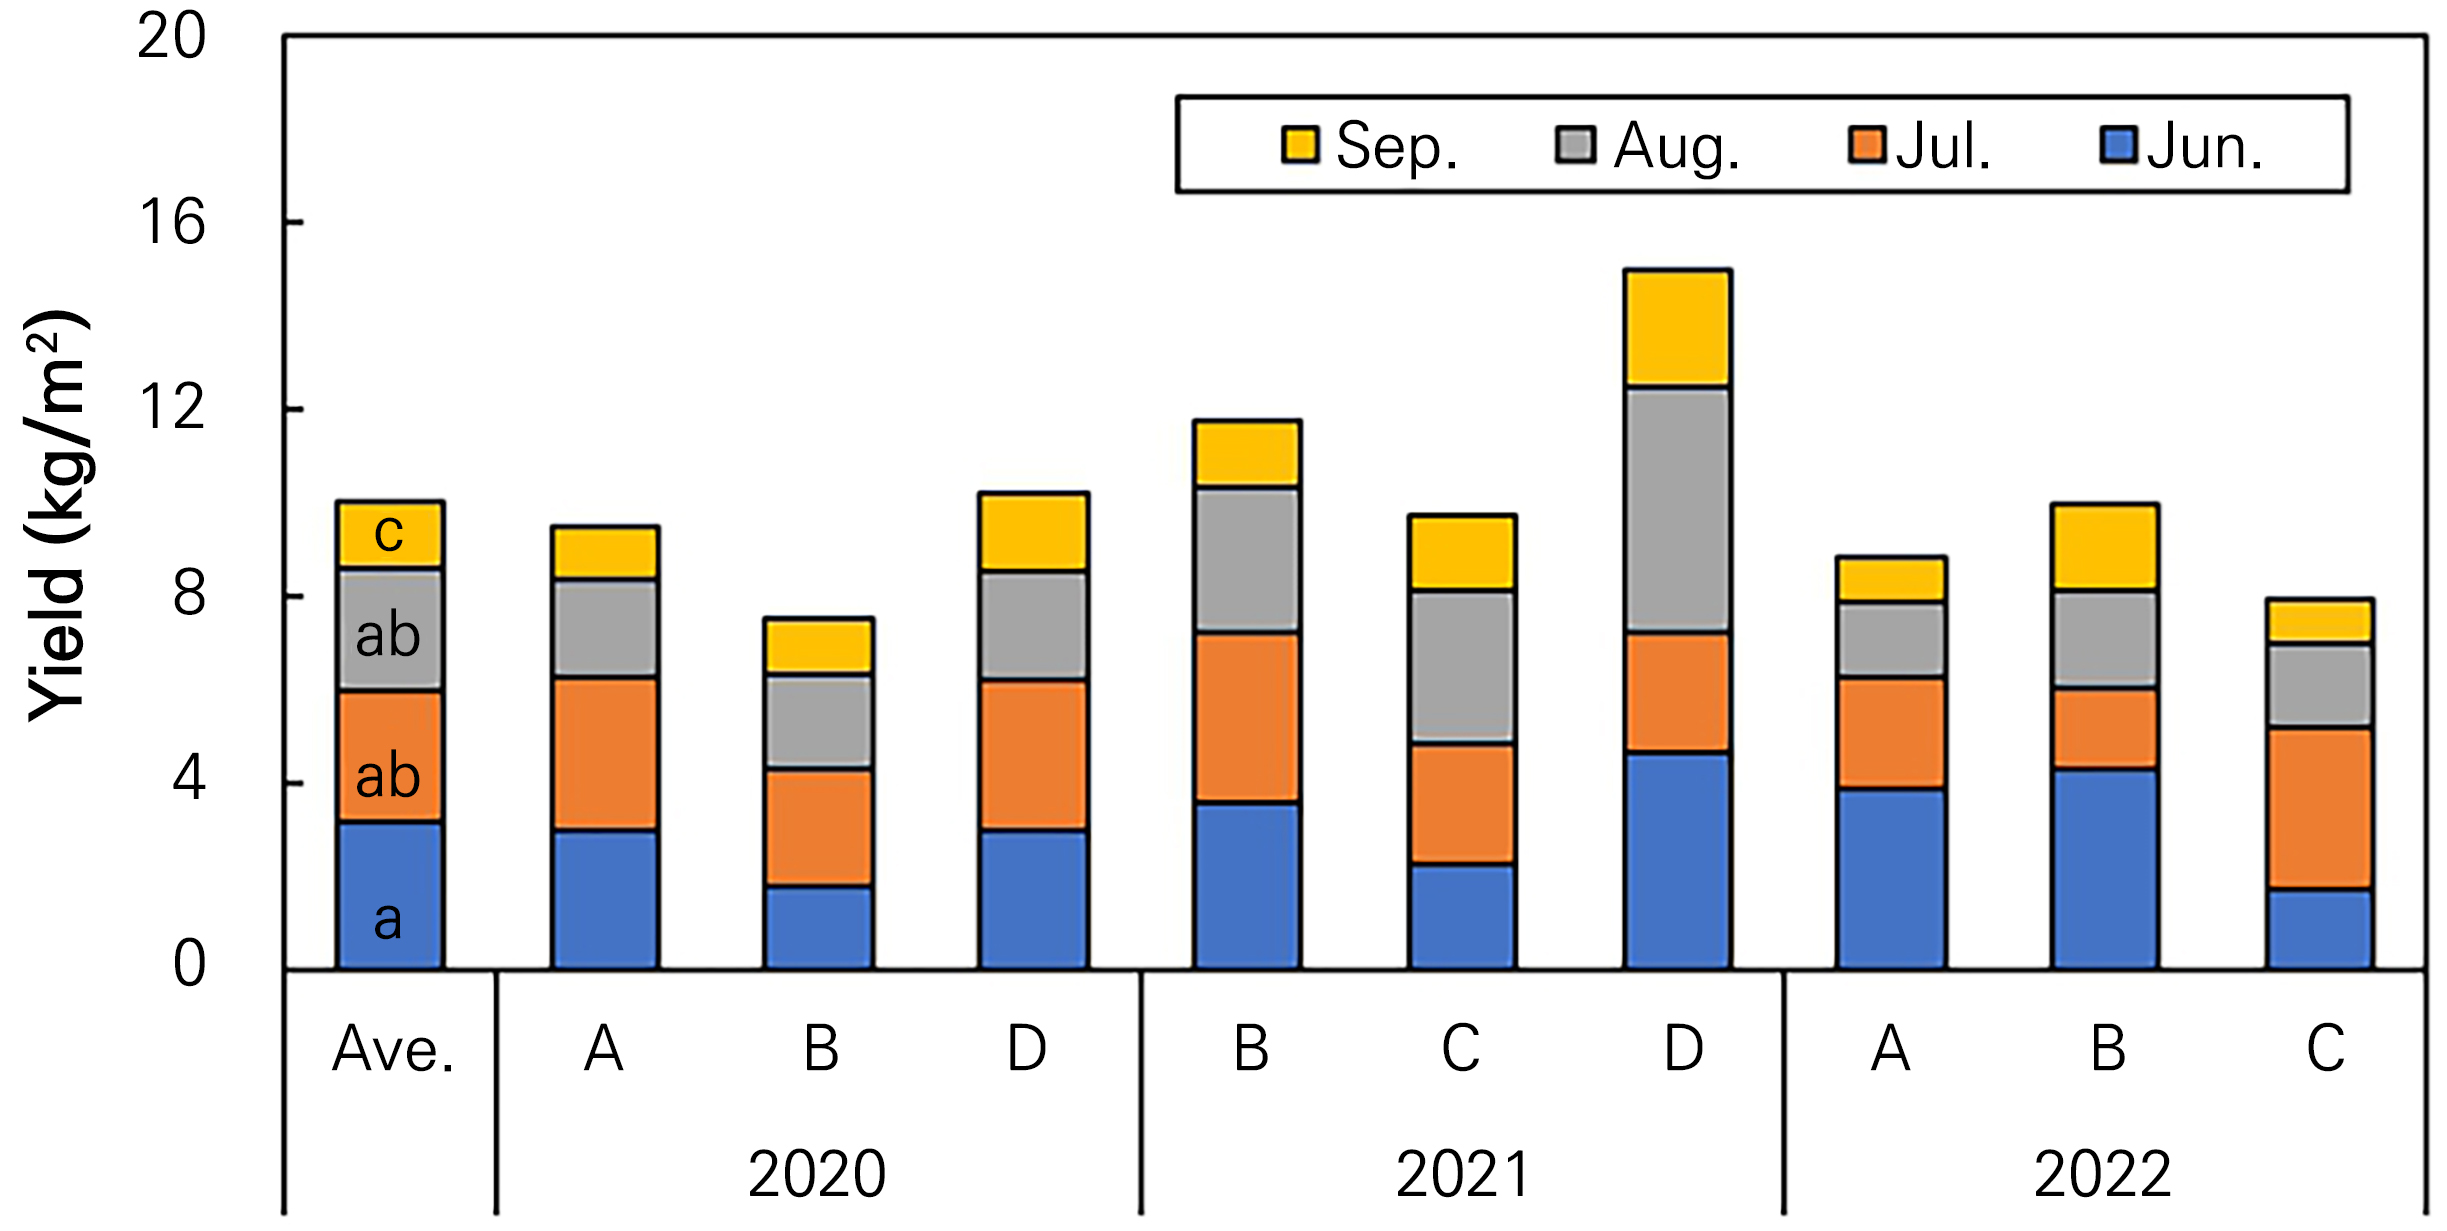
Fig. 4.
Monthly production by farm and year. Data significance was tested only for the average production of nine cultivations. Different letters indicate significant differences according to Duncan’s multiple range test at p < 0.05 (n = 9). A: farm in Cheorwon, B: farm in Cheorwon, C: farm in Inje, and D: farm in Inje.
Pearson’s correlation analysis between monthly production demonstrated a strong positive relationship (correlation coefficient = 0.875) between total production and September production, which was significant at p < 0.01 (Table 4). Moreover, September production had a weak negative relationship (correlation coefficient = ‒0.428) with July production which was not statistically significant.
Table 4.
Pearson correlation analysis results of total production and monthly production
| June | July | August | September | |
| Total | 0.347 | ‒0.735 | 0.170 | 0.875**z |
| June | 0.141 | 0.643 | 0.457 | |
| July | 0.395 | ‒0.428 | ||
| August | 0.351 |
Table 5 shows the correlation between the environment and monthly production. Production in June, July, or August was not significantly related to the number of hours of exposure to higher temperature at daytime, nighttime, or the ISR. However, September production had a strong negative relationship with the number of hours of exposure to high temperatures at daytime.
Table 5.
Pearson correlation analysisz results of environmental factors and monthly production
| Month | 120DAT | 150DAT | 180DAT | 210DAT | |||||||||||
| DT | NT | ISR | DT | NT | ISR | DT | NT | ISR | DT | NT | ISR | ||||
| Jun. | nsy | ns | ns | - | - | - | - | - | - | - | - | - | |||
| Jul. | - | - | - | ns | ns | ns | - | - | - | - | - | - | |||
| Aug. | - | - | - | - | - | - | ns | ns | ns | - | - | - | |||
| Sep. | - | - | - | - | - | - | - | - | - | ‒0.962* | ns | ns | |||
Discussion
To determine environmental factors causing low productivity of paprika in summer, we analyzed monthly production levels of commercial paprika greenhouses in Cheorwon-gun and Inje-gun and determined the maximum daytime and nighttime temperatures and ISR in these greenhouses for each cultivation event from 2020 to 2021.
Fluctuations in yields are typical during paprika cultivation (Heuvelink and Marcelis, 2002). Table 4 shows the production fluctuating orientation, with an inverse relationship between July and September production (not statistically significant). However, the production of summer paprika in this research was highest in June. It then gradually decreased in July, with the lowest production coming in September (Fig. 4). That was similar to the production characteristics of paprika in Gangwon-do (Kim et al., 2021). The highest production is likely in June because transplanting is done in February or March and the first harvest occurs during late May or early June. The greenhouse environment is suitable for paprika cultivation during the first harvest season. After a paprika plant fruited, showing approximately three or four fruits at 12 weeks (after the mid-June), the air temperature began to increase. Kim et al. (2023b) also reported that the pattern of paprika production in Gangwon-do is due to an unfavorable environment with high temperatures and low ISR levels during summer.
In Korea, summer cultivation of paprika usually begins with transplanting in March, followed by flowering and fruiting in April to May and harvesting from June when the heat wave begins. Because it takes 50–60 days from fruit-set to harvest, the environment from late June to August has an influence on September productivity (Table 5). Therefore, if greenhouse environment management is insufficient during the high-temperature period, September production is likely to be low. Kleijbeuker and Lee (2019) reported that Korean paprika has a high production level in the early stages of growth, after which it gradually decreases. In the Netherlands, it gradually increases in later stages of growth, eventually increasing the total production. Jeong et al. (2009) noted that the reason for the higher production in the Netherlands than in Korea is the consistent temperatures within the greenhouses in the Netherlands, unlike those in Korea.
Maintaining a consistent temperature in paprika cultivating greenhouses in summer is done with airflow fans and screens, which are somewhat limited in terms of their ability to control the temperature. Even when the mean temperature of a greenhouse is adequately maintained for 24 hours, there may be a wide range of fluctuations in temperature control. This could occur if the daytime temperature suddenly exceeds 27°C or if the nighttime temperature rises above 21°C (Figs. 2 and 3) (Kim et al., 2023b).
As the seasons change, the effects of the accumulated number of exposed hours to high temperatures also changes differentially. According to the findings here, the number of hours exposed to high temperatures during day and night affected production of these plants. The number of hours exposed to high daytime temperatures from late June to early August contributed to the decline of September productivity (Figs. 2 and 3, Table 5). Hence, when the temperature and light intensity gradually rise in early summer, it is essential to manage daytime temperatures within an appropriate range so that fallen flowers or fallen fruits do not occur (Bakker, 1989).
Interestingly, solar radiation was not significant at any growth stage or in any monthly production (Table 5). Paprika may have a lower light saturation point compared to other fruits vegetables, such as tomatoes (Kim et al., 2011). In this research, the monthly averaged ISR of the ten cultivations investigated was 9.3–20.7 MJ·m-2. It was highest in June or July and lowest in August (Table 3).
Kim et al. (2022) determined that the yields and growth rates but not the plant height in paprika were lower when the light intensity was 10% lower and the temperature was 2–8°C higher during the central hours (10 am to 12 pm). This implies that a combination of environmental factors, such as higher temperatures and lower light levels, can affect the growth of paprika. According to the results of this study, it appears that lower solar radiation alone does not affect the production of paprika, although the production of paprika can be decreased when solar radiation is low and temperatures are high simultaneously or when solar radiation is low immediately after the paprika plant undergoes heat stress. Pollination and fertilization become poor due to poor nutrition of the flowers, which will eventually fall under an imbalanced environment (Marcelis et al. 2004), resulting in low production in September.
Conclusions
This research highlighted the lower production of paprika in Gangwon-do in Korea during the summer season. More specifically, the production levels of four commercial farms in Cheorwon-gun, Inje-gun were evaluated under various greenhouse environments, such as different temperatures and different levels of integrated solar radiation. The effects of these factors on the monthly production of paprika were then analyzed. The production of paprika was highest in June. Later it decreased until September. Both daytime and nighttime temperatures were higher than the corresponding optimal temperature ranges every day for almost two months during summer. Production in September had a strong negative correlation with the number of hours the plants were exposed to high daytime temperatures. ISR had no significant effect on monthly productivity. However, 17% of the cultivation period had lower solar irradiance (below 15 MJ·m-2) with a high temperature (above 27°C). Those days were mostly found from mid-July to early August. Overall, these results indicate that careful regulation of daytime temperatures from late June to August could help maintain the production of paprika in September.
