

Introduction
Materials and Methods
Plant Materials
CO2 Supply
Nutrient Solution Supply
Flowering Characteristics and Plant Biomass
Photosynthetic Characteristics
Statistical Analysis
Results
Discussion
Introduction
The genus Phalaenopsis is one of the major global floricultural crops, with the top commercial orchid representing 63.9% of the potted orchid trade (KAFFTC, 2016; Cho et al., 2019). Phalaenopsis is in high demand and is the top exported flower, accounting for more than 50% of the total floral market in Thailand (Hsiao et al., 2015). Due to the high demand for phalaenopsis in the United States and Japan, 75% of Taiwanese exports are destined for these markets (Grosscurt, 2017). Phalaenopsis is also traded at the world’s biggest auction company in the Netherlands, reaching up to 135 million pots in 2017 (FloraHolland, 2017).
In our previous study, phalaenopsis exposed to an elevated CO2 level of 800 µmol·mol-1 had increased biomass production (Kim et al., 2017). Elevated CO2 levels of either 800 or 1,200 µmol·mol-1 increased flower production in a shortened flowering time in phalaenopsis (Cho et al., 2019). However, even low concentrations of 450 ‑ 600 µmol·mol-1 increased plant growth and flower production in various C3 and C4 species (Zangerl and Bazzaz, 1984). In Senecio vulgaris, which is an annual C3 plant that blooms from February to November, plants exposed to CO2 levels of 550 µmol·mol-1 had increased leaf length and plant weight with faster flowering than those exposed to CO2 levels of 350 µmol·mol-1 (Leishman et al., 1999). CO2 elevated to 600 µmol·mol-1 increased plant yield and grain number of C4 plant wheat (Triticum aestivum Linnaeus) to 25.6 and 22.3%, respectively (Broberg et al., 2019). To apply elevated CO2 for practical use in a phalaenopsis commercial greenhouse, it is necessary to test flowering responses to CO2 below 800 µmol·mol-1. Plant photosynthetic responses under enriched CO2 conditions require additional nutrients, including nitrogen (N), phosphorus (P), and potassium (K) (Prior et al., 1997). Higher production due to CO2 enrichment increases the nutrient consumption of plants and therefore lowers the salinity level in nutrient solution (Sánchez-Guerrero et al., 2009). N and P concentrations in the leaf, which are required for maximum productivity, are likely altered under elevated CO2 conditions (Rogers et al., 1993). Limiting nutrients such as K could reduce photosynthesis and leaf development in cotton plants (Reddy and Zhao, 2005). However, the loss of photosynthetic capacity in wheat grown at elevated CO2 could be improved by adding N to the nutrient supply in proportion to the relative growth rate of the plant (Farage et al., 1998). In horticultural production, nutrient supply is easily controlled by the amount and the electrical conductivity (EC) of the nutrient solution (Kläring et al., 1999). An EC of 0.8 ‑ 1.2 dS·m-1 and a pH of 5.2 ‑ 6.2 is used for fertilization purposes in conventional phalaenopsis cultivation (Anthura, 2017). Although this has been used as the current model for greenhouse crop fertilization, it may not be universally applicable, as ideal conditions likely depend on environmental conditions (Kang and van Iersel, 2001, 2004). High nutrient concentration could be harmful to plants, but salvia plants (Salvia splendens) produced higher crop yields at EC levels of 2.0 and 3.7 dS·m-1 than at EC levels of 1.1 dS·m-1 and below (Kang and van Iersel, 2004). As atmospheric CO2 concentration increases, nutrient concentrations need to be adjusted, but more studies are necessary to determine the appropriate range of concentrations that would not degrade flowering quality. Although the relation of crop growth and yield to singular factors, such as nutrients, light or CO2 enrichment (Lee et al., 2019), has been intensively studied, up to date, there are no reports on the interactive effects of nutritional supply and elevated CO2 on phalaenopsis cultivation. Proper nutrient supply based on EC should be considered for phalaenopsis cultivation under elevated atmospheric CO2 conditions. To evaluate the effect of nutrient solutions under elevated CO2 conditions on the reproductive stage of phalaenopsis cultivars, it is crucial to assess the flowering and photosynthetic responses. Therefore, we investigated flowering and photosynthetic responses of Phalaenopsis Queen Beer ‘Mantefon’ and ‘Jupiter’ under various EC and CO2 conditions at a commercial phalaenopsis farm.
Materials and Methods
Plant Materials
Twenty-month-old Phalaenopsis Queen Beer ‘Mantefon’ and ‘Jupiter’ were grown in 12-cm pots filled with 100% sphagnum moss (Lonquen Ltd., Puerto Montt, Chile) in a plastic greenhouse at the Bulmuri Orchid Nursery, Paju, Korea (37°N latitude and 126°E longitude). The experiment was conducted for 5 months, starting from June 28 to November 24, 2017 in a greenhouse at Bulmuri Orchid Nursery. The greenhouse was covered with 50% shade cloth. Photosynthetic photon flux of full sunlight at the experimental location was at about 1,400 µmol·m-2·s-1 in June and 1,000 µmol·m-2·s-1 in November 2017. The average day/night temperatures inside the greenhouse were 23 ± 3/20 ± 2°C.
CO2 Supply
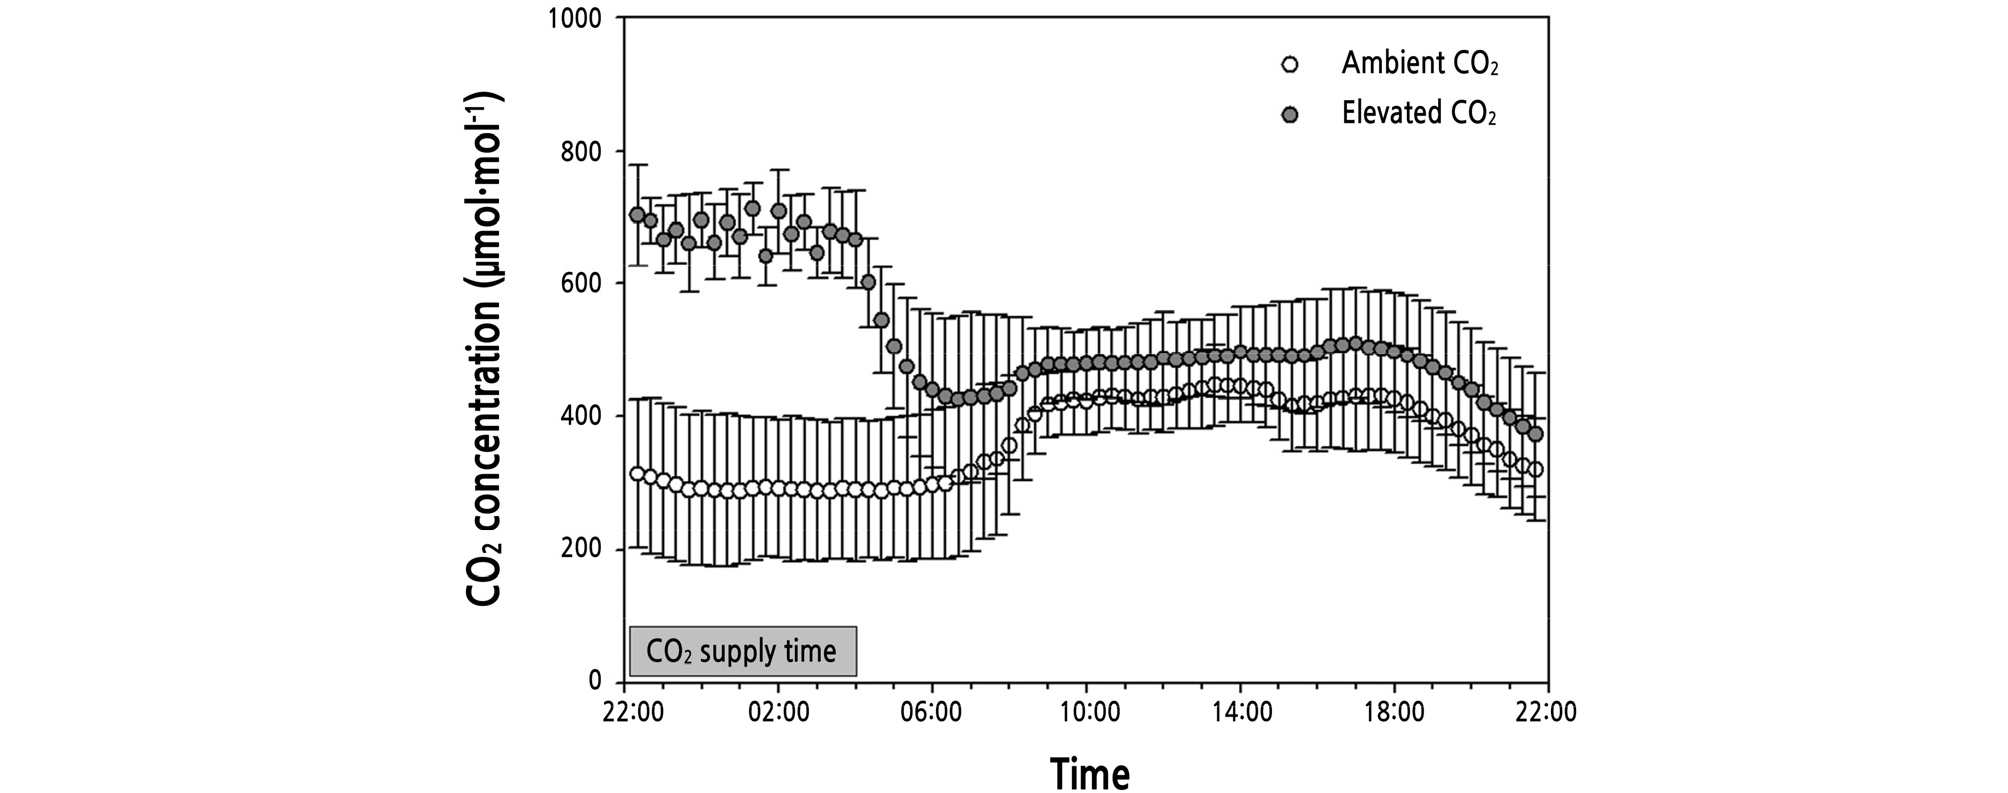
Two levels of ambient CO2 and elevated CO2 (≈ 650 µmol·mol-1) were applied to the plants for 6 hours during 22:00 ‑ 04:00 HR for 21 weeks of treatment (WOT) (Fig. 1). Elevated CO2 was supplied using gas generated by operating a heat pump using a gas engine. Since the general exhaust contains harmful gas, CO2 was supplied after removing CO and NOx below 50 ppm (Lee et al., 2015). The volume of CO2 supplied in the greenhouse was 297 m2, and the daily supplied amount within 297 m2 volume was 6.549 ± 1.641 kg. The CO2 concentrations were monitored using a CO2 analyzer (SH-VT250AS, Aion Inc, Daejeon, Korea).
Nutrient Solution Supply
The plants were grown under two nutrient concentrations for flowering. Nutrient solutions were prepared using three kinds of fertilizer: 12N-12P-36K (Kristalon Gena, Yara, Oslo, Norway), 13N-40P-13K (Kristalon Yellow, Yara, Oslo, Norway), and 13.5N-0P-1.5K (CalMag, Yara, Oslo, Norway). The plants were fertigated once every 10 days by hand-drip irrigation.
Plants were irrigated 12 times using 12N-12P-36K (Kristalon Gena, Yara) and 13N-40P-13K (Kristalon Yellow) with EC 1.0 (N 98 ppm, P 66 ppm, K 202 ppm) and 2.0 dS·m-1 (N 220 ppm, P 149 ppm, K 454 ppm), respectively. Plants were irrigated 4 times in a cycle using 13.5N-0P-1.5K (CalMag) with EC 1.0 (N 82 ppm, P 0 ppm, K 9 ppm, Ca 105 ppm, Mg 38 ppm) and 2.0 dS·m-1 (N 220 ppm, P 0 ppm, K 25 ppm, Ca 282 ppm, Mg 101 ppm). In a cycle, both Kristalon Gena and Kristalon Yellow fertilizer were provided three times and CalMag fertilizer was provided once in order.
Flowering Characteristics and Plant Biomass
The number of flower spikes, first and second flower spike length, number of visible flower buds, and number of lateral branches were measured from 11 plants every 3 weeks during 21 WOT. The number of flowers, flower size, and the fresh and dry weights of leaves, roots, and spikes were measured from 11 plants at 21 WOT. Flowering was defined as the full expansion of the labellum. Potential yield indicates the sum of the number of visible flower buds and flowers from 11 plants at 21 WOT (Saile-Mark and Tevini, 1997). The dry weight of leaves, roots, and spikes was determined from samples randomly collected from five plants per treatment; these samples were rinsed and then dried at 80°C for 7 days after 21 WOT, after which they were weighed.
Photosynthetic Characteristics
Gas exchange was measured from the uppermost mature leaf from 0:00 to 3:00 HR at 21 WOT for each plant. Three plants were randomly selected for the measurement of the values of net CO2 assimilation rates (Pn), stomatal conductance (gs), transpiration rate (tr), and water-use efficiency (WUE) using a portable photosynthesis system (LI-6400XT, Li-Cor Co., Inc., Lincoln, NE, USA) equipped with an infrared gas analyzer. The gas exchange parameters were set up as 1.3 ± 0.3 kPa vapor pressure deficit and 500 ml·min-1 air flow rate. Relative humidity (RH) in the leaf chamber ranged from 55 to 70%. The leaf chamber temperatures were kept at 18°C during the night. The WUE value was obtained by dividing Pn by tr (Xu et al., 2014).
Statistical Analysis
The experimental design was a completely randomized block with 11 replicates of each plant. Statistical analyses were performed using the SAS system for Windows version 9.4 (SAS Inst. Inc., Cary, NC, USA). Two-way analyses of variance (ANOVA) were performed to test the effect of CO2 treatment and EC, and the obtained means were compared by Duncan’s multiple range test at p < 0.05. Graph module analyses were performed using Sigma Plot version 10.0 (Systat, Software Inc., San Jose, CA, USA).
Results
The number of flower spikes was not affected by CO2 concentration and EC in ‘Mantefon’ (Fig. 2A). In ‘Jupiter’, flower spike was more induced in plants exposed to EC 1.0 dS·m-1 compared to those exposed to 2.0 dS·m-1 under ambient CO2 at 3 to 6 WOT; however, the number of flower spikes was not significantly different by CO2 concentration and EC after 9 WOT (Fig. 2B).
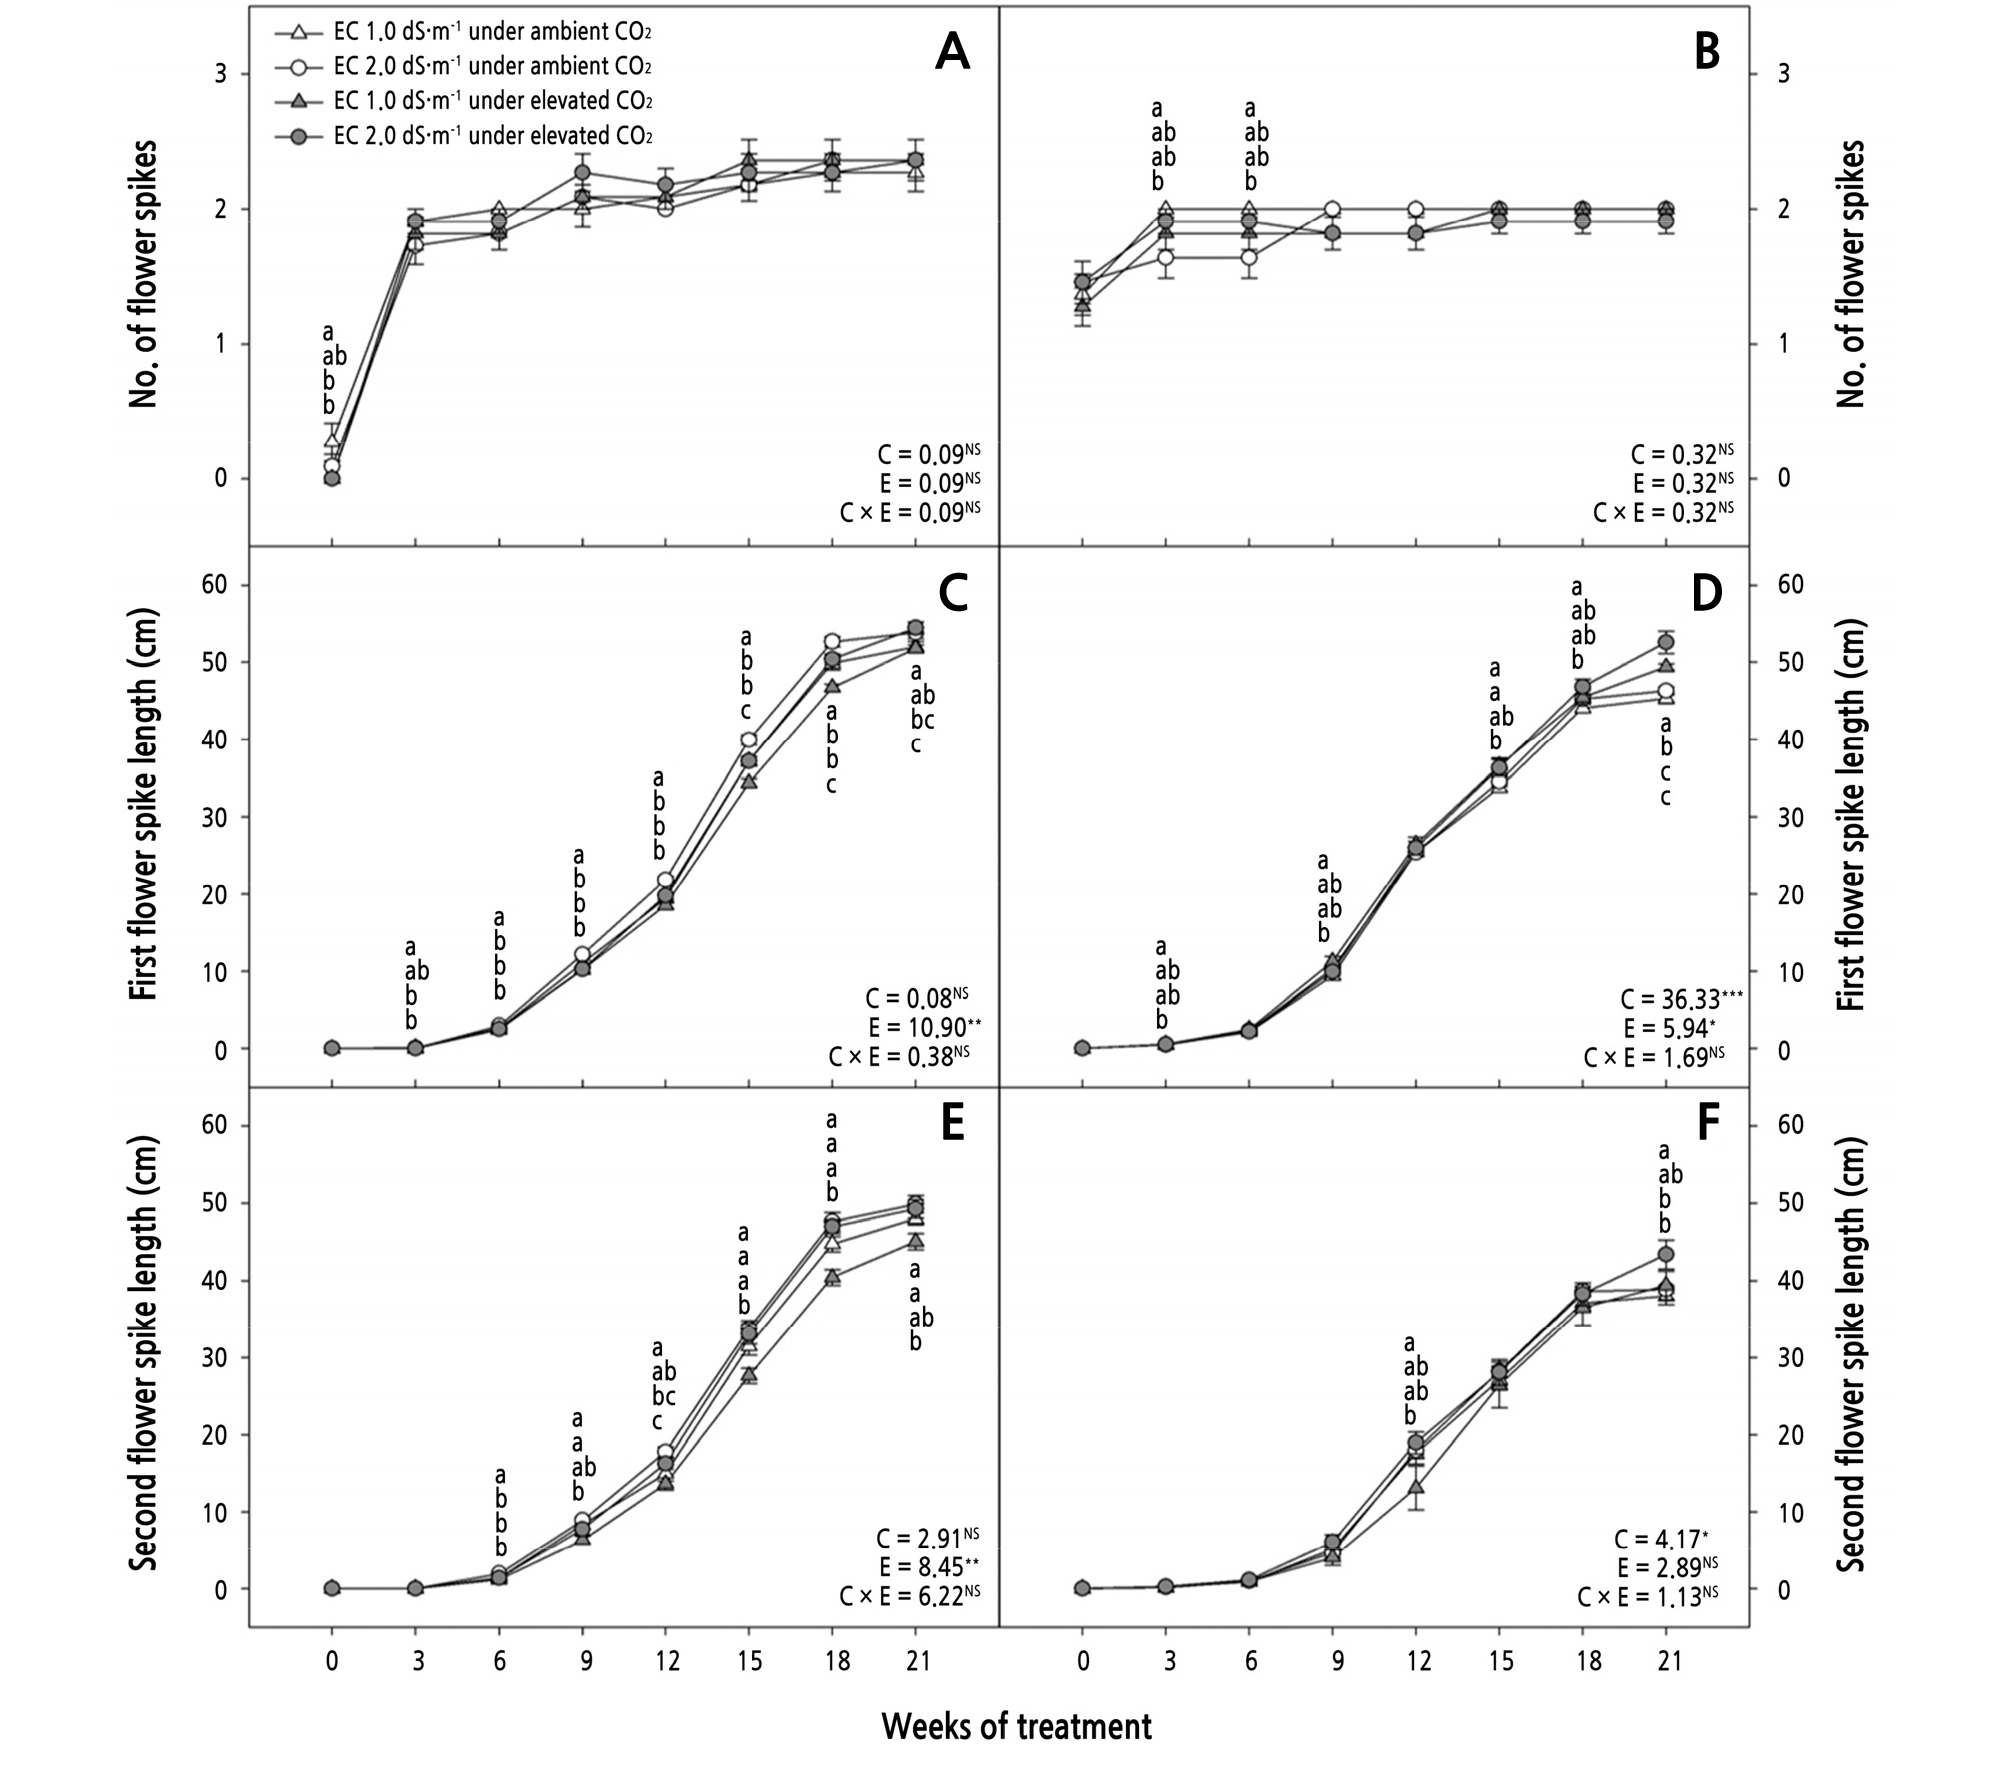
Fig. 2.
Effects of CO2 treatment and electric conductivity (EC) on the number of flower spikes (A, B), the first flower spike length (C, D), and the second flower spike length (E, F) of Phalaenopsis Queen Beer ‘Mantefon’ (A, C, E) and ‘Jupiter’ (B, D, F). Error bars represent standard error of the mean (n = 11). The different letters represent statistically significant differences as determined by the results of Duncan’s multiple range test (p < 0.05). F and P (NS = non-significant, *p < 0.05, and **p < 0.01, ***p < 0.001) values of the two-way ANOVAs at 21 weeks of treatment are presented, C: CO2 treatment, E: EC, and C × E: CO2 treatment × EC interaction.
The first flower spike length was longer in the plants exposed to EC 2.0 dS·m-1 under ambient CO2 compared to those exposed to EC 1.0 dS·m-1 under ambient CO2 as well as compared to ‘Mantefon’ under elevated CO2 at 3 to 18 WOT (Fig. 2C). In ‘Mantefon’, the first flower spike length was longer when EC was increased from 1.0 to 2.0 dS·m-1, regardless of CO2 treatment at 15 to 18 WOT. In ‘Jupiter’, the length of the first flower spike increased more in the plants under elevated CO2 than in those under ambient CO2 using the same EC level of 1.0 dS·m-1 at 3, 9, and 15 WOT (Fig. 2D). At 21 WOT, the length of the first flower spike was longest in the plants exposed to EC 2.0 dS·m-1 under elevated CO2 among all the treatments, regardless of the phalaenopsis cultivar (Fig. 2C and 2D).
The second flower spike first emerged at 6 and 9 WOT in ‘Mantefon’ and ‘Jupiter’, respectively (Fig. 2E and 2F). The second flower spike length increased more in the plants exposed to EC 2.0 dS·m-1 under ambient CO2 than in those exposed to EC 1.0 dS·m-1 under elevated CO2 at 6 to 21 WOT (Fig. 2E). In ‘Jupiter’, the length of the second flower spike increased more in the plants exposed to EC 2.0 dS·m-1 compared to those exposed to EC 1.0 dS·m-1 under the same elevated CO2 at 12 WOT (Fig. 2F). At 21 WOT, the length of the second flower spike was the longest in the plants exposed to EC 2.0 dS·m-1 under elevated CO2 compared to all the plants under ambient CO2. Flower buds emerged at 15 and 12 WOT in ‘Mantefon’ and ‘Jupiter’, respectively (Fig. 3A and 3B). At 15 WOT, more flower buds were produced in the plants under ambient CO2 than in those under elevated CO2, regardless of EC, in ‘Mantefon’ (Fig. 3A). After 15 WOT, increasing the CO2 concentration and EC continuously affected flower bud production, and the highest visible flower bud number was found in plants exposed to EC 2.0 dS·m-1 under elevated CO2 at 21 WOT in ‘Mantefon’. At 12 WOT, more flower buds were produced in the plants exposed to EC 2.0 dS·m-1 under ambient CO2 compared to all the plants under elevated CO2 levels in the ‘Jupiter’ (Fig. 3B). Similar to ‘Mantefon’, the most flower buds were produced in the plants with EC 2.0 dS·m-1 under elevated CO2 conditions among all the treatments at 21 WOT.
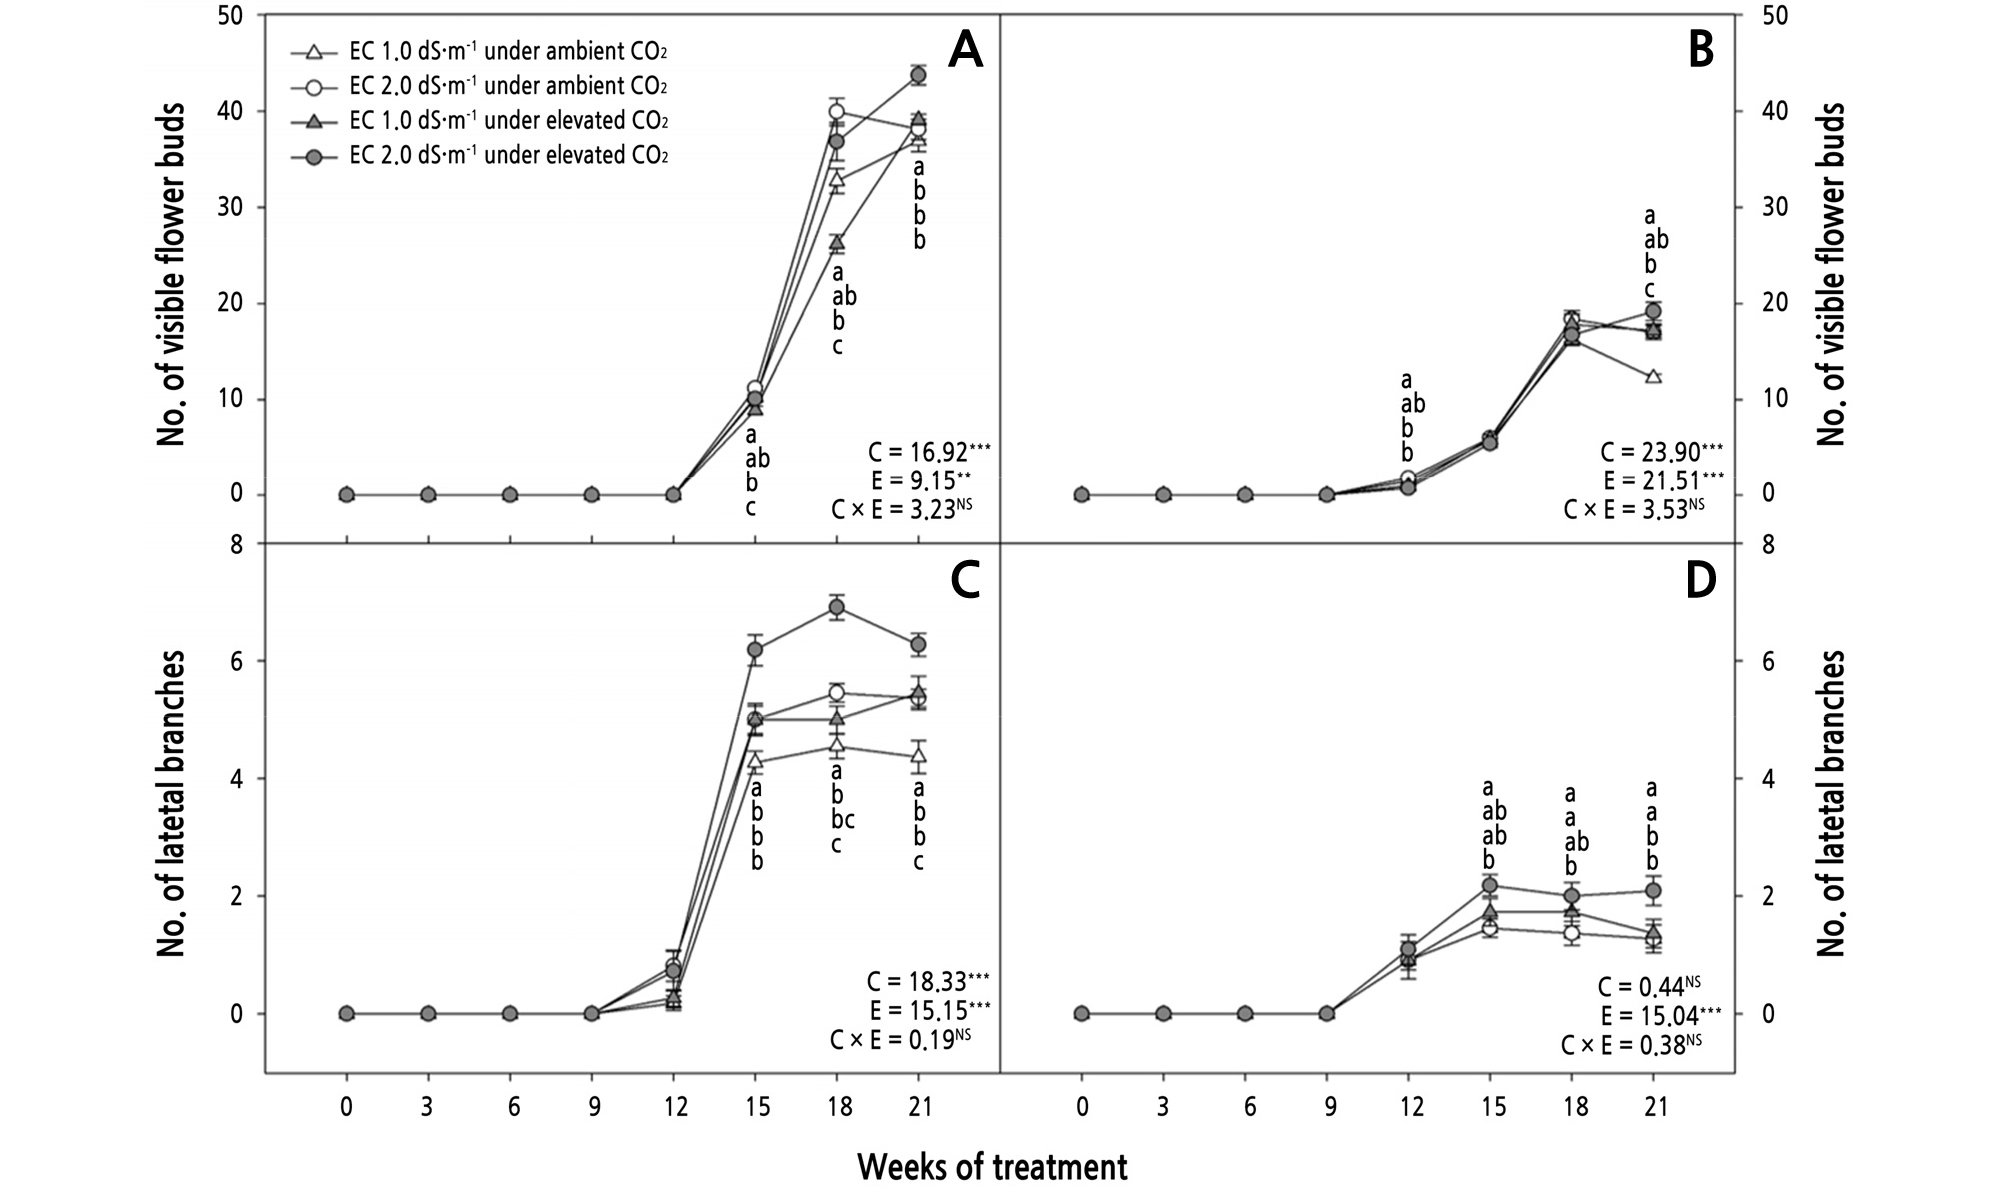
Fig. 3.
Effects of CO2 treatment and electric conductivity (EC) on the number of visible flower buds (A, B) and number of lateral branches (C, D) of Phalaenopsis Queen Beer ‘Mantefon’ (A, C) and ‘Jupiter’ (B, D). Error bars represent standard error of the mean (n = 11). The different letters represent statistically significant differences as determined by the results of Duncan’s multiple range test (p < 0.05). F and P (NS = non-significant, **p < 0.01, and ***p < 0.001) values of the two-way ANOVAs at 21 weeks of treatment are presented, C: CO2 treatment, E: EC, and C × E: CO2 treatment × EC interaction.
Lateral branches appeared at 12 WOT in ‘Mantefon’ and ‘Jupiter’ (Fig. 3C and 3D). Lateral branches reached the highest value in plants exposed to EC 2.0 dS·m-1 under elevated CO2 at 15 to 21 WOT in ‘Mantefon’ (Fig. 3C). In ‘Jupiter’, the effect of CO2 treatment and EC were different during 15 to 21 WOT; however, the number of lateral branches was increased in the plants exposed to elevated CO2 compared to those under ambient CO2 at 21 WOT, regardless of EC (Fig. 3D).
In both phalaenopsis cultivars, Pn and gs were significantly affected by only CO2 treatment among the CO2 treatment and EC factor (Fig. 4A ‑ 4D). The Pn increased more in the plants exposed to EC 1.0 dS·m-1 under elevated CO2 than in those exposed to EC 2.0 dS·m-1 under ambient CO2 in ‘Mantefon’, and gs increased more in the plants under elevated CO2 than those under ambient CO2, regardless of EC (Fig. 4A and 4C). In ‘Jupiter’, the gs of plants exposed to EC 1.0 dS·m-1 increased under elevated CO2 compared to those under ambient CO2; however, the gs of plants exposed to EC 1.0 dS·m-1 decreased with an increase in EC under elevated CO2 (Fig. 4D). The Tr of ‘Mantefon’ was not significantly affected by both CO2 concentration and EC (Fig. 4E). In ‘Jupiter’, the Tr showed almost the same results as gs (Fig. 4D and 4F). In ‘Mantefon’, the highest WUE value was obtained in the plants exposed to EC 2.0 dS·m-1 under elevated CO2 among the treatments (Fig. 4G). Moreover, WUE was affected by CO2 treatment, regardless of phalaenopsis cultivar (Fig. 4G and 4H).
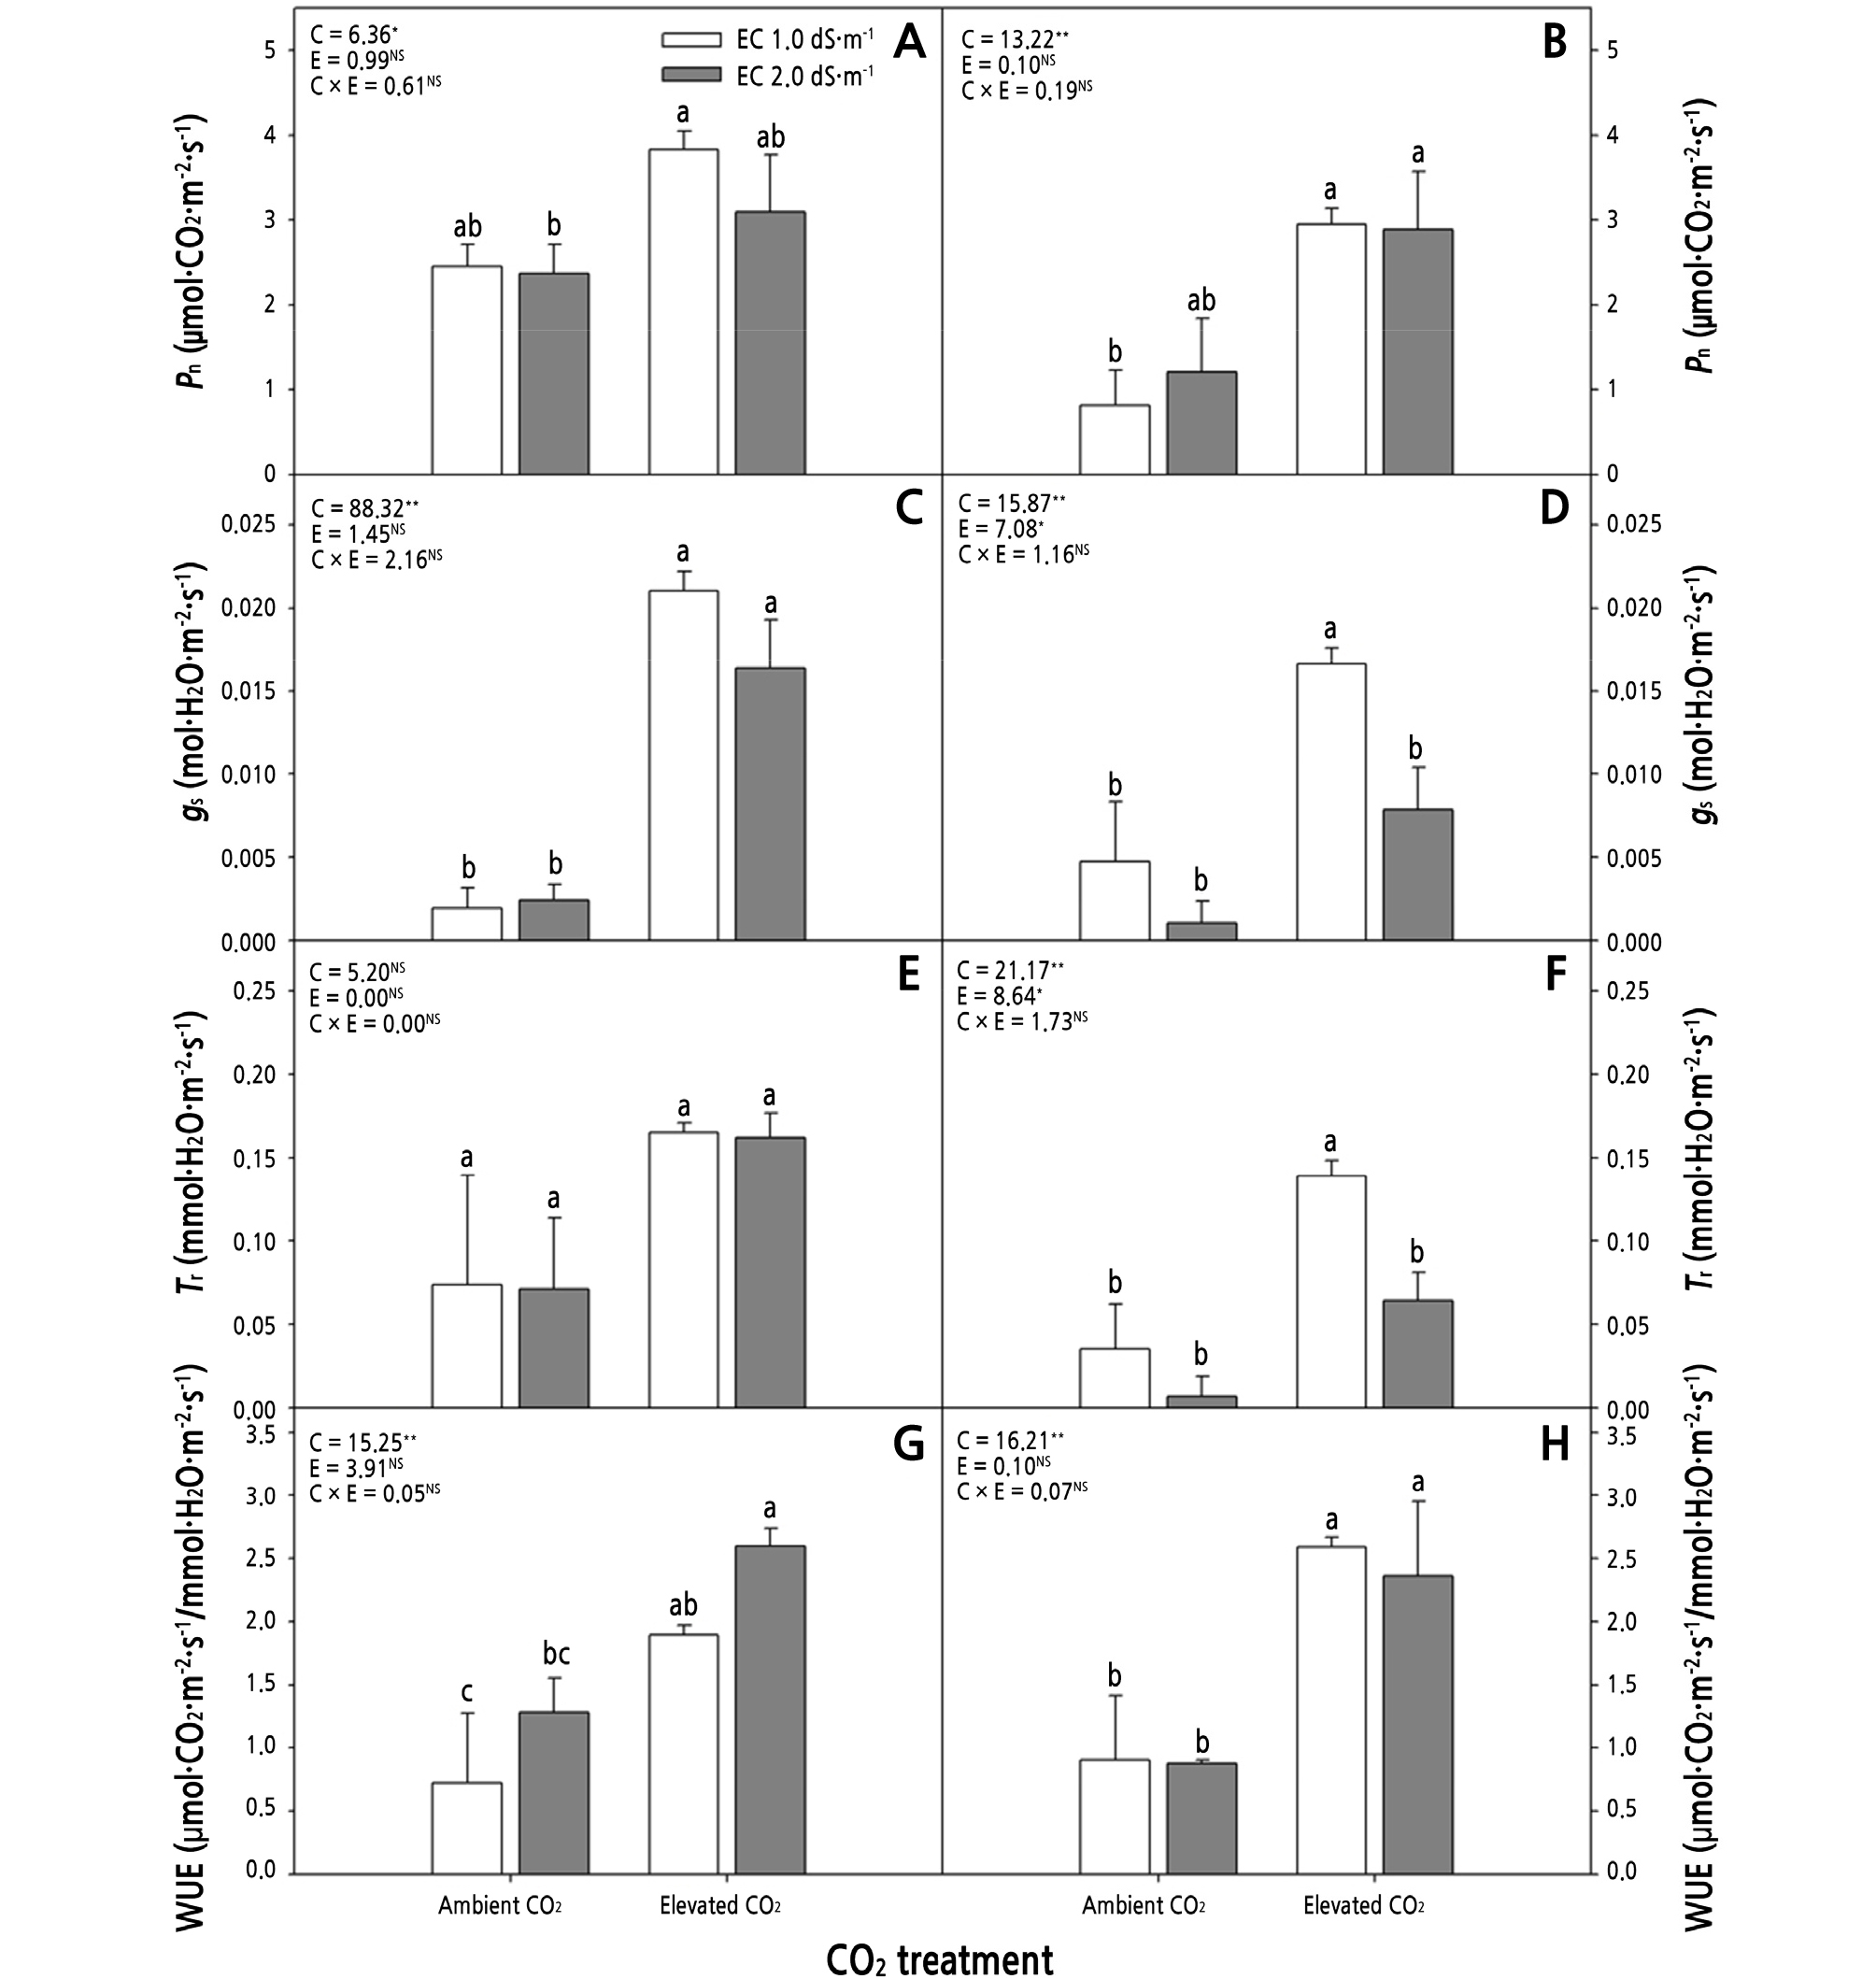
Fig. 4.
Effects of CO2 treatment and electric conductivity (EC) on the net CO2 assimilation rate (Pn) (A, B), stomatal conductance (gs) (C, D), transpiration rate (tr) (E, F), and water-use efficiency (WUE) (G, H) of Phalaenopsis Queen Beer ‘Mantefon’ (A, C, E, G) and ‘Jupiter’ (B, D, F, H) at 21 weeks of treatment. Error bars represent standard error of the mean (n = 3). The different letters represent statistically significant differences as determined by the results of Duncan’s multiple range test (p < 0.05). F and P (NS = non-significant, *p < 0.05, and **p < 0.01) values of the two-way ANOVAs are presented, C: CO2 treatment, E: EC, and C × E: CO2 treatment × EC interaction.
At 21 WOT, the flower size, number of flowers, potential yield, and fresh and dry weights of the plants were measured (Table 1). Flower size decreased in the plants exposed to EC 2.0 dS·m-1 under elevated CO2 compared to those exposed to EC 1.0 dS·m-1 under both ambient and elevated CO2 in ‘Mantefon’. In ‘Jupiter’, flower size decreased with an increase in EC; however, it increased under elevated CO2 compared to those under ambient CO2. The flower size was only affected by EC in ‘Mantefon’; however, it was affected by either CO2 treatment or EC in ‘Jupiter’. The number of flowers increased more in plants exposed to EC 2.0 dS·m-1 compared to those exposed to EC 1.0 dS·m-1 under ambient CO2 in ‘Mantefon’, but the number decreased under elevated CO2 in both ‘Mantefon’ and ‘Jupiter’ cultivars, regardless of EC. The number of flowers was affected by CO2 treatment and EC in ‘Mantefon’; however, it was only affected by CO2 treatment in ‘Jupiter’. Potential yield of ‘Mantefon’ increased more in plants exposed to EC 2.0 dS·m-1 under elevated CO2 compared to those exposed to EC 1.0 dS·m-1 under both ambient and elevated CO2, and it was only affected by EC. In ‘Jupiter’, plants exposed to EC 2.0 dS·m-1 under ambient CO2, as well as all the plants under elevated CO2, had a higher potential yield compared to the plants exposed to EC 1.0 dS·m-1 under ambient CO2. Potential yield was affected by either CO2 treatment or EC in ‘Jupiter’. Most of the fresh and dry weight parameters had no effect between CO2 treatment and EC, regardless of phalaenopsis cultivar. In ‘Mantefon’, the fresh weight of spikes was affected by CO2 treatment. In ‘Jupiter’, the fresh weight of leaves was affected by CO2 treatment and interaction between CO2 treatment and EC, and the dry weight of spikes was affected by EC.
Table 1.
Effects of CO2 treatment and electric conductivity (EC) on the flower size, number of flowers, potential yield, and fresh and dry weights of leaves, roots, and spikes of Phalaenopsis Queen Beer 'Mantefon' and 'Jupiter' at 21 weeks of treatment
Discussion
The flower spike length of the plant species responded differently to the nutrient and CO2 concentrations. In Salviasplendens, the length of flower stalk increased with increasing nutrient concentrations from EC 0.125 to 1.0 dS·m-1; however, it decreased with increasing nutrient concentration from EC 0.1 to 2.0 dS·m-1 (Kang and van Iersel, 2004). Flower spike length of Phalaenopsis Taisuco Kochdian increased with increasing K concentration to 400 mg·L-1 K, regardless of the medium (Wang, 2007). Flower spike length decreased with elevated atmospheric CO2 concentrations of 800 ‑ 1,600 µmol·mol-1; however, it increased under 2,400 µmol·mol-1 CO2 compared to those under ambient CO2 level in Phalaenopsis ‘Fuller’s Pink Swallow’ (Kim et al., 2017). Our study also revealed that the flower spike length with the effects of CO2 treatment or EC was varied in phalaenopsis cultivars. Flower spike length of ‘Mantefon’, in terms of the first spike, increased by EC at p < 0.01, while that of ‘Jupiter’ increased by either CO2 treatment or EC at p < 0.001 and 0.05, respectively, at 21 WOT (Fig. 2C ‑ 2F).
A CO2 concentration of 1,600 ‑ 2,400 µmol·mol-1 enhances leaf growth and flowering characteristics, as seen with lateral branches and flower bud production in phalaenopsis (Kim et al., 2017). Flowering rate increased and was faster in the plants grown under the CO2 concentration of 800 ‑ 1,200 µmol·mol-1 with high light conditions during the flowering stages in phalaenopsis (Cho et al., 2019). In the present study, we found that lateral branch production also increased in ‘Mantefon’ under elevated CO2 of about 650 µmol·mol-1, and both flower buds and lateral branch production increased in ‘Jupiter’ at 21 WOT, regardless of EC (Fig. 3). Exposure to elevated CO2 increases cell expansion, alters patterns of primordium initiation, and changes morphogenesis; thus, the growth of stems and branches were stimulated more when exposed to elevated CO2 than in plants under ambient CO2 (Pritchard et al., 1999). Pn and WUE were higher in ‘Mantefon’ under a CO2 concentration of 800 ‑ 1,600 µmol·mol -1 than in those under ambient CO2 (Yun et al., 2018; Cho et al., 2019). An enhanced Pn value in ‘Mantefon’ under elevated atmospheric CO2 could increase the accumulation of soluble sugar and starch content, which in turn can regulate flowering (Kim et al., 2017; Cho et al., 2019). WUE of plants can be enhanced by CO2 supply due to increased photosynthesis (Reddy et al., 1995; Cho et al., 2019), resulting in an increase of growth and yield (Sánchez-Guerrero et al., 2009). In the present study, Pn and WUE were the highest in ‘Mantefon’ and ‘Jupiter’ under elevated CO2, regardless of EC (Fig. 4). We determined that elevated CO2 levels of about 650 µmol·mol-1 increase photosynthesis for phalaenopsis production and enhance the production of flower buds and lateral branches without abortion in flowering in both phalaenopsis cultivars.
The photosynthetic characteristics of phalaenopsis were affected by the CO2 treatment; however, the effect of EC and the interaction between CO2 treatment and EC on the Pn and WUE were not determined in our study (Fig. 4). Kang and van Iersel (2004) reported that the Pn of salvia decreased with increasing nutrient concentration, while the plant growth increased. Some possibilities could account for this. Since the epiphytic CAM orchid normally has a slow rate of mineral uptake (Hew and Yong, 1997; Gouk et al., 1999), the differences caused by EC in photosynthetic characteristics may not be known yet. In Oncidium ‘Goldiana’, the photosynthesis rate was different from the measured leaf position and stages of development (Hew and Yong, 1994), the respiratory CO2 efflux from roots and stems was not measured (van Iersel and Bugbee, 2000), differences in leaf area among treatments were not accounted for (Kang and van Iersel, 2004), and the Phalaenopsis ‘Blanc Rouge’ has the highest CO2 uptake at specific RH range (e.g. 70%) (Lee et al., 2018), but the mechanical setting range was wider in our study. Further investigation into the photosynthetic characteristics by considering leaf position, developmental stages, respiratory CO2 of other organs, leaf area development, or RH range would be of great significance to the morphologic and photosynthetic changes in phalaenopsis.
Elevated CO2 increases Pn in C3 plants because higher CO2 levels can suppress RuBP oxygenase activity, decrease photorespiration, and increase carbon assimilates (Reddy and Zhao, 2005). Similar to C3 plants, elevated atmospheric CO2 concentrations increase the nocturnal CO2 uptake by phosphoenolpyruvate carboxylase and malate accumulation in crassulacean acid metabolism (CAM) plants, resulting in more efficient photosynthesis (Drennan and Nobel, 2000). Therefore, rapid growth and high productivity of field crops require an increase in mineral nutrient supply under elevated atmospheric CO2 conditions (Reddy and Zhao, 2005). When soil N supply is high, wheat plants under 550 and 900 µmol·mol-1 CO2 take up N via the roots to anthesis more; these plants have higher protein concentrations than those exposed to 350 µmol·mol-1 CO2 (Rogers et al., 1996). In cotton plants, the critical K levels in leaves increased to 18 ‑ 19 g·kg-1 under elevated CO2 from the 12 g·kg-1 required under ambient CO2 for both stem elongation and Pn (Reddy and Zhao, 2005). When nutrients such as P are deficient under elevated CO2, rice may not generate sufficient sinks for carbon sources in the apical meristem; as such, they might produce low yields of panicle and grain (Seneweera and Conroy, 1997). In our study, the fertilizers containing N, P, and K were supplied at regular intervals, assuming that nutrient demands were changed when supplying elevated atmospheric CO2 concentration. Although the photosynthetic characteristics were not affected by EC changes in our study, when atmospheric CO2 was elevated, the number of visible flower buds and lateral branches and flower spike length were increased with an EC of 2.0 dS·m-1 during the 21 WOT, which is higher than the conventional nutrient supply.
Depending on the day/night temperature, the flower diameter of petunia decreased when the fertilizer solution was increased from EC 0.15 to 4.0 dS·m-1 at 35/27°C (Kang and van Iersel, 2001). In our study, the flower size of both ‘Mantefon’ and ‘Jupiter’ decreased by increasing EC from 1.0 to 2.0 dS·m-1 under elevated CO2 (Table 1). Flower size can decrease as salinity levels increase (Sonneveld et al., 1999), so increasing salinity levels to EC 2.0 dS·m-1 may have altered the flower size in this study. Although the flower size was smaller, more flower buds and lateral branches were produced with increasing EC; as such, CO2 enrichment combined with EC control were thought to have a positive effect on the flowering quality of phalaenopsis.
In our study, the number of flowers seemed negatively correlated with increasing CO2 levels; however, potential yield, which is the sum of the number of flowers and flower buds, increased under elevated CO2 with EC 2.0 dS·m-1 (Table 1). Previous studies revealed that CO2 concentrations of 550 to 660 µmol·mol-1 accelerated the flowering of perennial cultivated species after about 60, 10, and 8 days in Calluna vulgaris, Trifolium repens, and Betonica officinalis, respectively (Woodin et al., 1992; Rusterholz and Erhardt, 1998; Wagner et al., 2008); however, a CO2 concentration of 700 µmol·mol-1 was found to delay flowering, even if the relative growth rates were enhanced in Phytolaccaamericana (He et al., 2005). In Brassica species, an elevated CO2 concentration of 998 ± 12 µmol·mol-1 delayed the onset of flowering and stimulation of vegetative shoot growth (Frick et al., 1994). In Cho et al. (2019), flowering time was not altered under 400 or 800 µmol·mol-1 CO2 when under the same light level of 90 ± 10 µmol·m-2·s-1 in Phalaenopsis ‘Mantefon’; however, it was faster when the CO2 concentration was increased under higher light levels of 260 ± 40 µmol·m-2·s-1. Phalaenopsis absorbs CO2 during the nighttime, however, the light intensity during the daytime may contribute more to the growth and photosynthetic capacity (Lee et al., 2019). Both the flower spike length and flower buds production were increased under the CO2 concentrations used in this study, but higher concentrations of CO2 or light level alterations are required to accelerate the emergence of flowers in Phalaenopsis ‘Mantefon’.
Plant dry weight in Gerbera jamesonii, which is related to biomass accumulation, increased 32 ‑ 40% under 800 ± 50 µmol·mol-1 than in those under ambient CO2 level (Xu et al., 2014). Since the effects of CO2 treatment on photosynthetic characteristics have been reported (Fig. 4), an increased biomass under elevated CO2 condition was expected but no effect was found (Table 1). In Cho et al. (2019), CO2 enrichment during the reproductive stage did not affect the growth of leaves. It is assumed that phalaenopsis is a slow-growing plant, and carbohydrates are allocated more to the flowers as well as fruit set during the reproductive stage (Zilkah et al., 1987).
We assumed that the amount of nutrient supply should be higher than the conventional supply when applying elevated CO2. Under elevated CO2 conditions, there were more lateral branches in the plants with EC of 3.0 dS·m-1 or higher than in those with EC 2.0 dS·m-1 or lower; however, after 6 weeks, there was no difference between the EC treatments, and the flower size decreased with increasing EC levels (Cho et al., 2020). We determined that the nutrient supply should be in the range of EC 1.0 to 2.0 dS·m-1 through previous research. The elevated CO2 concentrations used here could thus improve flowering quality if nutrients were sufficiently supplied and optimized for phalaenopsis cultivation. We found that it is possible that CO2 may interact with EC to alter flowering characteristics for phalaenopsis cultivation.
