

Introduction
Materials and methods
Growing condition
Plant materials and treatments
Irrigation and drainage measurement
Measurement of plant growth and fruit characteristics
Statistical analysis
Results and Discussion
Conclusion
Introduction
Strawberry (Fragaria × ananassa Duch) is one of the most popular fruit vegetables with more than twenty species and different cultivars worldwide. It is a major source of various vitamins, minerals, and antioxidants, and has been documented with biological activities against various diseases (Zhu et al. 2015). The hydroponic cultivation area for strawberries in South Korea was expanded to 1,596 ha in 2020 (KOSTAT 2021). Strawberry is a high-value crop in South Korea and 97% of strawberries are produced in greenhouses (Ahn et al. 2021).
Hydroponics can control to maintain crop growth and improve the plant quality by using water-based nutrient solutions in irrigation. The quality and nutritional value of fruit are influenced by the hydroponic culture system, environmental conditions, cultivation techniques, ripening season, pre and postharvest conditions, processing and crop load (Connor et al. 2002). Strawberry farmers have experienced in physical pain for the growing season, such as transplanting, removal of leaves and flowers, harvesting, and in injury by successive cropping in soil and for this reason and other problems in soil cultivation. There is a rapid transition to elevated bed hydroponics (Hwang et al. 2022). In high bench system for strawberry in Korea, beds were used generally tent paper or Styrofoam molded to a length of 50 m over on a high elevated bench (Jeong 2000). Hydroponic cultivation is often recycled and reduced waste and promote sustainability (Woznicki et al. 2023). Because of pollution, scarcity, and increased water usage, efficient water use is essential.
Coir medium has high- water retention capacity, and its physical properties can also be adjusted, to facilitate effective nutrient content, water infiltration rate, pore space, and soil moisture conductivity depending on the volume and composition (Vavrina et al. 1996). The porosity and volume of the medium is the most important physical property that affects the plant’s water and nutrient uptake, gas exchange in the root rhizosphere, growth, yield, and quality indices (Godara and Sharma 2016). The type of root zone such as size and shape have a significant impact on the slab biological activity and growth parameters of the plant (Lee et al. 2023). The larger the root zone, the better the absorption of mineral nutrient for plant growth, especially morphological growth. This affects various characteristics that are related to photosynthetic substances, mainly by increasing their capacity (Kasai et al. 2012). The quantity of fruit is determined by the ratio of liquid and gas in the medium (Beaudry 2000). When using a coir medium mixed with dust and chips, the appropriate irrigation amount needs to be determined, to prevent a large amount of liquid from escaping into drainage (Shin and Son 2015).
The production of crops in hydroponics is very costly. So, the choice of slab is one of the largest challenges for the hydroponics system, because when purchased commercially, it requires high investment from the producer. But, strawberry is a vegetative crop and is susceptible to diseases from seedlings onwards (Rover et al. 2016). Therefore, for economic stability and high production, slab selection is of considerable interest.
Slab volume plays a crucial role in plant health and establishment. Proper slab volume allows for a vigorous root system, and greater surface area for water and nutrient uptake (Hendrikus et al. 2012). Therefore, it is important to consider slab volume when designing slabs for maximum yield, root expansion and establishment, ultimately supporting the overall health and productivity of plants. Keeping this in view, the present work was carried out to evaluate the growth and yield of strawberries by using different volumes of coir slab for hydroponic systems.
Materials and methods
Growing condition
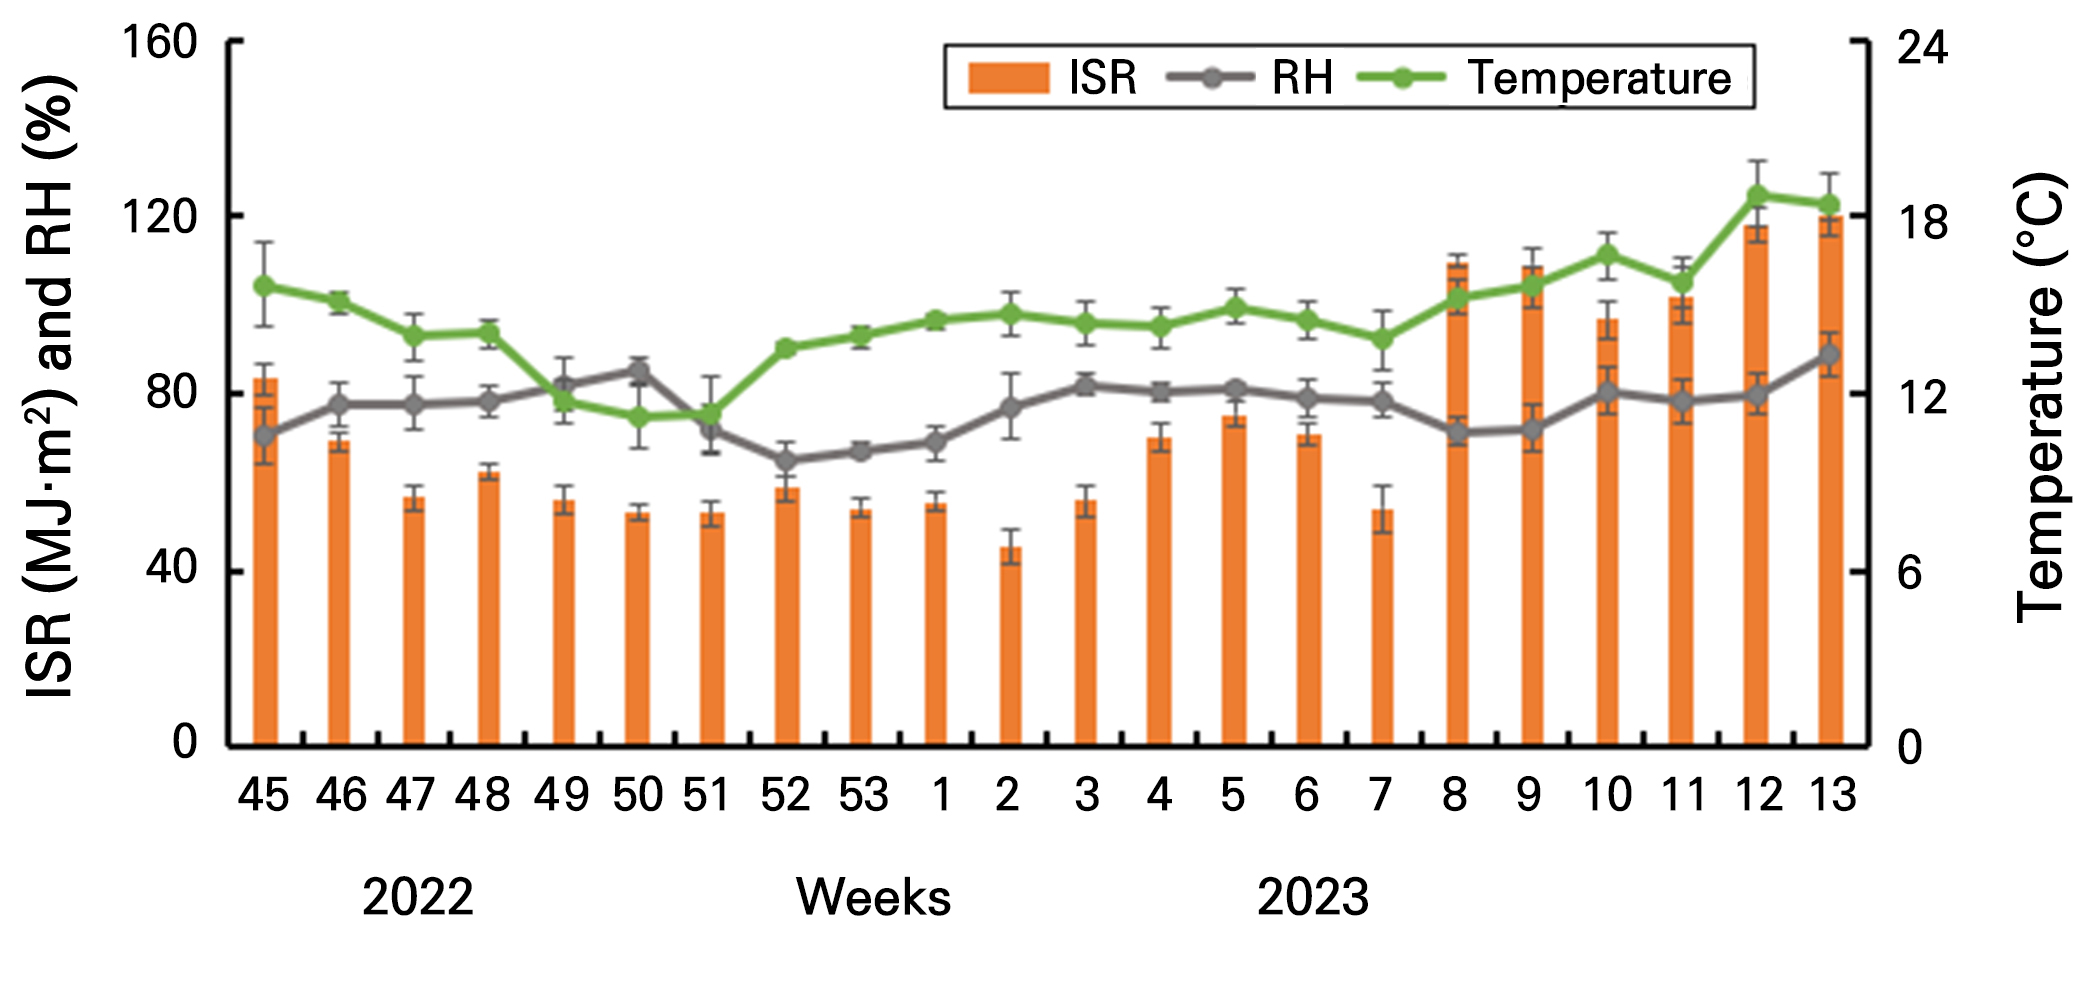
This experiment was conducted in an 18 m × 8 m × 6 m (L × W × H) Venlo-type glass greenhouse at the Kangwon National University smart farm in Chuncheon-si, Gangwon-do from September 15, 2022, to March 31, 2023. Coconut coir slabs of different height and volume were placed on four 11 m × 27 cm (L × W) lines of hanging gutters (Fig. 1C). Before transplanting, the coir slabs were washed and buffered with University of Seoul (UOS) nutrient solution A, and the electrical conductivity was maintained below EC = 0.5 dS·m-1. The slab was then supplied with a standard nutrient solution for strawberries developed by UOS consisting of the Macronutrients NO3-N, NH4-N, P, K, Ca, Mg, and S of 6.5, 0.5, 2.1, 4.0, 3.0, 1.5, and 1.5 me·L-1, respectively, with EC ranging of 0.8–1.5 dS·m-1. The UOS strawberry nutrient solution was applied for the whole cultivation period through the drippers. Temperatures, relative humidity (RH), and integrated solar radiation (ISR) were controlled and recorded in real time by auto-control software (Ridder Synopta, Ridder, Harderwijk, The Netherlands). The range of temperature, relative humidity, and ISR was 11.2 to 21.4°C, 65.1 to 89.1% and 45.1 to 120.2 MJ·m-2, respectively. The lowest weekly data were recorded in December, with ISR at 45.1 MJ·m-2, RH at 65.1%, and temperature at 11.2°C. Windows were opened at 22°C, and screens were closed at 600 and 800 W·m-2. A heating system was operated at 5–8°C during nighttime, and 12°C during the daytime from October 4 (Fig. 2). General management was followed, and plants were pollinated by honey bees inside the greenhouse. Fruit thinning was conducted selectively, leaving six fruits per cluster.
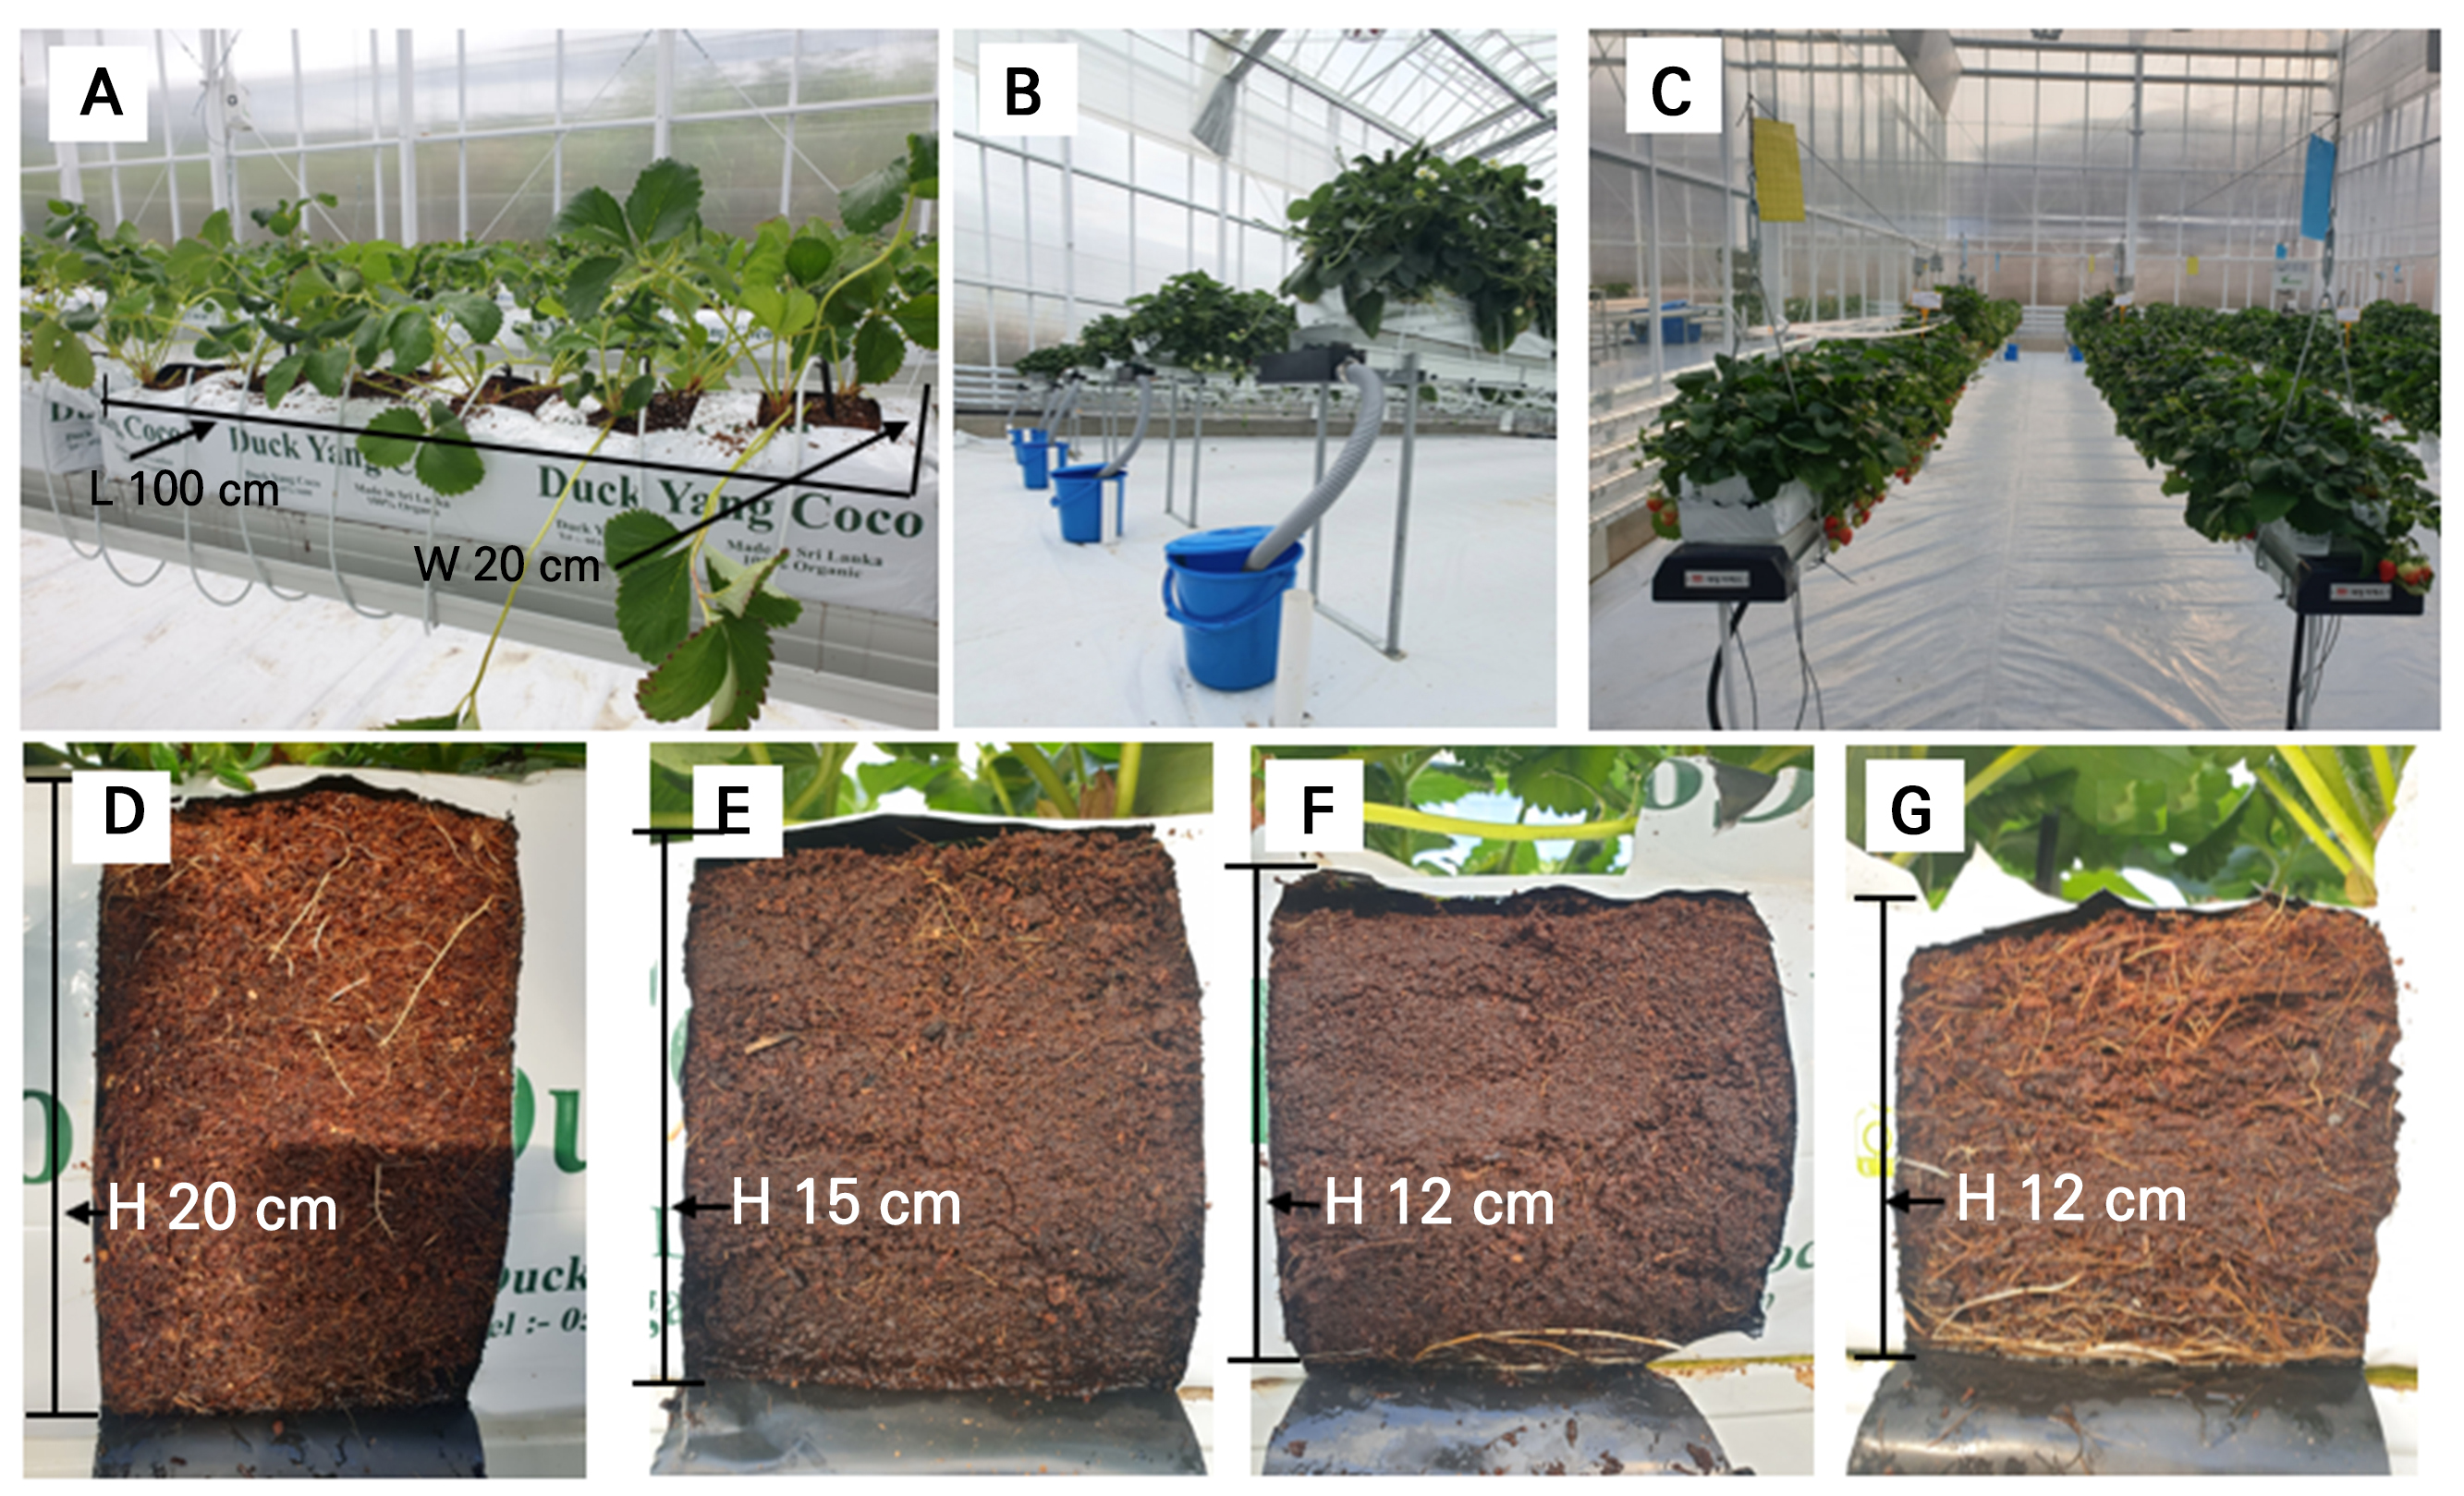
Fig. 1.
Experimental layout in a hanging gutter hydroponics; slab size (A), drainage collection (B), cultivation (C) and slab volumes (D~G). There are 12 plants in a slab (A) height 20 cm (D), 15 cm (E), and 12 cm (F) with chip: dust ratio = 0:10 (v/v), and height 12 cm (G) with chip: dust ratio = 5:5 (v/v), respectively.
Plant materials and treatments
‘Sulhyang’ strawberry plants with 3 to 5 leaves were transplanted after cutting root tips (density was 12 plants/slab). The plants were grown in 10 slabs. There were six holes in each slab, and two plants were positioned in each hole. Treatments were used on the 100 cm × 20 cm (L × W) coconut coir slabs (Fig. 1A), with four types of slab, such as V1 (height 20 cm, 40 L, dust: chip ratio = 10:0, Duck Yang Coco, Sri Lanka, Fig. 1D), V2 (height 15 cm, 30 L, dust: chip ratio = 10:0, Duck Yang Coco, Sri Lanka, Fig. 1E), V3 (height 12 cm, 24 L, dust: chip ratio = 10:0, Duck Yang Coco, Sri Lanka, Fig. 1F) and V4 (height 12 cm, 24 L, dust: chip ratio = 5:5, Dae Young GS, South Korea, Fig. 1G).
Irrigation and drainage measurement
Four 2 cm drainage holes were made on the bottom of each slab. One dripper was set between two plants for irrigation (6 drippers per slab). Irrigation was controlled automatically using by a timer and integrated solar radiation (ISR) in a Ridder HortiMaX system. The irrigation schedule for the first zone was supplied by a timer from an hour after sunrise until 11 a.m., and the other times were controlled by ISR in the range of 100–180 J·cm-2 for three hours before sunset. The irrigation amount per dripper was 30–80 mL varying with the experimental period. The drainage water in a day was collected for each treatment to analyze the total amount of drainage, EC, and pH (Fig. 1B). The EC and pH were measured using an EC, and pH meter (HI9813-6, Hanna Ins., Romania). Total drainage rate (TDR), total retained volume (TRV), and water use efficiency (WUE) were calculated by the following formulae (where, TDV = total drainage volume; TIV = total irrigation volume) (Choi et al. 2016);
Measurement of plant growth and fruit characteristics
The plant height was measured by the biggest leaf, and petiole length, leaf length, and leaf width were determined using the third-newest leaf every month. The crown diameter was measured by a digital caliper (CD-20CPX; Mitutoyo Corp., Japan) at the maximum diameter of the crown part. The level of chlorophyll at third leaves from growing point of the same plant was recorded monthly by Chlorophyll Meter (SPAD-502, Konica Minolta, Japan). Photosynthesis characteristics were measured at third young leaves from growing point using a portable photosynthesis meter (LI-6800, LI-COR Inc., USA). The measurement was repeated three times each. Measurement conditions were 20°C temperature, 400 µmol·m-2·s-1 of CO2 concentration and 1,000 µmol·m-2·s-1 photosynthetic photon flux density (PPFD). We used 1000 µmol·m-2·s-1 because this light intensity ensures that the light-dependent reactions of photosynthesis are operating near their maximum potential without causing photoinhibition (light-induced damage) (Long et al. 1994).
Strawberry (fully ripened; 90 to 100%) was harvested once or twice a week from November 2022 to March 2023. The number of fruits were counted manually and their yield with weight of each fruit were measured using an electronic balance (HS5200S, Hansang Instrument C. Ltd., Korea). Firmness of the strawberries was measured using a cylindrical probe (3 mm) penetrated to the skin of the fruit to calculate the compression force in Newtons (N) by a fruit firmness tester (FR-5105, Lutron electronic enterprise Co. Ltd., Taiwan) from January to March, 2023. After measuring firmness, each fruit was juiced. This juice was then analyzed for soluble solid content with a pocket refractometer (ATAGO PAL-1, Atago Co. Ltd., Japan) and acidity (measured by adding 50 ml water and 1 ml fruit juice with PAL-BXIACID4, Atago Co. Ltd., Japan).
Statistical analysis
The experimental data were analyzed using different samples for different parameters, the fruit number and yield in 10 slabs, growth characteristics in 7 samples, fruit quality in 50 samples and photosynthesis in 3 samples for each treatment. Outcomes from an analysis of variance (ANOVA) and the mean differences were compared by a post-hoc test at a p level of < 0.05 according to Duncan’s multiple range test (DMRT). Analyses were performed IBM SPSS Statistics for Windows, version 26 (IBM Corp., USA). Principal Component Analysis (PCA) was conducted using the RStudio software (version 4.4.1.; R Core Team 2024) with using some R packages (factoextra and ggplot2).
Results and Discussion
Fig. 3 shows the change of drainage in coir slab volumes in the strawberry hydroponics. In the four treatments, the drainage ratio showed similar trends (Fig. 3A). At the week 45 of 2022, the drainage ratio of V1 was 45% and V2, V3, and V4 treatments was nearly 35%. From week 46 to 51 of 2022, the drainage ratio for all treatments was varied and decreased in week 52 of 2022. Then, from week 53 of 2022 to 7 of 2023, the drainage ratio of the V1, V2, V3, and V4 treatments was stable. From week 8 to 10 of 2023, the amount of drainage ratio was lower in V2 and V3 treatments at 21.1 and 22.4% than the V1 and V4 at 24.0 and 29.8%, respectively. After that, from week 11 to 13 of 2023, the value of the drainage ratio for all treatments was increased and reached 22.1, 26.3, 32.0 and 36.4% for V1, V2, V3, and V4 treatments, respectively. Overall, the V4 treated plant presented a higher drainage ratio. This happened because the porosity of the V4 slab (chip:dust ratio) was higher than the others. On the other hand, these results also revealed that there was little leaching in the V2 and V3 treated plants, indicating that the solar radiation and plant growth increased significantly.
The average drainage EC level for each treatment ranged from 1.4 to 1.6 dS·m-1 in the cultivation period (Fig. 3B). From week 45 to 52 of 2022, the EC for all treatments was increased. Then, from week 53 of 2022 to 7 of 2023, the EC value of the V1, V2, V3, and V4 treatments was stable. From week 8 to 10 of 2023, the EC for all treatments increased slightly, reaching the highest point of 2.0, 2.1, 2.2, and 2.0 dS·m-1, respectively, at the week 10 of 2023. It happened due to the amount of light and temperature increased. After that, the value of the EC for all treatments was decreased from week 11 to 13 of 2023. Lee et al. (2023) also reported that drainage EC was increased during the flowering periods in strawberry big pot (height 80 cm or 110 cm) hydroponics, although substrate composition, irrigation amount, and root zone area (e.g., size and shape) are different, affecting drainage pH and EC. The accumulation of salts in the growing medium depends on the salt concentration of the nutrient solution, the irrigation methods (volumes, times and events), the evaporative demands of the environment (Kang and Iersel 2001), and the composition in media (Choi et al. 2013).
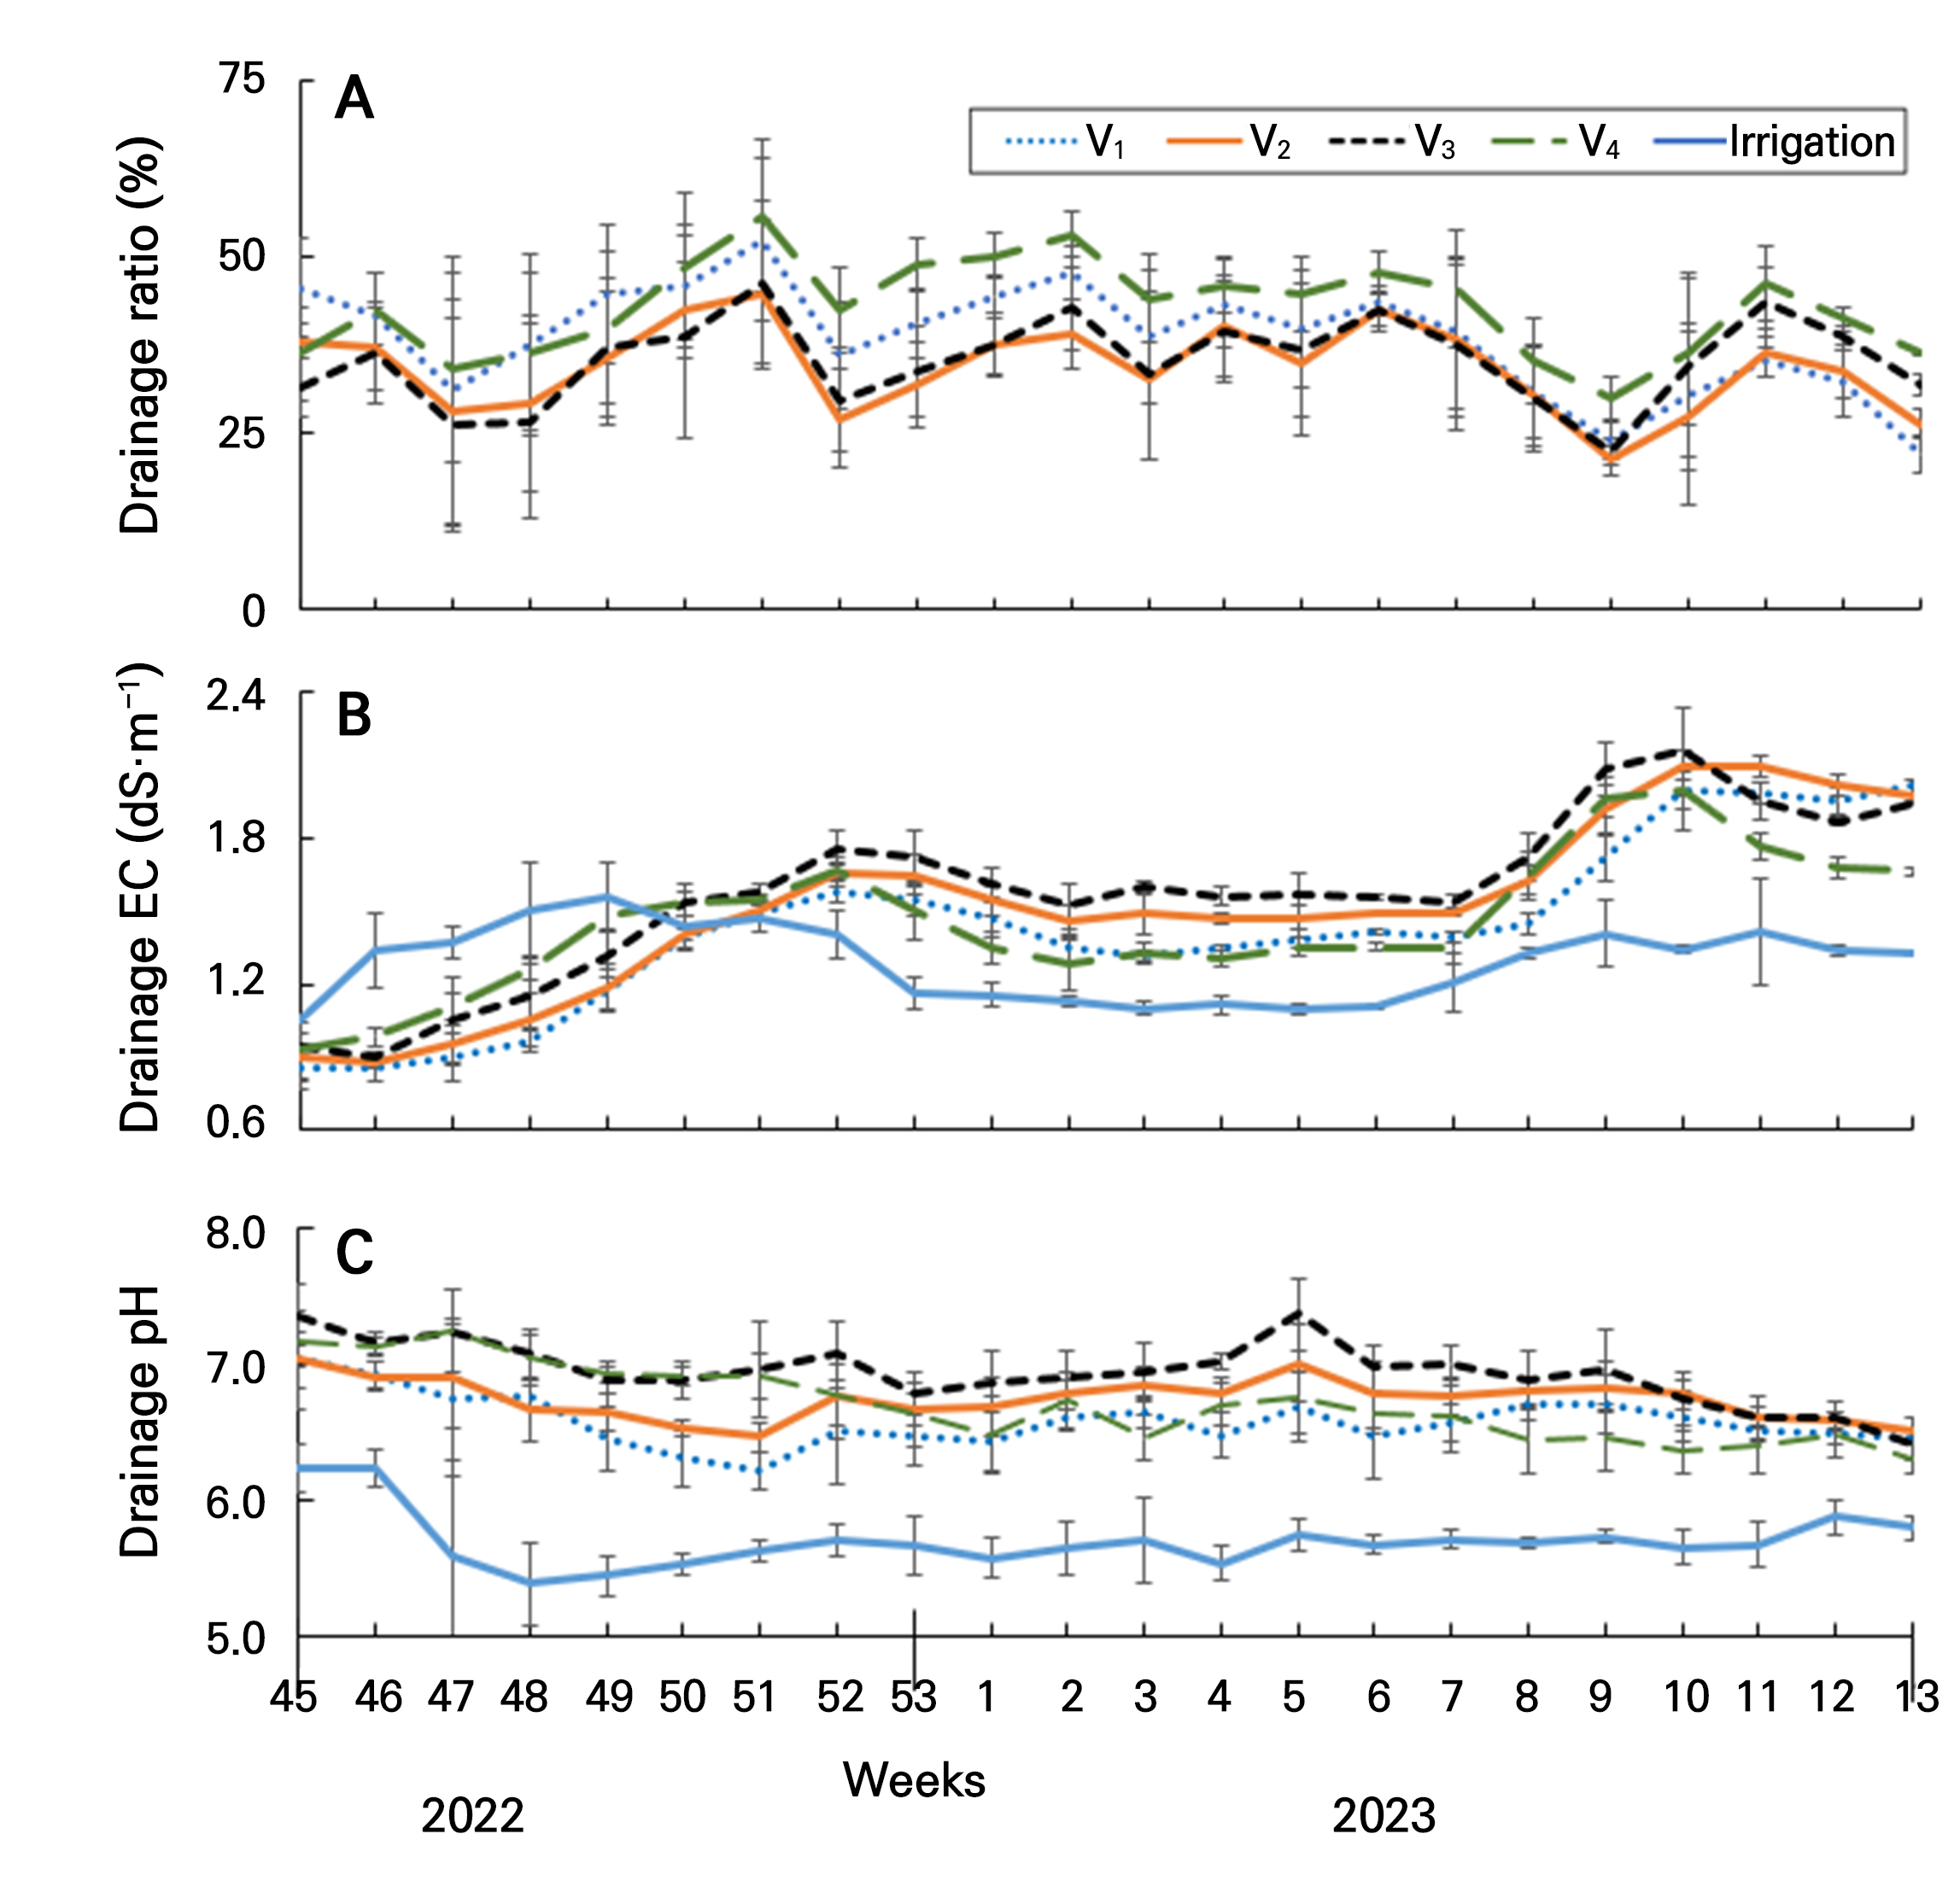
Fig. 3.
Changes of drainage rate (A), drainage EC (B), and pH (C) of strawberries affected by different coir slab volumes. Bars indicated standard deviation (n=22). There are 12 plants in a slab V1 (H 20 cm), V2 (H 15 cm), and V3 (H 12 cm) with chip: dust ratio = 0:10 (v/v), and V4 (H 12 cm) with chip: dust ratio = 5:5 (v/v), respectively.
The drainage pH varied in the entire cultivation period (Fig. 3C). From week 45 to 52 of 2022, the pH for all treatments was decreased. Then, from week 53 of 2022 to 4 of 2023, the pH value of the V1, V2, V3, and V4 treatments was stable. But at the week 5 of 2023, the pH value was the highest in V3 treatment (pH 7.4), followed by V1 (pH 7.0), V2 (pH 6.7) and V4 (pH 7.0). After that, the value of the pH for all treatments was decreased from week 6 to 13 of 2023. It occurred as a result of increased irrigation (data not shown) and temperature.
With respect to the effect of slab volumes on the growth characteristics (Table 1), the results showed that the V2 treated plant had the higher plant height at 36.5 cm than V1 treatment during November. The leaf length of the V2 treated plant was higher than that of the V4 in December. The V2 and V3 treated plants had significantly higher leaf width than V1 in November. Among the treatments, no significant differences were observed for plant height and leaf width (both from December to February), or leaf length (January and February). The study found that the V2 and V3 treated plants had higher petiole lengths in November, December, January, and February, compared to V1 and V4. The crown diameter of the V2 was higher than the V1 treated plant during November and December. The V2 treated plant showed higher SPAD values than the V1 in November and V4 in January. The treatments did not show significant differences in crown diameter from January to February, or SPAD value from December to February. Similarly, there was no significant difference in growth characteristics, such as the plant height, leaf length, leaf width, crown diameter, and SPAD, value in strawberries in the treatment volume of the coir slabs (Hwang et al. 2022). The V2 treatment had a considerably higher plant height and SPAD value compared to the V1 and the V4. Moreover, the petiole length of the V2 and V3 treated plants was longer than that of the other plants. This might have happened due to proper water holding capacity and uptake of nutrient solution by the root, with the higher plant height leading to long petiole length (Niinemets et al. 2004). Therefore, our results indicated that the slab volume influenced the overall petiole length of strawberries as a growth characteristic.
Table 1.
Growth characteristics of strawberries affected by different coir slab volumes from November 2022 to February 2023. There are 12 plants in a slab V1 (H 20 cm), V2 (H 15 cm), and V3 (H 12 cm) with chip: dust ratio = 0:10 (v/v), and V4 (H 12 cm) with chip: dust ratio = 5:5 (v/v), respectively
| Period | Treatment | Plant height (cm) | Leaf | Petiole length (cm) | Crown diameter (mm) | SPAD value | |
| length (cm) | width (cm) | ||||||
| November 2022 | V1 | 32.8 bz | 10.4 c | 8.2 b | 13.6 b | 15.3 b | 46.4 b |
| V2 | 36.5 a | 11.6 ab | 9.5 a | 16.4 a | 17.7 a | 47.4 a | |
| V3 | 33.6 ab | 10.8 bc | 9.2 a | 16.7 a | 15.7 b | 46.6 ab | |
| V4 | 35.0 ab | 11.9 a | 9.0 a | 15.2 b | 17.7 a | 46.9 ab | |
| December 2022 | V1 | 33.1 a | 9.6 ab | 7.7 a | 13.0 b | 19.4 bc | 48.9 a |
| V2 | 34.8 a | 10.3 a | 8.1 a | 13.8 b | 22.0 a | 49.1 a | |
| V3 | 35.0 a | 10.2 ab | 8.2 a | 15.9 a | 18.7 c | 49.1 a | |
| V4 | 34.5 a | 9.3 b | 7.9 a | 13.6 b | 20.3 b | 48.1 a | |
| January 2023 | V1 | 33.4 a | 8.0 a | 6.4 a | 9.7 c | 21.9 a | 47.9 ab |
| V2 | 34.6 a | 8.5 a | 6.7 a | 12.9 a | 21.9 a | 48.9 a | |
| V3 | 34.4 a | 7.7 a | 6.3 a | 11.2 b | 21.6 a | 48.0 ab | |
| V4 | 32.6 a | 8.0 a | 6.4 a | 11.1 bc | 22.4 a | 46.7 b | |
| February 2023 | V1 | 33.3 a | 9.5 a | 7.7 a | 12.7 b | 22.6 a | 46.2 ab |
| V2 | 34.8 a | 9.4 a | 8.0 a | 15.3 a | 23.3 a | 46.9 a | |
| V3 | 33.6 a | 9.3 a | 7.2 a | 14.0 a | 23.1 a | 45.7 b | |
| V4 | 34.2 a | 9.2 a | 7.6 a | 11.7 b | 23.4 a | 46.0 ab | |
| Average | V1 | 33.1 b | 9.0 a | 7.3 a | 11.8 b | 21.3 a | 46.8 ab |
| V2 | 35.4 a | 10.4 a | 8.5 a | 15.2 a | 22.4 a | 48.5 a | |
| V3 | 34.3 ab | 10.1 a | 8.2 a | 15.5 a | 21.2 a | 47.9 ab | |
| V4 | 33.8 b | 8.8 a | 7.3 a | 12.1 b | 20.1 a | 46.5 b | |
The photosynthesis rate and transpiration rate did not show any significant differences among the treatments (Fig. 4). This is a similar result to Hwang et al. (2022) study that found that the medium with different heights did not show any significant difference in photosynthesis rate, and transpiration rate.
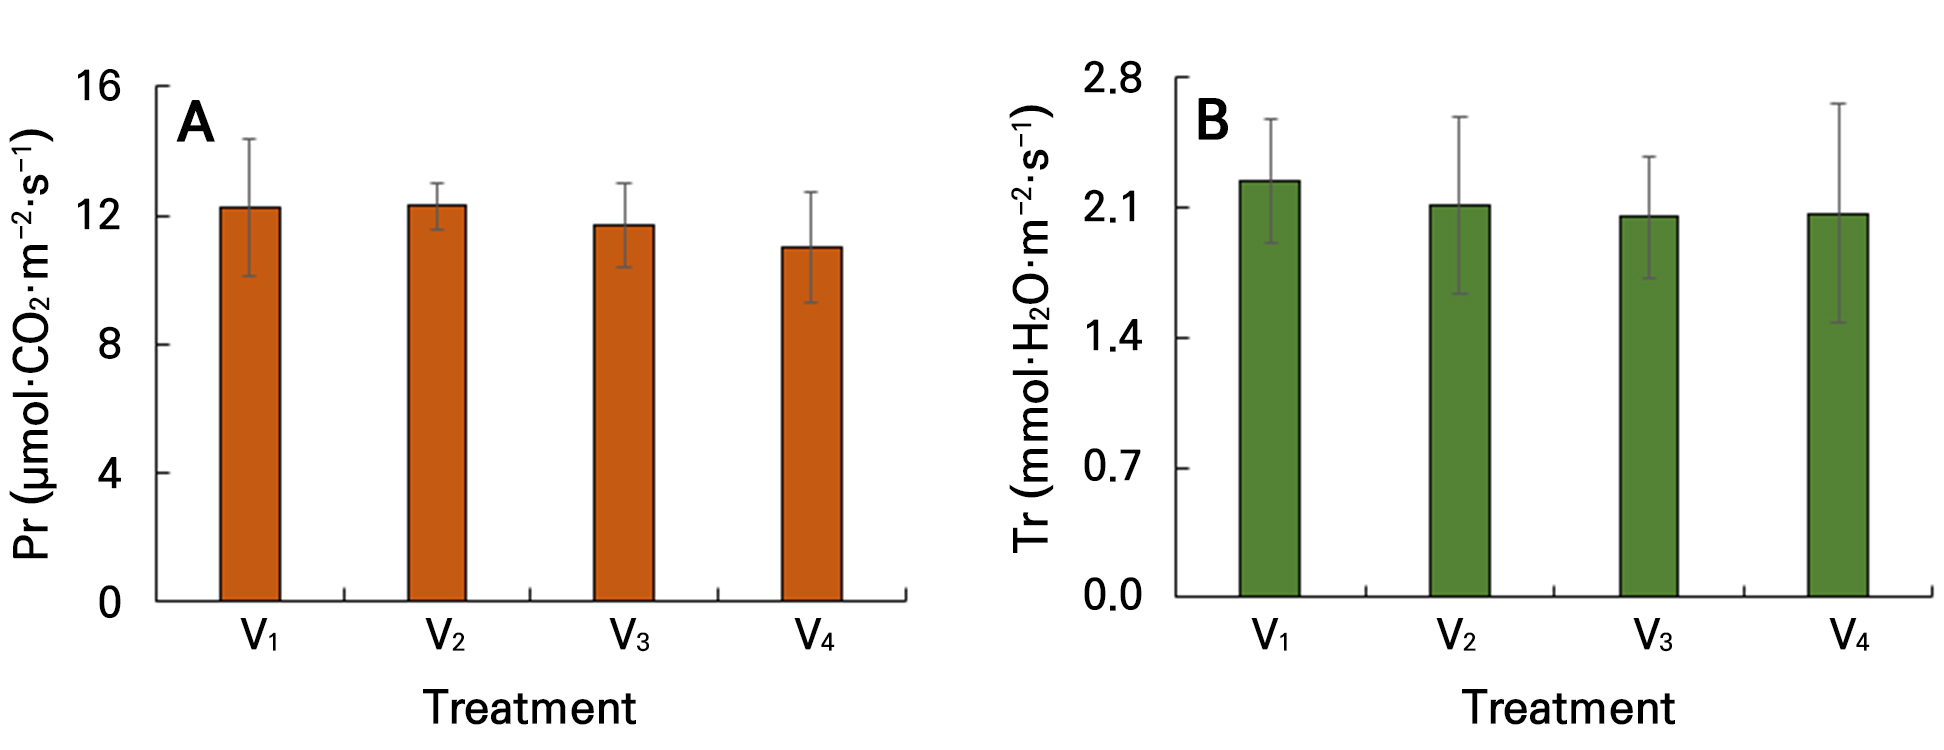
Fig. 4.
Photosynthesis rate (Pr, A) and transpiration rate (Tr, B) of strawberries affected by different coir slab volumes at 119 days after treatment. Measurement conditions were 20°C temperature; 400 µmol·m-2·s-1 CO2 concentration and 1,000 µmol·m-2·s-1 photosynthetic photon flux density (PPFD). Bars indicated standard deviation (n=3). There are 12 plants in a slab V1 (H 20 cm), V2 (H 15 cm), and V3 (H 12 cm) with chip: dust ratio = 0:10 (v/v), and V4 (H 12 cm) with chip: dust ratio = 5:5 (v/v), respectively.
Strawberry yield was affected by different slab volumes (Fig. 5A). The yield of V2 was 1.4 kg per slab, which was 55.6% higher than that of the V4 (0.9 kg per slab) treated plant during December. Similarly, the yield in V3 (0.2 kg per slab) was 100% higher than in the V1 and V4 (both 0.1 kg per slab) treated plants in January. The yield was 2.1 kg per slab for both V2 and V3 which was 16.7% (both) higher than in the V1 and V4 treated plants in March. Overall, the yield in the treatment V2 and V3 were the highest in December and January, respectively. The fruit yield did not show any significant difference among the treatments in November and February. This might have occurred because the V2 and V3 slabs had lower drainage rates; as a result, the root zone managed sufficient moisture with available nutrient transportation, which encourages fruit production. This result is similar to Hwang et al. (2022) research, which found that the total yield was higher in 15 cm coir dust slab than the others, Lee et al. (2018) stated that due to the good root moisture, the yield of fruit was large in coir dust medium.
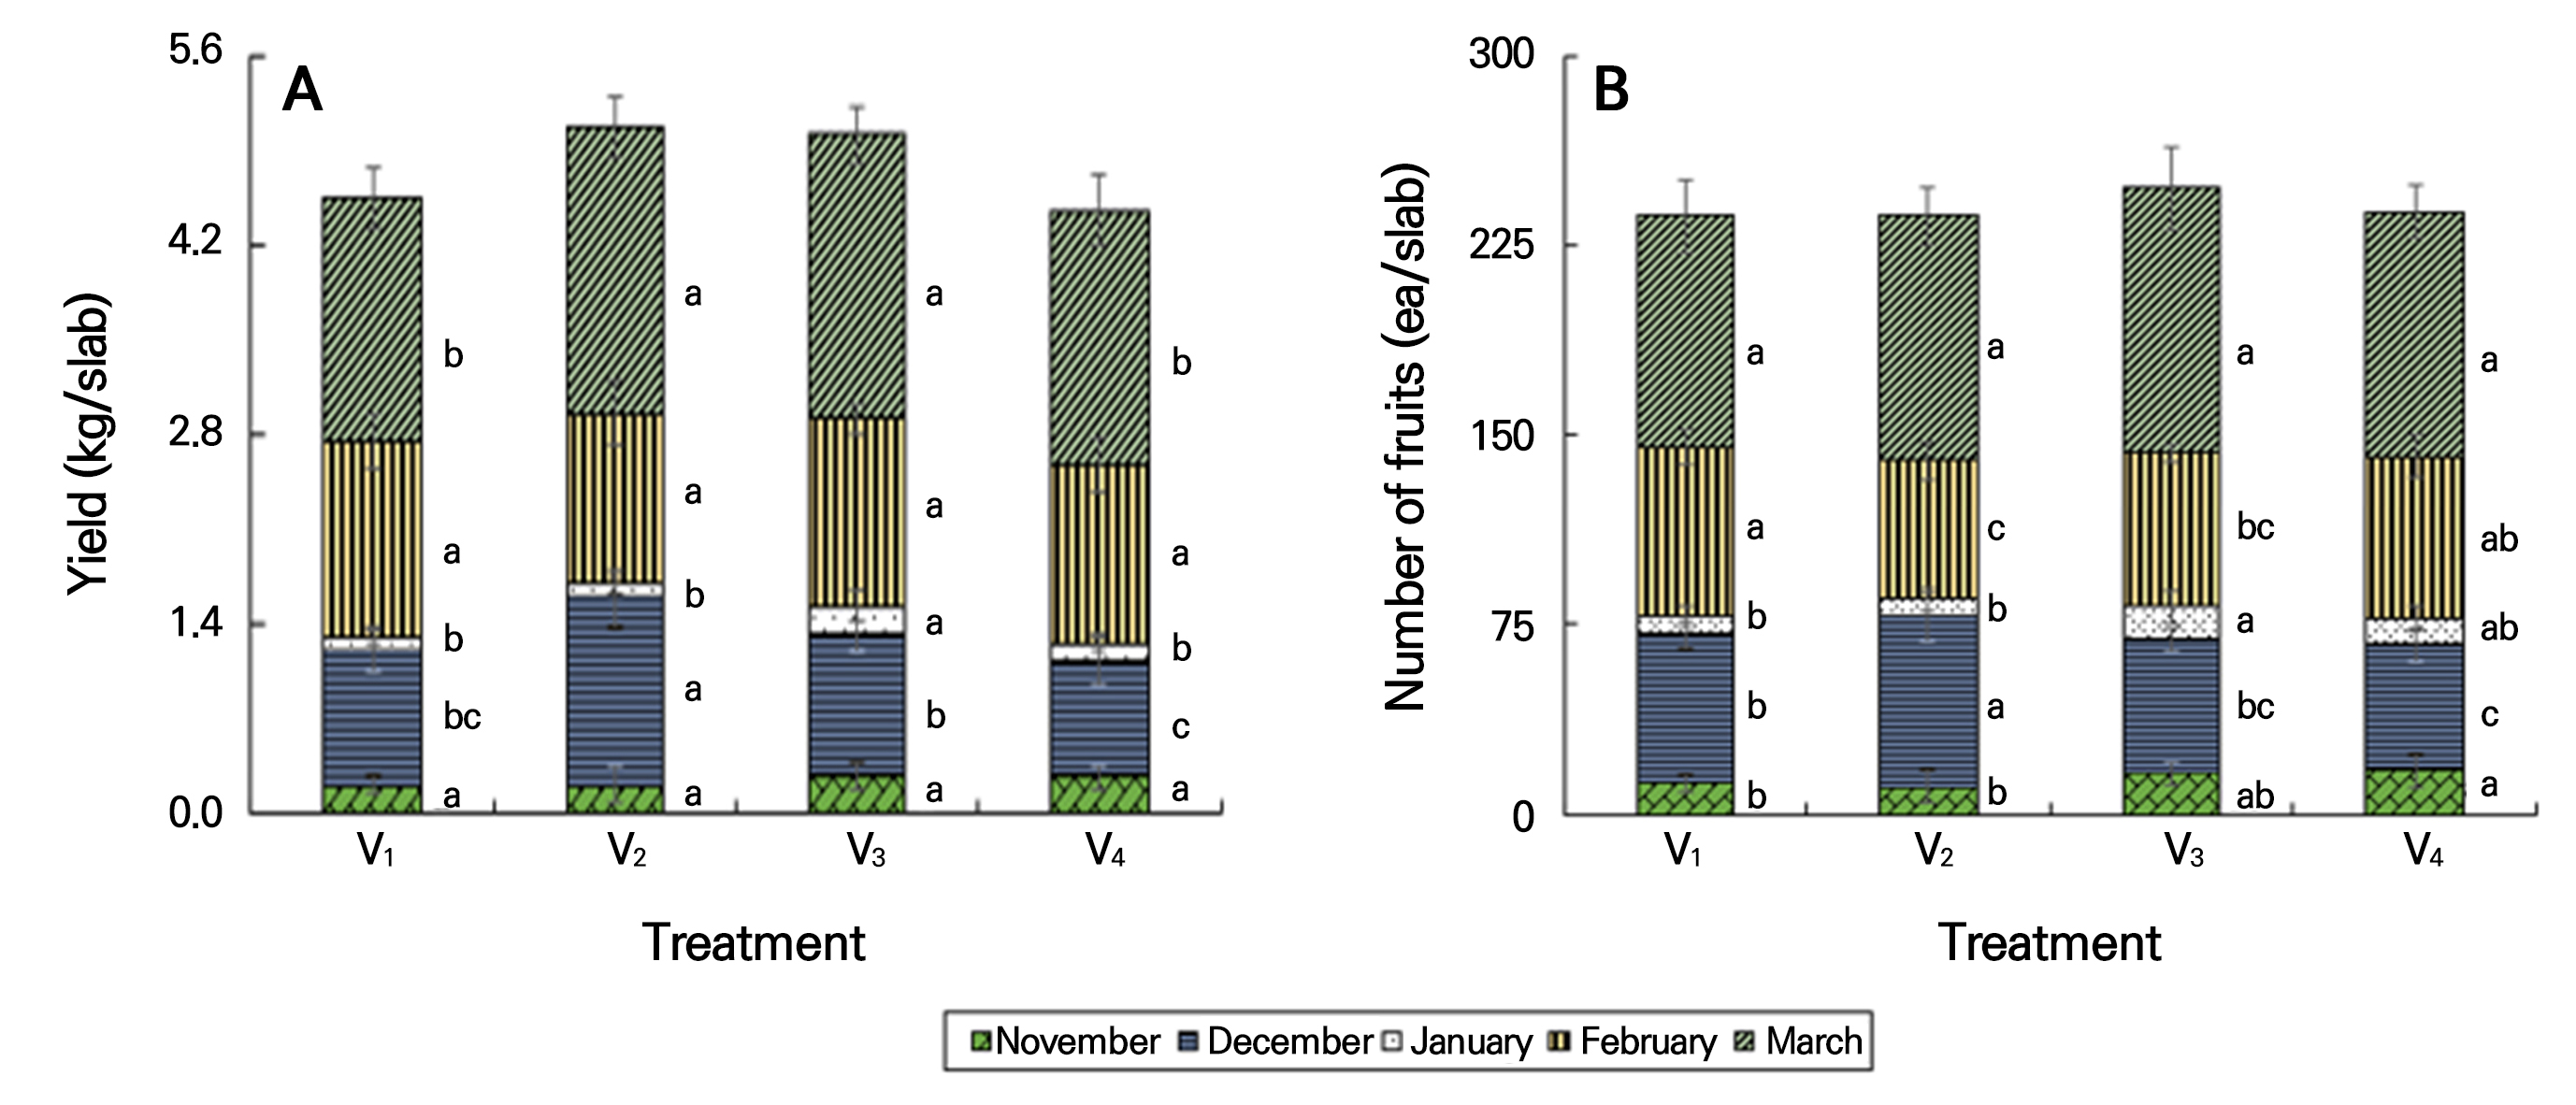
Fig. 5.
Yield (A) and number (B) of strawberries affected by different slab volumes from November 2022 to March 2023. The means with different letters within the column are significantly different according to Duncan’s multiple range test at p < 0.05. Bars indicated standard deviation (n=10). There are 12 plants in a slab V1 (H 20 cm), V2 (H 15 cm), and V3 (H 12 cm) with chip: dust ratio = 0:10 (v/v), and V4 (H 12 cm) with chip: dust ratio = 5:5 (v/v), respectively.
The number of strawberry fruit was affected by different slab volumes (Fig. 5B). The number of fruits for the V2 was 67, which was 13.6% and 34.0% higher than the V1 and V4 treated plants at 59% and 50%, respectively, in December. The number of fruit in the V3 was 13, which was 43.9% and 20.4% higher than that of the V1 and V4 treated plants at 7.3% and 10.8%, respectively, in January. The number of fruit was higher in the V2 and V3 than in the V1 treated plant in March. Overall, the number of fruit in the treatment V2 and V3 were the highest in December and January, respectively. The number of fruit did not show any significant difference among the treatments in November and February.
The weight of fruit for each treatment was affected by different slab volumes showed in Fig. 6. The weight of fruit was higher in the V2 at 20.9 g, than in the V4 treated plant, at 16.9 g in November. The V2 (20.5 g) treated plant showed 22.8 and 18.5% higher value than the V1 and V4 at 16.7 and 17.3 g, respectively, in December. The V3 (16.5 g) treated plants showed 17.9 and 33.1% higher value than the V1 and V4 at 14.0 and 12.4 g, respectively, in January. The lowest weight of fruit for every treatment was in January, because January was the ending time of the fast cluster, and the beginning time of the second cluster fruit. The V2 (22.9 g) treated plant had 7.5 and 11.2% higher value than the V1 and V4 at 21.3 and 20.6 g, respectively, in February. The weight of fruit of the V2 treated plant was higher than that of V1 and V4 in March. This may have happened due to adequate moisture in the root zone that promotes nutrient absorption and ion concentration, which is suitable for fruit development. Lee et al. (2018) stated that when the dust content of the coir medium is high, the fruit weight is large, due to the root weight also being good.
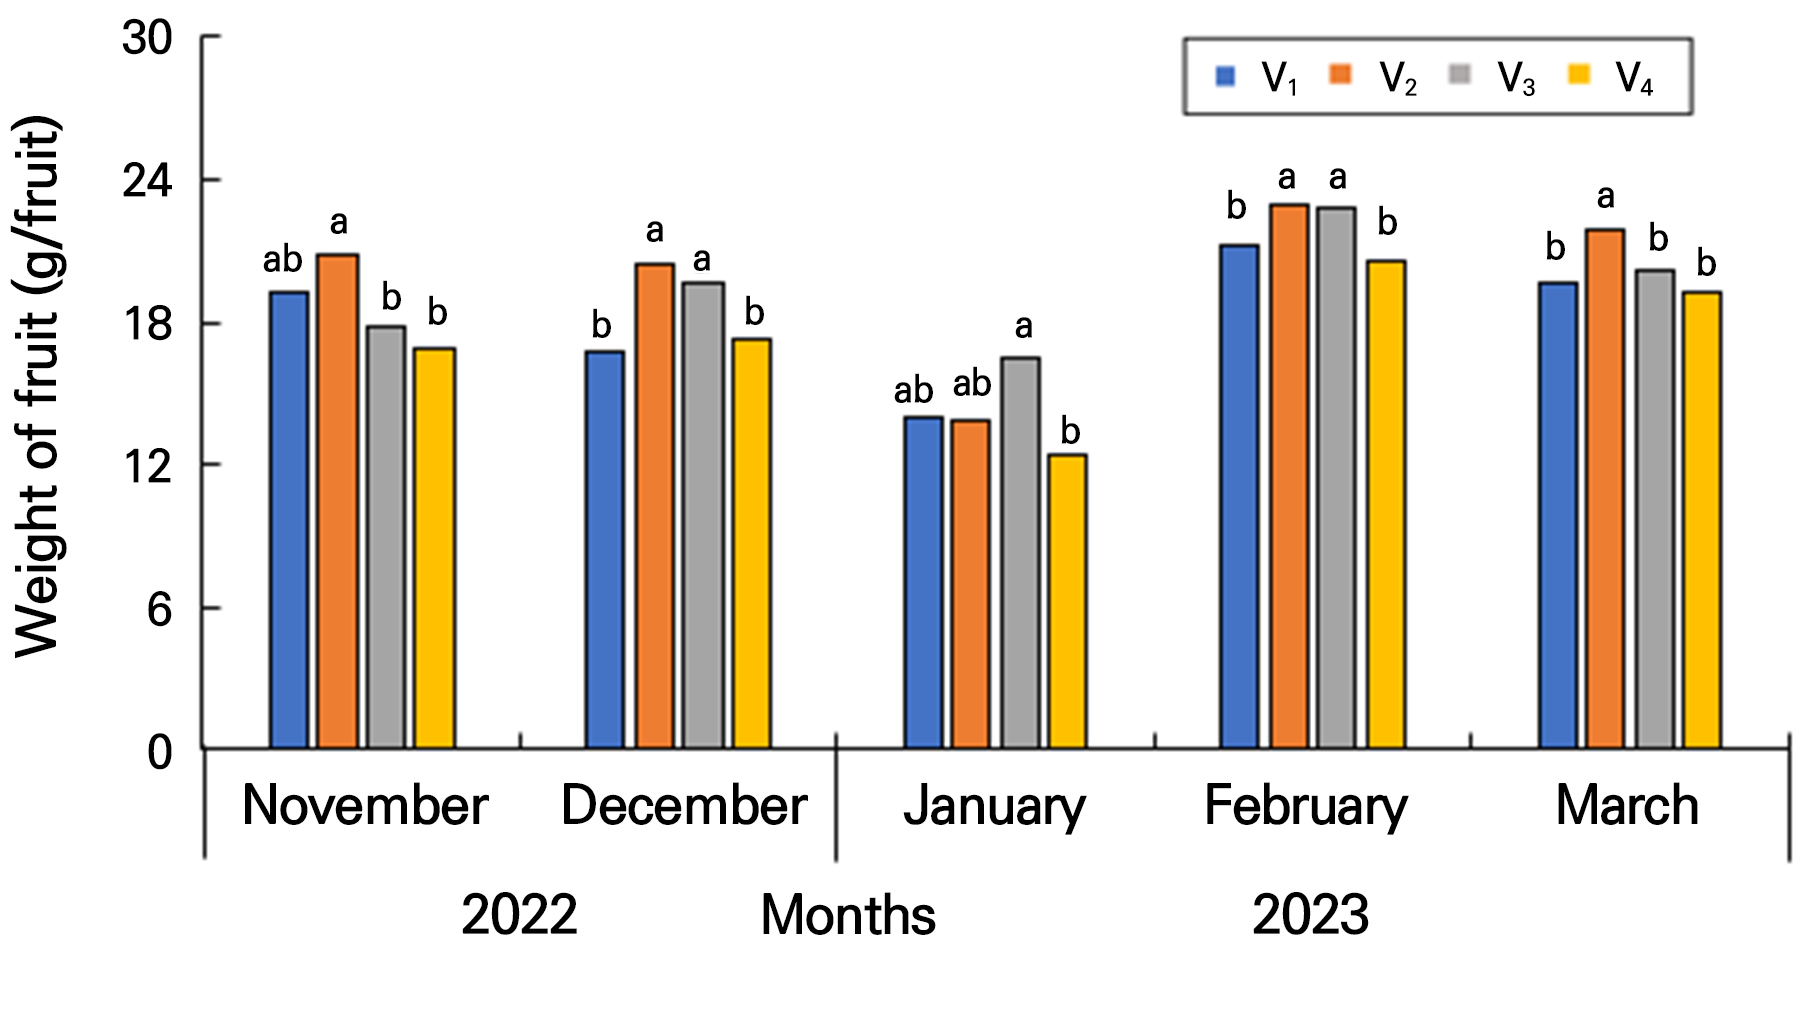
Fig. 6.
Weight of fruit affected by different slab volumes from November 2022 to March 2023. The means with different letters within the column are significantly different according to Duncan’s multiple range test at p < 0.05 (n=10). There are 12 plants in a slab V1 (H 20 cm), V2 (H 15 cm), and V3 (H 12 cm) with chip: dust ratio = 0:10 (v/v), and V4 (H 12 cm) with chip: dust ratio = 5:5 (v/v), respectively.
Table 2 shows the quality parameters of strawberry results. The soluble solid content of the V2 was 12.5°Bx which was 21.4 and 22.6% higher than that of the V1 and V4 treatments at 10.3 and 10.2°Bx, respectively. Similarly, compared to the V1 and V4 treatments at 10.3 and 10.2°Bx, the soluble solid content of the V3 (12.8°Bx) was greater by 24.3 and 25.5%, respectively. The fruit acidity was significantly higher in the V2 and V3 (both 1.1%) than the V1 and V4 treated plant, respectively. Regarding the firmness, the V2 and V3 treated plants had larger values than the V1 and V4. The increase in fruit quality parameters may be attributed to the enhanced nutrient availability and better uptake of nutrients by plant from their rhizosphere. Verma and Rao (2013) found that nutrients availability has significant effects on fruit quality in different treatments. Other studies (Giordani et al. 2023) indicate that different slab volumes (Growing medium mixed with peat) resulted in variations in the fruit quality attributes.
Table 2.
Quality parameters of strawberries affected by different coir slab volumes from November 2022 to March 2023. There are 12 plants in a slab V1 (H 20 cm), V2 (H 15 cm), and V3 (H 12 cm) with chip: dust ratio = 0:10 (v/v), and V4 (H 12 cm) with chip: dust ratio = 5:5 (v/v), respectively
| Treatment |
Soluble solid content (°Bx) |
Acidity (%) |
Soluble solid content- acid ratio (%) |
Firmnessz (N/φ3 mm) |
| V1 | 10.3 by | 0.9 b | 12.0 | 0.9 c |
| V2 | 12.5 a | 1.1 a | 11.6 | 1.2 a |
| V3 | 12.8 a | 1.1 a | 12.0 | 1.1 b |
| V4 | 10.2 b | 0.8 b | 12.5 | 0.8 d |
The total retained water volume and water use efficiency were measured among the four treatments shown in Fig. 7. Among the treatments, the V2 and V3 treated plant showed the highest retained water volume of 205.5 and 198.9 L/slab, respectively. On the other hand, the lowest value of retained water volume was in the V4 (181.7 L/slab). The water use efficiency (WUE) did not show significant variation among the treatments. That may indicate that the porosity of treatment V4 was higher than the others. For this reason, it contained little water, and the retained water volume was the lowest. The growth of strawberry plants is influenced by water (moisture) retention capacity around the root media being available (Lee et al. 2018).
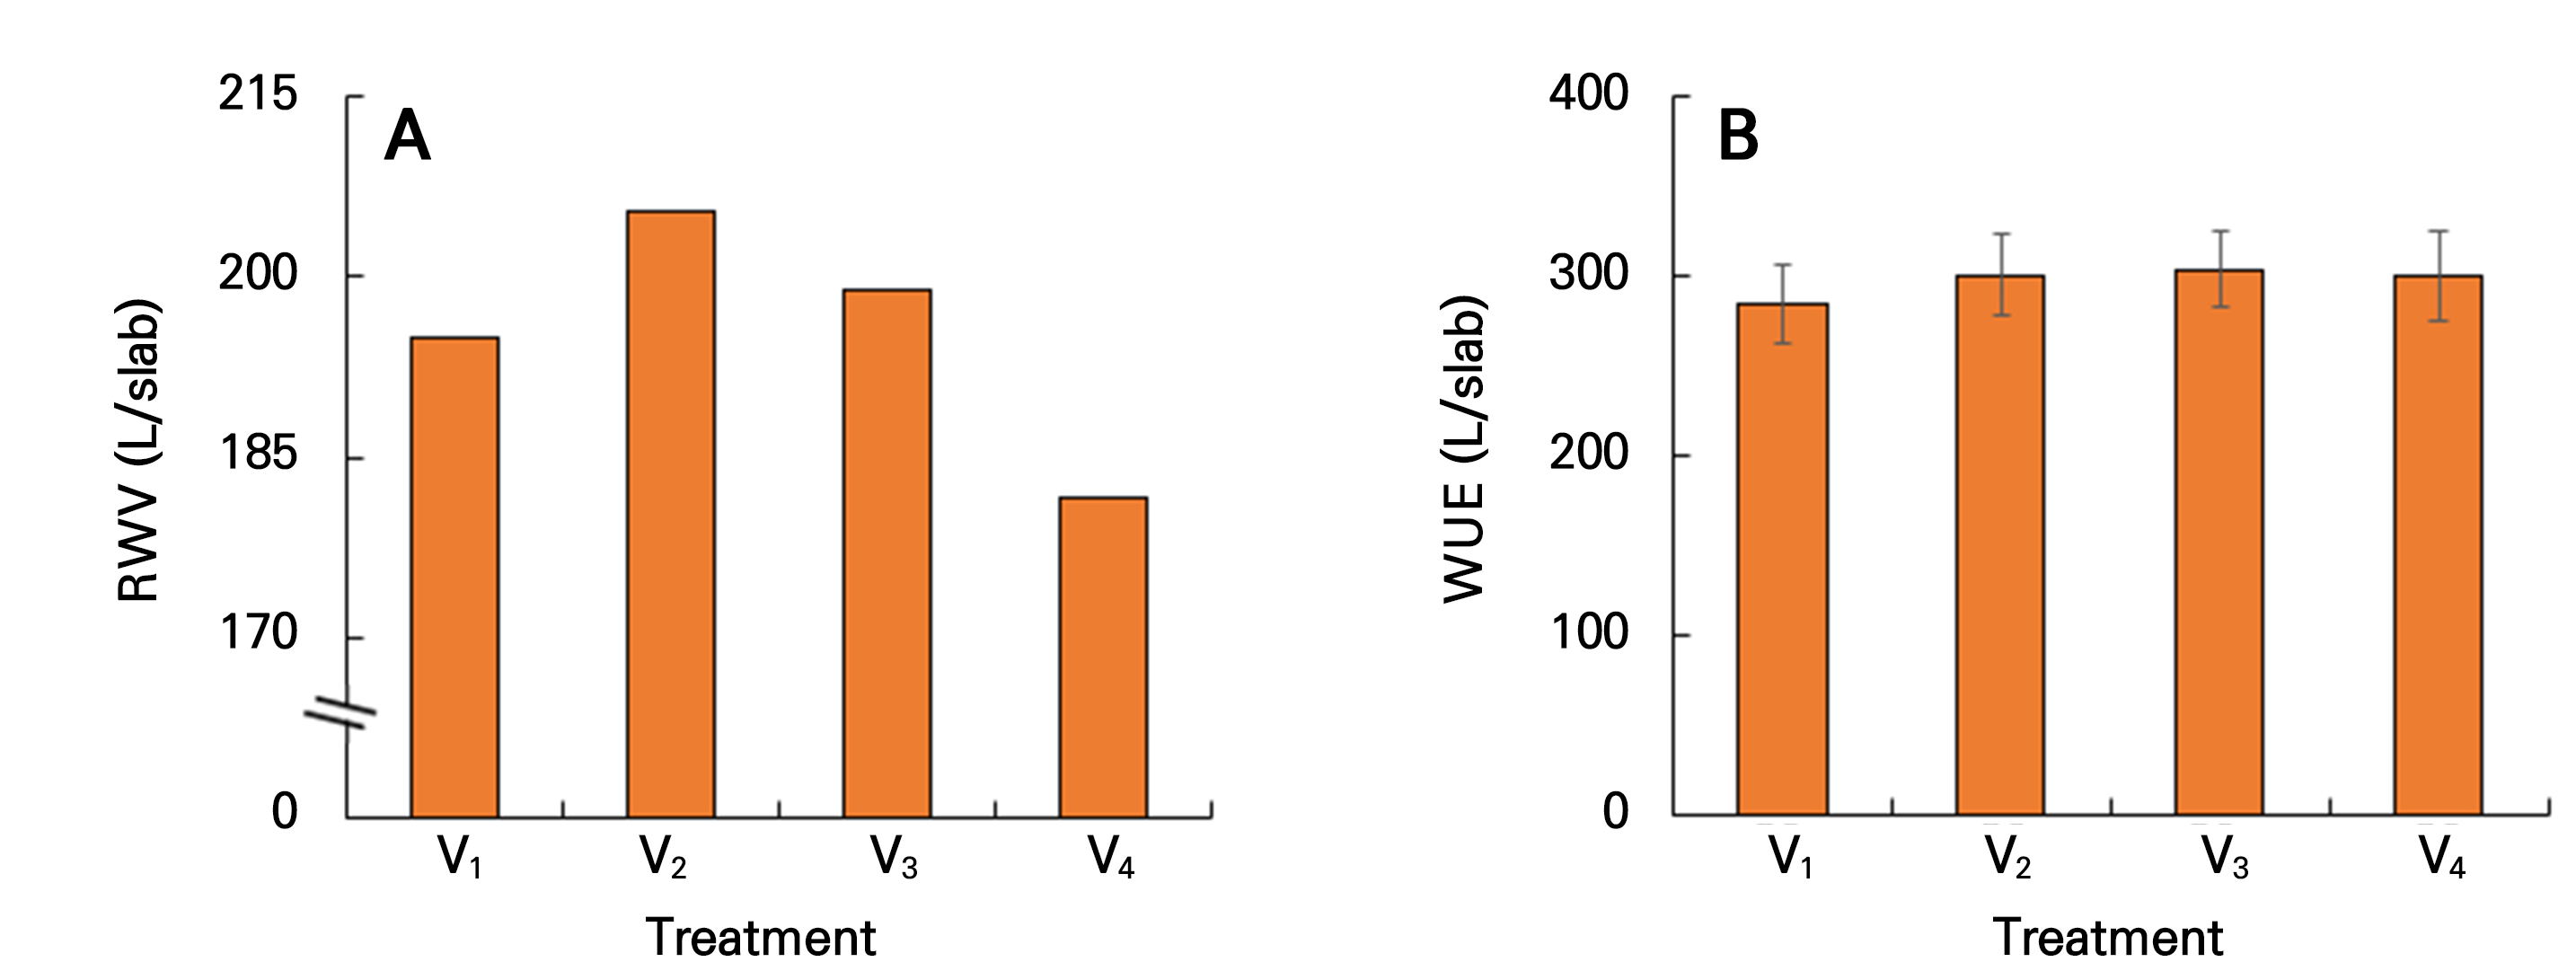
Fig. 7.
Retained water volume (RWV, A) and water use efficiency (WUE, B) of strawberries affected by different slab volumes from November to March. Bars indicated standard deviation (n=10). There are 12 plants in a slab V1 (H 20 cm), V2 (H 15 cm), and V3 (H 12 cm) with chip: dust ratio = 0:10 (v/v), and V4 (H 12 cm) with chip: dust ratio = 5:5 (v/v), respectively.
Principal component analysis (PCA) was conducted to obtain an overview of the interrelationship among the variables (Fig. 8). After performing PCA, Dim1 explained 66.7% and Dim2 explained 20.8% of the variabilities. The graph indicates that the variables irrigation volume, fruit number, fruit weight and retained water volume showed similar dynamics with highest value for V2 and V3 treatments. These aforementioned variables represented positive correlation, but were opposite in comparison to water use efficiency. Long arrows (drainage volume) contribute significantly to variation in the data for all treatments. Elzopy et al. (2023) also found that irrigation volume and fruit production are positively affected.

Fig. 8.
Principal component analysis (PCA) showing the relationships between treatments and different parameters of strawberries. The direction of the arrow shows how that variable contributes to the principal components. The colored dots (red, sky blue, navy blue and green dot means V1, V2, V3 and V4, respectively) represent the values of the principal components for the different treatments. The lines starting from the middle point of the biplots showed the positive or negative associations of the different parameters and their degree of correlation. There are 12 plants in a slab V1 (H 20 cm), V2 (H 15 cm), and V3 (H 12 cm) with chip: dust ratio = 0:10 (v/v), and V4 (H 12 cm) with chip: dust ratio = 5:5 (v/v), respectively.
Conclusion
The study found that V2 and V3 treated plants had lower drainage ratio compared to V1 and V4. These plants also showed higher growth characteristics, including petiole length and plant height. Further, the growth characteristics such as the plant height, leaf length, leaf width, crown diameter, and SPAD value, developed at different rates. The V2 and V3 treatments showed higher yield, fruit number, and weight of fruit, as well as higher fruit quality in terms of soluble solid contents, acidity, and firmness. The treatment did not significantly affect the photosynthesis rate and the transpiration rate under photosynthetic photon flux density (PPFD) at 1,000 µmol·m-2·s-1. The V2 and V3 treated plants had higher retained water volume compared to V1 and V4. The water use efficiency (WUE) did not show significant variation among the treatments. Now-a-days, farmers no longer use slab volumes for their strawberry production in a wide range. The V2 and V3 treatments had lower drainage volumes (data not shown) and rates, so these treatments were more cost-effective for the growth and yield of strawberries in hydroponics system. On the other hand, the V4 treatments had higher drainage ratio, but low water retention due to their high porosity. However, strawberries are water-intensive crops; further research is needed for irrigation control with chip content to ensure sufficient strawberry production.
