Introduction
Materials and Methods
Plant Materials
Preparation of GBS Libraries
De novo GBS Data Analysis
Results and Discussion
Introduction
Chrysanthemums, often called ‘mums’ or ‘chrysanths’ (family Asteraceae, genus Chrysanthemum), are one of the most important crops in the flower industry, presenting a wide diversity in flower types, petal colors, and petal shapes. Chrysanthemum also had a substantial cultural influence, and is used in traditional herbal medicine due to its anti-inflammatory and antipyretic properties (Iwatsuki et al., 1997; Zhang et al., 2014). Forty-one Chrysanthemum species occur in different temperature zones across China, Japan, and Korea (Iwatsuki et al., 1997). The three main wild native Chrysanthemum species (C. zawadskii, C. indicum, and C. boreale) in Korea are morphologically variable, widely distributed, and present an extremely complex genetic background (Kim et al., 2014).
Genetic diversity studies are necessary for germplasm identification and classification of native Korean Chrysanthemum spp. populations. Over the last decades, next generation sequencing (NGS) replaced Sanger sequencing in studies based on molecular markers. Simple sequence repeat (SSR) markers, for example, were developed by sequencing the transcriptome of C. nankingense (Wang et al., 2013), and the further development of NGS technologies allowed for the use of single nucleotide polymorphisms (SNPs) as genotyping markers in phylogenetic and phylogeographic research (Chong et al., 2016). Several NGS methods have been used for cost effective development of SNP markers, including restriction-site associated DNA sequencing (RADseq; Baird, 2008), complexity reduction of polymorphic sequences (CRoPSTM ; van Orsouw et al., 2007), and genotyping by sequencing (GBS; Elshire et al., 2011). These methods allow for the identifying and genotyping of large numbers of variants using a reduced representation of the genome, and GBS has been widely used in plant genetics and breeding. In crop breeding, GBS was successfully applied to SNP marker discovery, genomic selection (GS), haplotype identification, genome-wide association studies (GWAS), and quantitative trait locus (QTL) analysis (Fu et al., 2014, 2016). This methodology showed rapid and cost effective high throughput results in association mapping, and allowed for the investigation of genome-wide plant genetic variation and genomic structure (Deschamps et al., 2012; Fu et al., 2014, 2016; He et al., 2014; Kagale et al., 2016; Poland and Rife, 2012; Scheben et al., 2016).
The GBS method uses endonucleases to reduce genomic complexity and a barcode system to multiplex template DNA to generate representation libraries (Davey et al., 2011). This genomic reduction is accomplished using restriction enzymes (REs), and selecting proper REs is critical for species-specific GBS optimization. In plants, the REs ApeKI, PstI, and EcoRI are generally used and combined with cutter enzymes such as MspI, MseI, and HpaII depend on genomic specificity of each species. Genome organization, repeat element methylation, and size are considered in GBS optimization (Rabbi et al., 2014). Successful GBS relies on the existence of reference genome sequence information, but this is generally limited in crops like Chrysanthemum spp. However, bioinformatics pipelines for GBS analysis without a reference genome have been developed and successfully used (Zhang et al., 2014).
In the present study, three RE combinations (ApeKI, ApeKI/MseI, and ApeKI/MspI) were tested for GBS optimization and the Stacks software pipeline (http://catchenlab.life.illinois.edu/stacks/) was used for de novo GBS analysis (Catchen et al., 2011; Elshire et al., 2011) without a Chrysanthemum spp. reference genome information.
Materials and Methods
Plant Materials
A total of 185 wild native Korean C. boreale, C. indicum, and C. zawadskii germplasms were collected from the field and grown in a greenhouse (25 ± 2°C) at the Chrysanthemum Research Institute of Sejong University, South Korea. Each three fresh young leaves were sampled from eight wild Chrysanthemum spp. populations, and their DNA was extracted using the G-Spin IIp Genomic DNA Extraction Kit for Plants (INTRON Biotechnology, Inc., Seongnam, Gyeonggido, Korea).
Preparation of GBS Libraries
Extracted DNA was quantified using the Quant-iT PicoGreen dsDNA Assay Kit (Molecular Probes, Eugene, OR, USA), following the manufacturer’s instructions, and the Synergy HTX Multi-Mode Reader (Biotek, Winooski, VT, USA), and normalized to 20 ng DNA/µL. These DNA samples were then digested with ApeKI only (for 2 h at 75°C), or with an ApeKI/MseI, or ApeKI/MspI mixture for 2 h at 37°C followed by 2 h at 75°C. The RE combinations were selected to encourage active adapter ligation when inserting DNA.
Libraries resulting from these three RE digestions were constructed as previously described (De Donato et al.,2013; Elshire et al., 2011), with minor modifications. Digested DNA was ligated to genomic DNA using adapters containing different barcodes for tagging individual samples and common adapters. This ligation was performed using T4 DNA ligase (New England Biolabs, Inc., Ipswich, MA, England) at 22°C for 2 h, and then inactivated by holding samples at 65°C for 20 min. The DNA ligations were designed so that REs recognition sites did not appear in the adapter sequence after inserting the DNA.
The three sets of each of the eight ligated DNA samples that resulted from the three RE combinations were pooled into one sample and purified using the QIAquick PCR Purification Kit (Qiagen, Inc., Hilden, Germany). Pooled DNA samples were amplified in 50 µL multiplex PCR reactions using the AccuPower Pfu PCR Premix (Bioneer, Inc., Daedeok, Daejeon, Korea) and 25 pmol of each primer
5’-ATGATACGGCGACCACCGAGATCTACACTCTTTCCCTACACGACGCTCTTCCGATCT-3’ and
5’-AGCAGAAGACGGCATACGAGATCGGTCTCGGCATTCCTGCTGAACCGCTCTTCCGATCT-3’.
Amplicons were used to evaluate the fragment size distribution by automated electrophoresis in a BioAnalyzer 2100 (Agilent Technologies, Santa Clara, California, USA). The GBS Barcode Generator was used to design GBS libraries for all barcode sequences, and common adapters were modified to allow the paired-end sequencing of 150 bp single-end reads on the Illumina NextSeq 500 platform (Illumina, San Diego, CA, USA), following the manufacturer’s instructions.
De novo GBS Data Analysis
Per-base quality control and removal of potential adaptor sequences from raw reads were performed using fastQC (https://www.bioinformatics.babraham.ac.uk/projects/fastqc/) and Trimmomatic (http://www.usadellab.org/cms/index.php?-page=trimmomatic) software, respectively. Stacks software was then used for variant calling without a reference genome. Demultiplexing and cleaning of raw sequence reads were first conducted using the ‘process_radtags’ module. The clean data were then used as input for the ‘denovo_map’ module, in which loci were built and variants were called. A final variant call file was created using the ‘populations’ module.
Results and Discussion
Genome wide SNP marker development is prerequisite for advanced genetic studies, GWAS, genomic selection, and the genomic breeding of crops. Genome wide SNP could be developed through whole genome resequencing, but the cost for large population analysis is enormous. Therefore, cost effective genome reduction sequencing methods like GBS and RADseq were developed. GBS is a restriction-based DNA sequencing technique and the most economical method for generating genome wide SNP of populations without the reference genome information. The GBS process involves multiple steps, from library preparation to de novo assembly and SNP calling. Parameters of the complexity of the GBS library, sequencing depth and SNP calling should have an influence on the efficiency and accuracy of the GBS results. Many aspects including RE selection, fragment size selection, repetitiveness, quality and quantity of the short read data, as well as the bioinformatics pipeline alter the outcome of GBS (Elshire et al., 2011; Rabbi et al., 2014). There are two critical factors in the GBS procedure, the first is the approved RE for the level of multiplexing and the second is complexity reduction. To sequence the GBS libraries, which was made by the same set of DNAs, we optimized three RE groups to analyze the differences in library attributes. After running PCR processing amplification, the number of cutting sites and the range of fragment sizes were described in the GBS libraries. In our research, the important properties of GBS libraries were the raw reads, good barcoded reads, tags, median read depth per locus, and scorable SNPs.
Three RE combinations (ApeKI, ApeKI/MspI, and ApeKI/MseI) were tested for Chrysanthemum spp. GBS library construction based on genome size (3 Gbp, Vallès et al., 2013; Luo et al., 2016) and DNA methylation. As shown in Fig. 1, ApeKI and ApeKI/MspI performed a partial digestion of the genomic DNA, as evidenced by the upper band in lanes C and

E. Because ApeKI (G/CWGC) and MspI (C/CGG) are GC-rich sequence recognition enzymes and cannot cut AT-rich DNA regions; conversely, MseI (T/TAA) recognizes AT-rich sequences. Thus, the partial patterns shown in ApeKI and ApeKI/MspI digestions could be due to a long AT-rich region in the Chrysanthemum genome. Moreover, MspI and MseI are not sensitive to deoxyadenosine methylation (Dam), DNA cytosine methylation (Dcm) or CpG methylation; therefore, they are not influenced by DNA methylation (May et al., 1975; Hattman et al., 1978). On the contrary, ApeKI is blocked by overlapping CpG methylation, which affects ApeKI digestion. Although the GC content of Chrysanthemum spp. genome is not yet available, some plant genomes were reported to have a low GC content (34.7%) and contain more AT-rich regions (Barow and Meister, 2002). A Chrysanthemum genome-sequencing project is therefore necessary to supply detailed information on this subject. Library construction was still carried out for the partially digested ApeKI and ApeKI/MspI DNA, as partial digestion is a genome characteristic. It also allowed for the comparison of partial and complete digestion of genomic DNA for constructing GBS libraries.
Library quality was analyzed with a BioAnalyzer 2100 and the results for the three libraries are summarized in Fig. 2. The ApeKI/MseI library shows a smoother line than the others and a typical 250 bp shoulder, indicating a good library signature (Liu et al., 2011; Kim et al., 2013). Prominent sharp repeat DNA peaks were obtained in ApeKI and ApeKI/MspI libraries and thus, MseI library presented the highest quality.
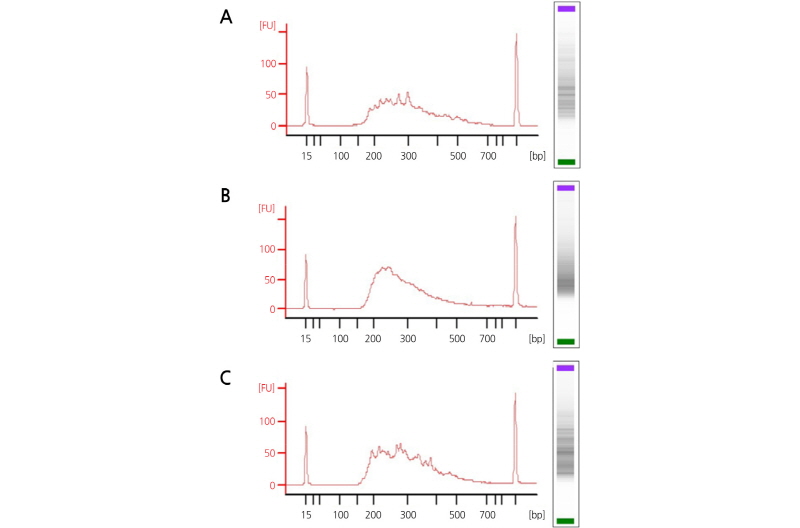
Fig. 2.
BioAnalyzer profiles of GBS libraries constructed from the DNA digested using three restriction enzymes: (A) ApeKI; (B) ApeKI/MseI; (C) ApeKI/MspI. DNA fragment sizes are indicated on the X-axis [(bp), base pairs], and DNA abundance on the Y-axis [(FU), fluorescence units]. The BioAnalyzer traces the input Chrysanthemum DNA sample to show the desired size selection within 150-500 bp size range.
Eight chrysanthemum accessions were used to produce each RE library and the three sets of eight ligated DNAs from the three RE combinations obtained for each accession were pooled into a single sample for use in the barcode system. We generated 18-Gbp of NGS data by Illuminasequencing using 150-bpsingle-end reads,and raw sequencereadswereanalyzed
(B) ApeKI/MseI; (C) ApeKI/MspI. DNA fragment sizes are indicated on the X-axis [(bp), base pairs], and DNA abundance on the Y-axis [(FU), fluorescence units]. The BioAnalyzer traces the input Chrysanthemum DNA sample to show the desiredsize selection within150-500bp sizerange.
in the Stacks de novo GBS pipeline.
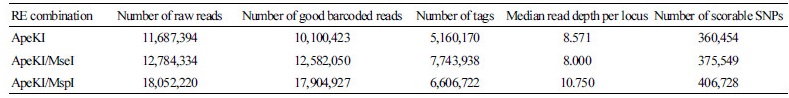
The GBS results obtained for the three libraries were analyzed at five levels (Table 1); number of raw reads (quantity of raw data produced), number of good barcoded reads (quantity of properly processed, cloned, amplified, and sequenced reads), number of tags (loci number, indicating the genome reduction rate), read depth per locus (total number of reads mapped to loci), and scorable SNPs (number of identified SNPs). The number of raw and good barcoded reads were similar within each library, indicating that most GBS reads were properly generated. On the other hand, the number of raw reads, good barcoded reads, tags, and SNPs consistently varied among the RE combinations. As expected from the incomplete ApeKI digestion, this library had the lowest number of raw and good barcoded reads. The ApeKI/MseI library had 9.4% more raw reads than the ApeKI library but 29.2% less raw reads than the ApeKI/MspI library; however, the ApeKI/MseI library had the highest number of tags, providing 60.6% more tags than the ApeKI library. The ApeKI/MspI library had more raw and good barcoded reads than the ApeKI/MseI library but less tags, and the highest median read depth per locus. This could be explained by the low production of GBS target fragments and saturation of sequence reads. The ApeKI/MseI library showed the highest tag number and the lowest read depth. Thus, data production was low in the ApeKI/MseI library, which compromised the number of SNPs.
Table 1. Propertiesofthegenotyping-by-sequencinglibrariesproduced bythethreerestriction enzymes(RE)combinationsusedto digest Chrysanthemum genomic DNA
 |
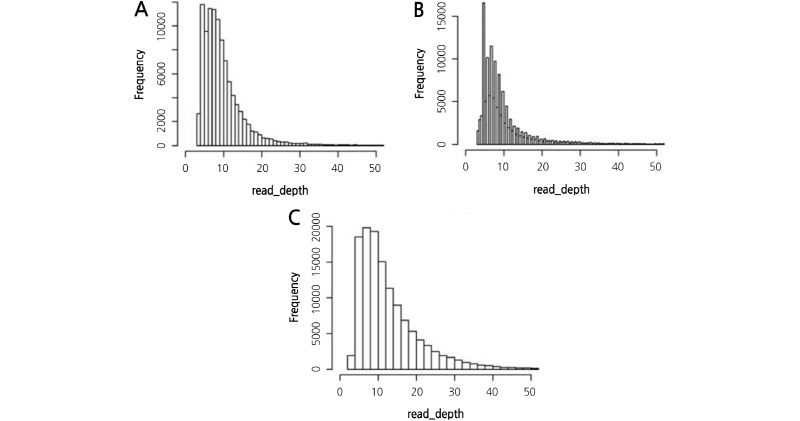
The distribution of mapped read depth was checked to verify if certain repeat elements of the Chrysanthemum genome were overrepresented in the three GBS libraries (Fig. 3). A typical peak indicating overrepresentation was not found and the three libraries showed ordinary patterns of read depth distribution. Low depth reads were observed in the ApeKI/MseI library, and this might have influenced the SNP number collected. If more data were generated by the ApeKI/MseI library, its SNP number could increase dramatically compared to the other libraries.
The GBS performed for Chrysanthemum indicated, that the ApeKI/MseI RE combination was the best for library construction and large data (more than 500 Mbp per sample) production. This combination might be used for genome sequencing coverage and sufficient SNP generation in downstream applications, such as massive population studies, GWAS, linkage mapping, and genomic selection.
The present report of GBS in Chrysanthemum is the first report of using REs and the SNP calling procedure, and will be pivotal for identifying candidate genes in GWAS as soon as a reference genome becomes available for wild Chrysanthemum spp. Such data are will be useful as the increasing development of bioinformatics tools for wild Chrysanthemum germplasms improves.