

Introduction
Materials and Methods
Plant materials
Culture Practices
Phenotype Evaluation and Statistical Analyses
Results
Inheritance Analysis of Three Rind Traits
Foreground Stripe Pattern
Depth of Rind Color
Background Rind Color
Linkage Analysis of Three Rind Traits
Linkage between Foreground Stripe Pattern and Depth of Rind Color Traits
Linkage between Foreground Stripe Pattern and Background Rind Color Traits
Linkage between Background Rind Color and Depth of Rind Color Traits
Discussion
Introduction
Watermelon (Citrullus lanatus (Thumb.) Matsum. & Nakai.) is one of the most important vegetable crops in America and eastern-northern Asian countries. The varieties of watermelon cultivated are different around the world, depending on consumer preferences in each country. Genetic studies on important traits were performed in the late 1930s to the early 1940s (Poole et al., 1941; Poole, 1944; Porter, 1933, 1937; Weetman, 1937), with rind patterns, flesh colors, seed colors and sizes, fruit shapes, and flowering habit being the major target traits. Of these traits, the rind pattern is one of the most important breeding objectives because consumers will typically evaluate the quality of watermelon by checking the condition of the rind (skin).
A number of rind patterns, such as solid dark green, stripes, light green, gray, spotted, yellow belly and inter-mittent, have been investigated in previous studies (Barham, 1956; Gusmini and Wehner, 2006; Poole, 1944; Porter, 1937; Weetman, 1937). Commercial F1 watermelon varieties generally exhibit several rind patterns such as solid dark green (D or G), the presence of stripes (ds or gs), light green (d or g) and yellow (go). Weetman (1937; D > ds > d, dominant to recessive), Poole (1944; G > gs > g), and others (Guner and Wehner, 2003, 2004; Henderson, 1991, 1992; Kumar and Wehner, 2011; Rhodes and Dane, 1999; Rhodes and Zhang, 1995) reported on the allelic relationships of the traits for rind patterns (except for go). Solid dark green (D or G) was found to be completely dominant over striped light green (ds or gs) and incompletely dominant over another light green, gray or yellowish green (Wehner, 2008).
Despite many previous reports on rind patterns, no strong evidence for allelic relationships between stripes (ds or gs) and other rind traits, including solid dark green, light green and yellow, has been described to date. Additionally, Weetman (1937) proposed that the foreground stripe pattern and the background rind color are controlled by two loci. In this study, we analyzed the allelic relationships of foreground stripe patterns (presence or absence of stripes), rind back-ground colors (green or yellow), and rind color contrast (deep color or standard color) via the linkage analysis of four F2 populations derived from cross combinations of four inbred breeding lines. A three-locus model for rind patterns is proposed. The results of this inheritance study should provide valuable information for the breeding of commercial F1 varieties.
Materials and Methods
Plant Materials
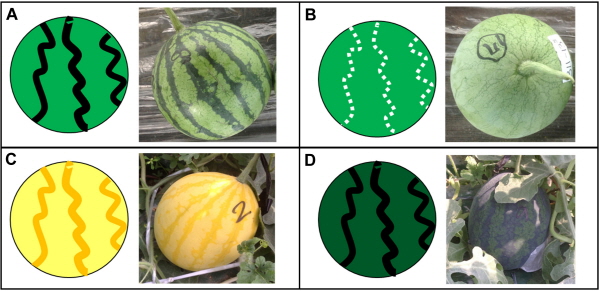
Four watermelon inbred lines (Citrullus lanatus (Thumb.) Matsum. & Nakai.), 01, 09, 109 and 905, were chosen for the inheritance analysis of rind colors and stripe patterns. The rind phenotypes of the 01, 09, 109 and 905 lines are standard green with stripes, standard green without stripes, standard yellow with stripes, and deep green with stripes, respectively (Fig. 1 and Table 1). Cross-pollination was performed between the 09 and 01 lines (cross-combination ID: ‘0901’), the 905 and 09 lines (ID: ‘90509’), the 109 and 09 lines (ID: ‘10909’), and the 109 and 905 lines (ID: ‘109905’), and F2 seeds were produced by self-pollination of the F1 plants from each cross. A total of 71 individuals of the ‘0901’ F2 population were used for the inheritance analysis of foreground stripe pattern (presence or absence). A total of 64 individuals of the ‘90509’ F2 population were used for the inheritance analysis and linkage analysis of foreground stripe pattern and depth of rind color (deep color or standard color). A total of 75 individuals of the ‘10909’ F2 population were used for the inheritance analysis and linkage analysis of background rind color (yellow or green) and foreground stripe pattern. Finally, a total of 63 individuals of the ‘109905’ F2 population were used for the inheritance and linkage analysis of background rind color and depth of background color.
Culture Practices
Seeds of watermelon (scion) and the commercial Lagenaria hybrid ‘Bullojangsaeng’ (root stock; Syngenta, Basel, Switzerland) were sown in 50-cell polyethylene plug trays filled with commercial soil for horticultural crops (Dongbu Farm Hannong, Inc., Seoul, Republic of Korea) in the mulched bench of a plastic house at NH seeds, Inc. (Anseong, Korea). The one cotyledon grafting technique was performed, and the grafted seedlings were transferred to a plastic tunnel with 100% humidity for healing (Hassell and Memmott, 2008). After three weeks, the watermelon plants were transplanted into beds covered by green polyethylene film in a plastic house. A drip irrigation system was used for water management.
Phenotype Evaluation and Statistical Analyses
The fruits of the parental inbred lines, F1, and F2 plants were harvested 45 days after fruit set. The background rind colors, foreground stripe patterns, depth of rind colors, and stripe colors of individual fruits were evaluated. A Chi-square test was performed for the inheritance analysis, and the number of recombinants was calculated for linkage analysis.
Results
Inheritance Analysis of Three Rind Traits
The four F2 populations of ‘0109’, ‘90509’, ‘10909’ and ‘109905’ were used for the inheritance analysis of the three rind traits: foreground stripe pattern (presence or absence), background rind color (yellow or green) and depth of rind color (deep color or standard color).
Foreground Stripe Pattern
The F2 populations of ‘0109’, ‘90509’, and ‘10909’ were constructed for the inheritance analysis of the foreground stripe pattern. All the fruits evaluated from ten individual plants of each F1 generation of ‘0109’, ‘90509’ and ‘10909’ showed stripes on the rind surface. The ratio of the presence of stripes:absence of stripes for each F2 population was 55:16 (p = 0.63), 47:17 (p = 0.77) and 60:15 (p = 0.32), respectively, which fit the 3:1 Mendelian model (Supplementary Figs. 1-3 and Tables 2-4). Thus, the foreground stripe pattern is controlled by a single locus, and the presence of stripes is dominant over the absence of stripes.
Depth of Rind Color
The F2 populations of ‘90509’ and ‘109905’ were used for the inheritance analysis of the depth of rind color. The rind color depth of the fruits from ten individual plants tested for each F1 generation of ‘90509’ and ‘109905’ was a deep color, and the background rind colors were green for ‘90509’ and yellow for ‘109905’. The ratio of deep color:standard color for each F2 population of ‘90509’ and ‘109905’ was 48:16 (p = 0.00) and 51:12 (p = 0.2753), respectively, which fit the 3:1 Mendelian model (Supple-mentary Figs. 2 and 3 and Tables 3 and 5). Thus, the depth of rind color is controlled by a single locus, and a deep color is dominant over the standard color.
Background Rind Color
The F2 populations of ‘10909’ and ‘109905’ were con-structed for the inheritance analysis of background rind color. The background rind color of the fruits from ten individual plants tested for each F1 generation of ‘10909’ and ‘109905’ was yellow. The ratio of background rind color of the F2 population of ‘10909’ was 55 (yellow):20 (green), which fits the 3:1 Mendelian model (p = 0.74). However, the ratio of the F2 population of ‘109905’ was 55 (yellow):8 (green), which deviated significantly from a 3:1 ratio (p ≤ 0.01; Supplementary Figs. 3 and 4 and Tables 4 and 5). It is likely that the deviation from a 3:1 Mendelian segregation ratio for the F2 population of ‘109905’ was due to the small population size, and the background rind color might be controlled by a single locus. However, the number of individuals showing yellow and green color from both ‘10909’ and ‘109905’ and were 115:23, then, satisfying single-gene model (x2 = 1.04; p = 0.3078).
Linkage Analysis of Three Rind Traits
We performed a linkage analysis using the three F2 populations of ‘90509’, ‘10909’ and ‘109905’ to elucidate linkage relationships among the three rind traits.
Linkage between Foreground Stripe Pattern and Depth of Rind Color Traits
The F2 population of ‘90509’ was used for the analysis of genetic linkage between foreground stripe pattern and the depth of rind color. The rind phenotypes of two parental lines, 905 and 09, are deep green with black stripes and standard green without stripes, respectively (Fig. 1). The two recombinant types, deep green without stripes and standard green with stripes, were found in the F2 population of ‘90509’. The segregation ratio of the foreground stripe pattern and depth of rind color traits of the ‘90509’ F2 population was 37 (deep green with stripes) : 11 (deep green without stripes) : 10 (standard green with stripes) : 6 (standard green without stripes), which fits the 9:3:3:1 Mendelian ratio (p = 0.70; Supplementary Fig. 2 and Table 6). Thus, the two loci that control the foreground stripe pattern and the locus that controls the depth of rind color are not linked to each other.
Linkage between Foreground Stripe Pattern and Background Rind Color Traits
The F2 population of ‘10909’ was used for the analysis of genetic linkage between foreground stripe pattern and background rind color. The two parental lines 109 and 09 exhibit the different rind phenotypes of standard yellow with stripes and standard green without stripes, respectively (Fig. 1). The two recombinant types, standard green with stripes and standard yellow without stripes, were observed in the F2 populations of ‘10909’. The segregation ratio of foreground stripe pattern and background rind color traits of the ‘10909’ F2 population was 43 (yellow with stripes) : 12 (green with stripes) : 17 (yellow without stripes) : 3 (green without stripes), which fits the 9:3:3:1 Mendelian ratio (p = 0.68; Supplementary Fig. 3 and Table 6). Thus, the two loci that control the foreground stripe pattern and the background rind color are not linked to each other.
Linkage between Background Rind Color and Depth of Rind Color Traits
The F2 population of ‘109905’ was used for the analysis of genetic linkage between background rind color and depth of rind color. The rind appearances of the parental lines 109 and 905 are standard yellow with stripes and deep green with stripes, respectively (Fig. 1). The segregation ratio of background rind color and depth of rind color traits of the ‘109905’ F2 population was 45 (deep yellow) : 10 (standard yellow) : 6 (deep green) : 2 (standard green), which fits the 9:3:3:1 Mendelian ratio (p = 0.08; Supple-mentary Fig. 4 and Table 6). Thus, the two loci that control the background rind color and the depth of rind color are not linked to each other.
Discussion
We constructed four F2 populations, ‘0109’, ‘90509’, ‘10909’ and ‘109905’, by crossing four Citrullus breeding lines, 01, 09, 109 and 905, to determine the inheritance of three traits: foreground stripe pattern, background rind color, and depth of rind color (Tables 2-5). Each trait was found to be controlled by a single locus. Only the back-ground rind color of the ‘109905’ F2 population did not satisfy the single-gene model. However, the yellow charac-teristic was introduced from same breeding line, 109, and the segregation ratio of background rind color fit a 3:1 ratio in the ‘10909’ F2 population; the segregation ratio was close to 3:1 even in the ‘109905’ F2 population. Furthermore, when the numbers of individuals from both ‘109905’ and ‘10909’ showing yellow and green colors were examined, the ratio satisfied a single-gene model. Therefore, it is likely that background rind color is controlled by a single gene. The deviation of segregation ratio of the ‘109905’ F2 popula-tion can be explained by the small population size.
We also analyzed genetic linkages among the three traits, background rind color, foreground stripe pattern, and depth of rind color, using three F2 populations, ‘90509’, ‘10909’, and ‘109905’, to determine whether these traits are inherited independently (Table 6). The linkage analysis of two loci that control two traits demonstrated that the two loci are not linked in every population. Therefore, we conclude that the three loci involved in the three traits are not linked.
Weetman (1937) proposed “three alleles in a single-locus model” to explain stripe pattern and dark green color, and these alleles were renamed G (solid dark green), gs(light green with stripes), and g (light green without stripes) by Poole (1944). Weetman also suggested that the rind appearance would be controlled by two loci that determine background rind color (the D locus) and foreground stripe pattern (the S locus). However, genetic evidence did not support this idea (Kumar and Wehner 2011; Weetman 1937). The linkage analysis using the F2 population of ‘10909’ clearly demonstrated that background rind color and foreground stripe pattern are not linked (Table 6). Therefore, our results supported a two-locus model instead of “three alleles in a single-locus model”.
The nomenclature system of G/g might be designed based on “two alleles (deep color and light color) in a single-locus model” of green rind. Both depth of rind color and back-ground rind color would be involved in a single nomenclature system. However, a deep color was observed not only in green fruits but also in yellow fruits in this study. Additionally, the two loci that control background rind color and depth of rind color were found not to be linked to each other in the F2 population of ‘109905’ (Table 6). Therefore, a new nomenclature system representing the depth of rind color trait is required, and we suggest a D (deep color) > d (standard color) nomenclature system modified from the nomenclature system D (deep green) > g (light green) by Weetman (1937).
Previous studies have reported that deep color is dominant to light color (Porter, 1937; Weetman, 1937; Wehner, 2008), and the inheritance analysis results for the ‘90509’ and ‘109905’ F2 populations support that conclusion. Recently, a two-locus model for the deep color trait was reported (Kumar and Wehner, 2011). However, this model did not agree with our results because the segregation ratio of deep color and standard color satisfied a single-gene model in the F2 populations of ‘90509’ and ‘109905’. The discrepancy between the two studies might be because the rind color depth of the “Angeleno” and “California Klondike” varieties used by Kumar and Wehner (2011) is deeper than our breeding line 905. Additionally, the foreground stripes of 905 are distinguishable from the background rind color, whereas the rind color of the “Angeleno” and “California Klondike” cultivars is too solid to distinguish foreground stripes (Kumar and Wehner, 2011). Moreover, differences in inheritance patterns might have occurred because of the different origins and genetic constitutions of the plants. Similar to other reports, we also observed that a deep color is not inherited in a completely dominant manner. Many fruits in the ‘90509’ and ‘109905’ F2 populations showed a medium depth of color, for which the genotypes were expected to be heterozygous (Dd) (Supplementary Fig. 5). Therefore, the inheritance analyses were not completely objective because of the difficulties in evaluating ambiguous phenotypes between a solid deep color and medium color. Additionally, environmental factors could easily affect the degree of rind color depth.
A recessive gene, Golden yellow color of older leaves and mature fruit (go), which confers a yellow rind color to ‘Royal golden’, was reported by Barham (1956). However, in our study, the inheritance analysis using the inbred line 109 showed fruit and leaf coloring patterns similar to ‘Royal golden’, demonstrating that the yellow rind color of 109 is dominant to green color. This result suggests that the genes or alleles that control the yellow rind color of ‘Royal golden’ and 109 are different. Therefore, we designated this novel locus or allele for dominant yellow rind color as Dominant golden color (Dgo).
Stripe color was also of interest in this study. In our breeding lines, green fruits had black stripes and yellow fruits had yellow stripes. The two F2 populations, ‘10909’ and ‘109905’, were constructed by crossing yellow and green fruit lines, and no recombinants (green fruits with yellow stripes or yellow fruits with black stripes) were found in those populations, indicating that rind background color and stripe color might be controlled by a single locus or two tightly linked loci. However, a larger number of F2 plants must be evaluated before drawing a conclusion on the allelism of background rind color and stripe color.
Here, we propose that the genetic mode of rind phenotypes in Citrullus is explained by a three-locus model. The rind phenotype is determined by three loci, Dgo, D and S, which control background rind color, depth of rind color, and foreground stripe pattern, respectively. For example, the genotypes of inbred lines 01 (standard green with stripes), 09 (standard green without stripes), 109 (standard yellow with stripes), and 905 (deep green with stripes) are designated as dgo/d/S, dgo/d/s, Dgo/d/S and dgo/D/S, respectively. The previously reported single-locus model for rind phenotype (G > gs > g; Poole 1944; Weetman 1937) might be reinterpreted based on our three-locus model; the G, gs and g genotypes of the single-locus model would be explained as dgo/D/S or s, dgo/d/S, and dgo/d/s genotypes in the three-locus model, respectively. However, because stripes are not visible in a solid deep green background color, it is uncertain whether the G genotype (solid deep green) has an S or s allele; therefore, a reinterpretation of the genotypes of G, gs, and g as dgo/D, dgo/d and dgo/d, respectively, should be accepted. The G genotype contains a D allele, and the gs and g genotypes contain a d allele. Therefore, the G genotype is dominant over the gs or g genotype because the D allele is dominant over the d allele. The gs genotype carries the dgo/d/S alleles, and the g genotype carries the dgo/d/s alleles. Both genotypes harbor the dgo and d alleles; however, S is dominant over the s allele. Therefore, the gs genotype is dominant over the g genotype.
In conclusion, we propose in a three-locus model that rind phenotype is determined by a combination of three independent loci that control background color (Dgo/dgo), foreground stripe pattern (S/s), and depth of rind color (D/d). However, the genetic distances and the physical chromosomal locations of the three loci remain to be determined. The F2 populations used in this study will be valuable research materials for the genetic mapping and molecular tagging of the loci that confer rind phenotypes to watermelon. Additionally, genetic analyses of other rind- related phenotypes such as white rind color and penciled (P) and intermittent (int) stripe patterns need to be conducted (Wehner 2008).
