

Introduction
Materials and Methods
Physical Property of Substrate Components
Plant Materials
Measurement
Experiment Design and Statistical Analysis
Results
Physical Property of Biochar
Variation of Substrate pH and EC in Tomato and Lettuce
Growth of Chrysanthemum in Sunshine #1 Mix Amended with Biochar
Growth of Tomato in Sunshine #1 Mix Amended with Biochar
Growth of Lettuce in Sunshine #1 Mix Amended with Biochar
Growth of Basil in Sunshine #1 Mix Amended with Biochar
Discussion
Introduction
Biochar is the charred organic matter after pyrolysis (heating materials in the absence of oxygen) of biomass or manure (Altland and Locke, 2012). The biomass is heated to between 300°C and 1,000°C (Verheijen et al., 2010). Heating time did not have significant effect on properties of biochar, but the
physicochemical properties and stability of biochar were greatly affected by pyrolysis temperature (Zhang et al., 2015). The selected feedstock for biochar production could be made from any biomass materials in large quantity, including but not limited to, wood and wood materials, bark, grasses, and agricultural and industrial by-products with biomass. The surface area, micropore surface areas, bulk density, and electrical conductivity values varied greatly in different types of biochar (Vaughn et al., 2013), which may be due to the differences in heating time, temperature, and pressure. Compared to peat moss, biochar could be made from by-products and renewable materials that are fast enough to regenerate. There are some beneficial effects by using biochar. Returning biochar to soil systems is a promising solution to reduce atmospheric carbon (Glaser et al., 2002). Incorporating biochar into soil media has been studied to improve crop growth in highly weathered or sandy soils (Lehmann et al., 2003; Novak et al., 2009), increase soil pH (Novak et al., 2009), produce more desirable bulk density for the finished material (Vaughn et al., 2013), increase mycorrhizal associations (Warnock et al., 2007), and improve nutrient retention (Clough and Condron, 2010).
Many studies have examined both positive and negative results of the addition of biochar from a wide variety of feedstocks to mineral soil system. However, there are only a few studies on the utilization of biochar in soilless substrates in greenhouse and nursery production. Biochar has been found to improve plant growth and biochar-induced systemic resistance to disease (Elad et al., 2010; Graber et al., 2010). With the capacity to hold nitrate and slow nutrient release, biochar additions up to 10% (vol.) in peat moss and perlite (85:15) substrate decreased leaching of nitrate and phosphate (P), which also reduced the P and potassium (K) application (Altland and Locke, 2012). Kadota and Niimi (2004) found that 10% or 30% additions of biochar to a 2:1:1:1:1 peat moss: soil: vermiculite: perlite: sand (v/v) substrate had little to no effect on growth parameters of several bedding plant species. Dumroese et al. (2011) investigated the physical and chemical properties of biochar pellets (biochar: wood flour: polyactic acid: starch = 43:43:7:7, by weight) and the possible combination with sphagnum peat moss for production of forest seedlings. They reported that 25% biochar pellets increased substrate pH and improved hydraulic conductivity and water retention at lower matric potentials (Dumroese et al., 2011). Addition of conifer wood biochar has been reported to significantly affect chemical and physical characteristics of peat based substrate, resulting in increased pH, decreased EC, increased bulk density and total pore space (Fascella et al., 2015). They also reported that Euphorbia × lomi had higher dry weight and higher number of marketable potted plants with increasing biochar content in peat based substrate (Fascella et al., 2015). In a study by Vaughn et al. (2013), straw and wood biochar addition to peat significantly increased plant heights in potted tomatoes and marigolds, but had only little or no effect on dry weights. Biochar has the potential to develop “designer biochar” with desired attributes to achieve the standard range of potting substrates, such as 50%-85% total porosity values, 45%-65% container capacity values (the maximum amount of water the soil media can hold in that container), 10%-30% air space values, and 0.19-0.70 g·cm-3 bulk density (Yeager et al., 2007).
Peat moss is the major component of container substrate for greenhouse production over the last 30 years (Wright et al., 2008), which has desirable physical characteristics of slow degradation rate, high water holding capacity, low bulk density, and high nutrient exchange capacity (Nelson, 2011). The majority of peat is harvested in bogs in Canada and shipped to the US, and high fuel cost has increased shipping and handling cost of peat (Robertson, 1993). Peat bogs are important carbon stocks, which provide environmental services such as regulation of local water quality and flood protection (Alexander et al., 2008). Public concern around the world from ecological consequences of wetland destruction during peat harvest have increased (Jayasiinghe et al., 2010). There are also growing restrictions on peat extraction and increasing legislation forcing reconstitution of peatland (Rivière and Caron, 2001). Therefore, there is a need to search for peat substitutes, as there is no material known to be suitable to substitute for peat entirely (Michel, 2010). Renewable alternatives to peat include various composts (Jayasinghe et al., 2010), coir [coconut (Cocos nucifera L.) husk fiber] (Noguera et al., 2003), kenaf (Hibiscus cannabinum L.) stems (Webber et al., 1999), poultry feathers (Evans, 2004), and rich (Oryza sativa L.) hulls (Evans and Gachukia, 2007).
The objective of this research was to investigate the suitability of biochar to substantially (>50% by volume) replace peat-based substrate for container production of four horticultural crops.
Materials and Methods
Physical Property of Substrate Components
Biochar was obtained from fast pyrolysis described in Gu et al. (2013). Commercially available substrate (Sunshine #1 Mix, Sun Gro Horticulture Distribution, Inc., Bellevue, WA; peat moss, Lambert Peat Moss Inc., RiviereOuelle, QC, Canada) was used in this experiment, and it is a peat (Canadian Sphagnum peat moss)-based substrate amended with coarse perlite, starter nutrient charge (with gypsum), and dolomitic limestone. Potting mixes were blended by incorporating biochar at 0%, 20%, 40%, 60%, 80% and 100% (vol.) in Sunshine #1 Mix (PM). Physical properties of the potting mixes, including total porosity (TP), container capacity (CC), air space (AS), and bulk density (BD) were determined on April 25, 2010 on three replicate samples, using the North Carolina State University Porometer Method (Fonteno et al., 1995).
Plant Materials
Four plant species were used in this experiment, basil (Ocimum basilicum ‘Genovese’), chrysanthemum (Chrysanthemum nankingense), tomato (Solanum lycopersicum ‘Legend’) and lettuce (Lactuca sativa ‘Black Simpson’). Basil seeds were sown in standard 7*14 square plug trays (tray size 28.0 cm x 54.0 cm, cell depth 5.1 cm, cell top 3.4 cm, cell volume 35 cm3; Hummert International, St. Joseph, MO) on August 19, 2010 and transplanted into 15-cm azalea pot (volume 1,000 cm3; Hummert International, St. Joseph, MO) on September 16, 2010. Lettuce and tomato seeds were sown into 7*14 plugs trays on September 20, 2010, and transplanted into 15-cm azalea pots on October 13, 2010. A second crop of lettuce was sown on November 11, 2010 and transplanted into the same 15-azalea pots on December 2, 2010. Chrysanthemum cuttings were taken from stock plants and rooted in 7*14 plug trays on August 11, 2010, and transplanted into 15-cm azalea pots on September 20, 2010. Four grams of Osmocote 15-9-2 3-4 months (15N-3P-1K; Scotts Co., Marysville, OH) was applied to each pot on October 22, 2010. All plants were well watered with tap water as needed with 10% to 20% leaching fraction and on the day before harvesting. All plants were grown on metal benches in Dorman Hall glasshouse on the Mississippi State University campus. The average greenhouse air temperature was approximately 30/20°C (day/ night).
Measurement
Chrysanthemum. Growth index [GI = (Height+Width1+Width2)/3] of chrysanthemum was measured following Warsaw et al. (2009) at 30 days after transplanting (DAP) (GI1), 44 DAP (GI2), 58 DAP (GI3), and 72 DAP (GI4) in each treatment. The number of flowers and the percentage of flowering were recorded before harvesting at 73 DAP. Fresh weight (FW) and dry weight (DW) of shoots were measured after harvesting at 74 DAP. Plant shoots were harvested by cutting at the substrate surface to measure fresh weight. All shoots were dried in an oven at 70°C for 3 d, before their DWs were measured.
Tomato. For tomato, GI was measured at 5 DAP (GI1), 19 DAP (GI2), 33 DAP (GI3) and 44 DAP (GI4). The substrate pH and EC were measured by pour through method at 16 DAP, 30 DAP and 44 DAP (Wright, 1986). The leachate was collected and analyzed for EC and pH using EC and pH meter (Hanna Instruments, Woonsocket, RI). Shoot FW and DW were measured after harvesting at 44 DAP.
Lettuce. For lettuce, GI were measure at 5 DAP (GI1), 19 DAP (GI2) and 33 DAP (GI3). The substrate pH and EC were measured by pour through method at 17 DAP and 30 DAP (Wright, 1986). Shoot FW of lettuce was measured after harvesting at 34 DAP. For the second lettuce crop, only shoot FW was recorded on January 2, 2011, a month after transplanting.
Basil. Basil was pruned to three nodes on September 30, 2010. Basil were harvested as needed by cutting to one node from October 20, 2010 to November 30, 2010. Shoot FW and DW in each treatment were measured, and the total yield was calculated at the end of the experiment by harvesting all aboveground growth. Root coverage of chrysanthemum, tomato and basil plants was visually assessed on a 1-10 scale (1-no root tissue visible; 10-little substrate visible) by pulling plants from the containers before plants were harvested for FW measurements.
Experiment Design and Statistical Analysis
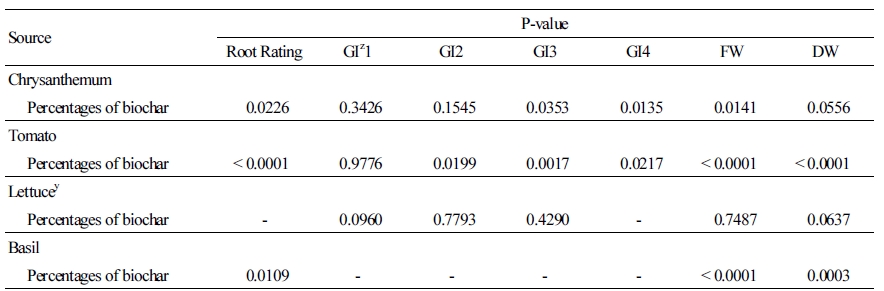
Each of the four species (chrysanthemum, tomato, lettuce, and basil) in this experiment was treated as a separate study. For each species, the study utilized a randomized complete block design with six blocks. There were six treatments in each block, based on the percentage of biochar mixed in Sunshine #1 Mix (0%, 20%, 40%, 60%, 80% and 100% biochar), and one plant per block was assigned to one of the six treatments. Treatment means were compared using analysis of variance (ANOVA). If means were significantly different, Student-Newman-Keuls multiple comparison test at p < 0.05 was used for separation. All statistical analyses were performed using SAS to determine treatment differences at the 0.05 level of significance.
Results
Physical Property of Biochar
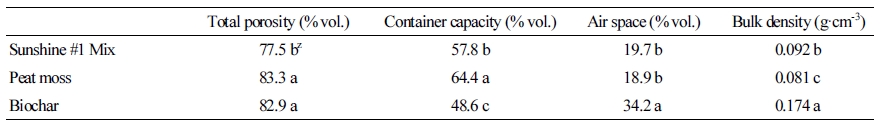
Total porosity of biochar used in this experiment was 82.9% (vol.), and it was similar to peat moss (PM) (83.3% vol.), but higher than Sunshine # 1Mix (77.5% vol.) (Table 1). The container capacity of biochar was 48.6% (vol.), which was lower than Sunshine # 1Mix (57.8% vol.) and PM (64.4% vol.) (Table 1). Biochar had the highest air space (34.2% vol.) and bulk density (0.174 g·m-3) compared to the other two substrates tested (Table 1). The bulk density of biochar was about twice that of PM and peat moss-based substrate (Sunshine #1 Mix) (Table 1).
Variation of Substrate pH and EC in Tomato and Lettuce
In tomato, the substrate pH increased with increasing biochar incorporation at 16 DAP, which was the highest for plants grown in 100% biochar (7.3) and lowest for plants grown in 80% PM/20% biochar and 100% PM (6.2) (Fig. 1A). At 30 DAP, the substrate pH was also the highest for plants grown in 100% biochar (7.4), followed by 20% PM/80% biochar (7.2) and 40% PM/60% biochar (7.1), while it was the lowest for plants grown in 100% PM (6.7) (Fig. 1A). At 44 DAP, there was no significant difference of substrate pH among all treatments, ranging from 6.8-7.0 (Fig. 1A). At 16 DAP, the leachate EC decreased with decreasing biochar incorporation, and it was the highest for plants grown in 100% PM (2.3 dS·m-1) and lowest for plants grown in 100% biochar (0.4 dS·m-1) (Fig. 1B). At 30 DAP, the leachate EC was the highest for plants grown in 100% PM (1.6 dS·m-1), and there was no significant difference among the other biochar treatments, ranging from 0.2-0.6 dS·m-1 (Fig. 1B). At 44 DAP, the leachate EC was the highest for plants grown in 20% PM/80% biochar (0.3 dS·m-1), and it was around 0.2 dS·m-1 for the other biochar treatments (Fig. 1B).
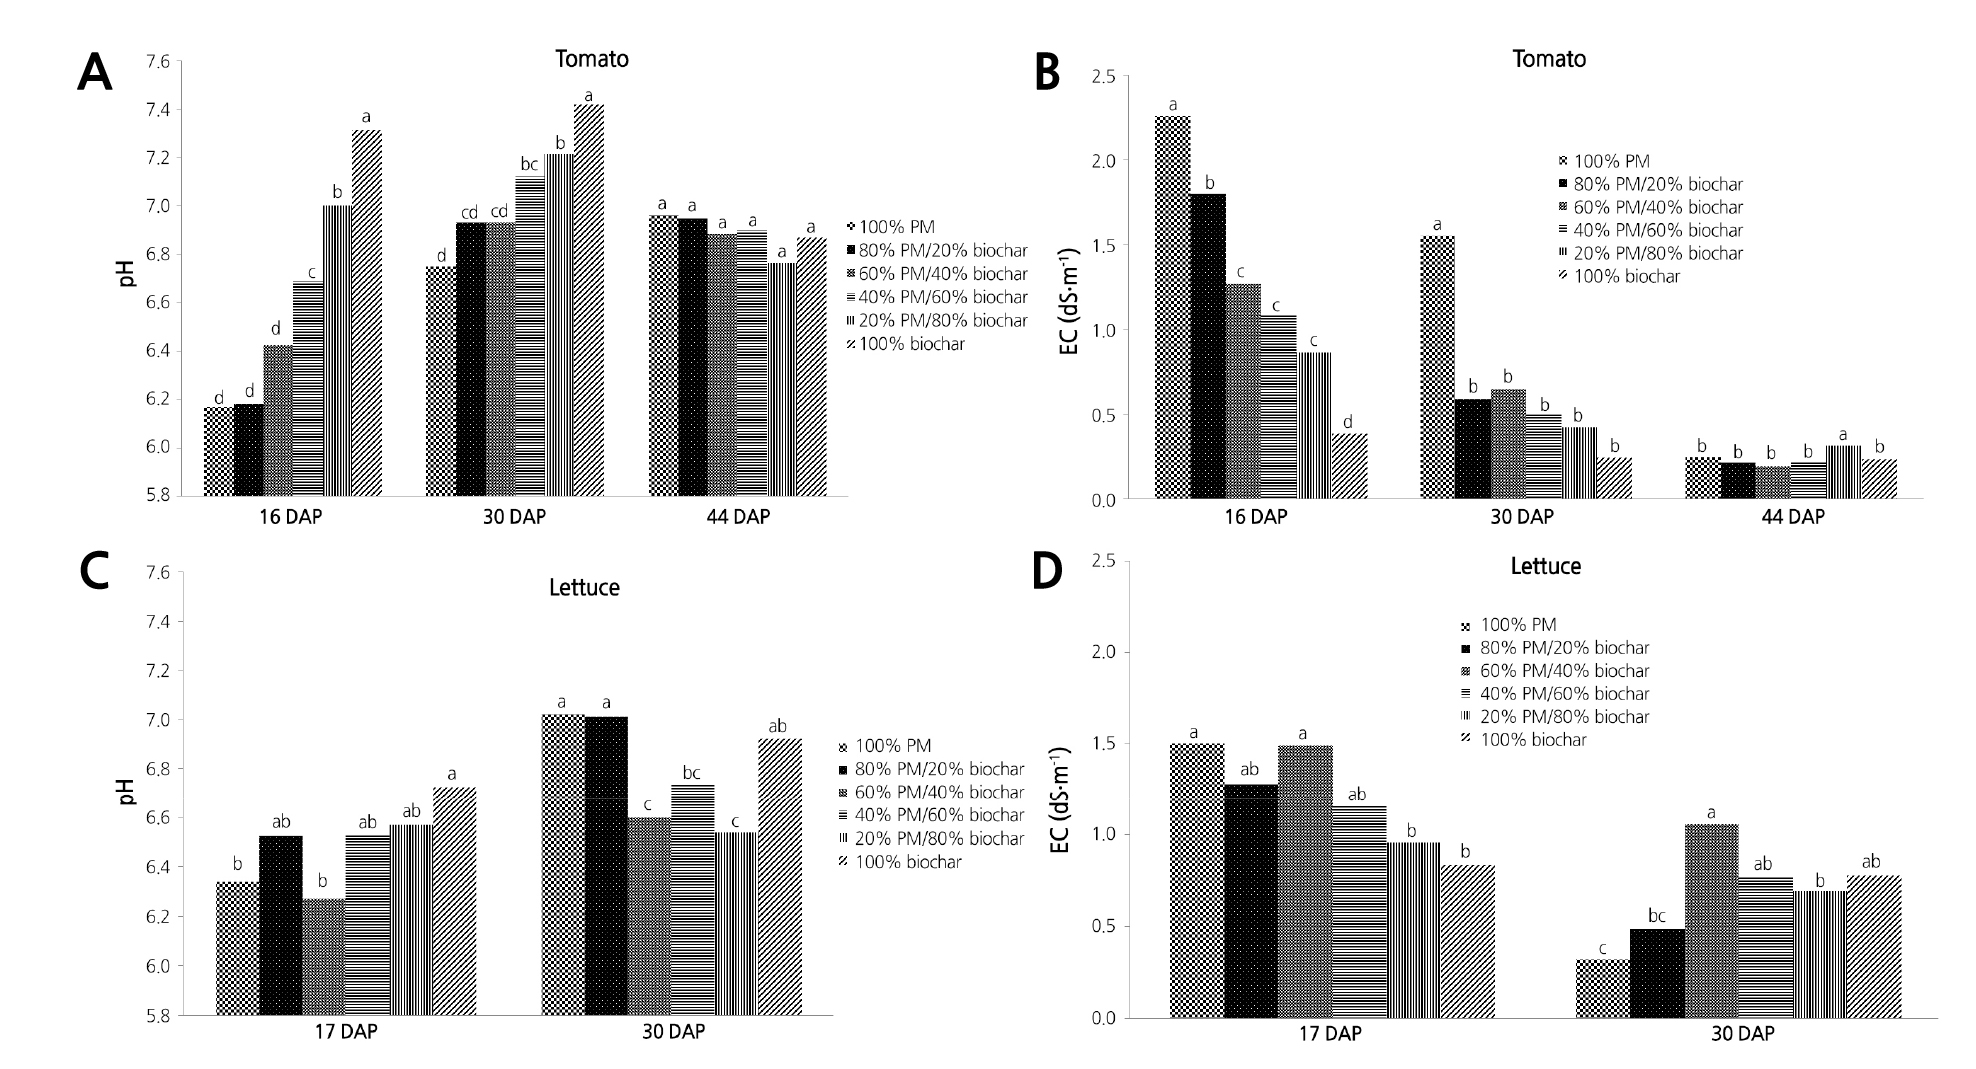
Fig. 1. The variation of substrate pH (A) and leachate electrical conductivity (EC) (B) of tomato at 16, 30, and 44 days after transplanting (DAP), and the variation of average substrate pH (C) and leachate EC (D) of lettuce at 17 and 30 DAP in Sunshine #1Mix [peat-moss (PM) based] substrates amended with six levels of biochar percentage: 100% PM and 0% biochar, 80% PM and 20% biochar, 60% PM and 40% biochar, 40% PM and 60% biochar, 20% PM and 80% biochar, and 100% biochar.
In lettuce, at 17 DAP, the substrate pH was higher for plants grown in 100% biochar (6.7), followed by 20% PM/80% biochar (6.6), 40% PM/60% biochar (6.5), and 80% PM/20% biochar (6.5), while it was lower for plants grown in 100% PM and 60% PM/40% biochar (6.3) (Fig. 2C). At 30 DAP, the substrate pH was higher for plants grown in 100% PM and 80% PM/20% biochar (7.0) and lower for plants grown in 60% PM/40 biochar (6.6) and 20% PM/80% biochar (6.5) (Fig. 1C). At 17 DAP, the leachate EC was higher for plants grown in 100% PM and 60% PM/40% biochar (1.5 dS·m-1) and lower for plants grown in 100% biochar (0.8 dS·m-1) and 20% PM/80% biochar (1.0 dS·m-1) (Fig. 1D). At 30 DAP, the leachate EC was higher for plants grown in 60% PM/40% biochar (1.1 dS·m-1) and lower for plants grown in 100% PM (0.3 dS·m-1) (Fig. 1D).
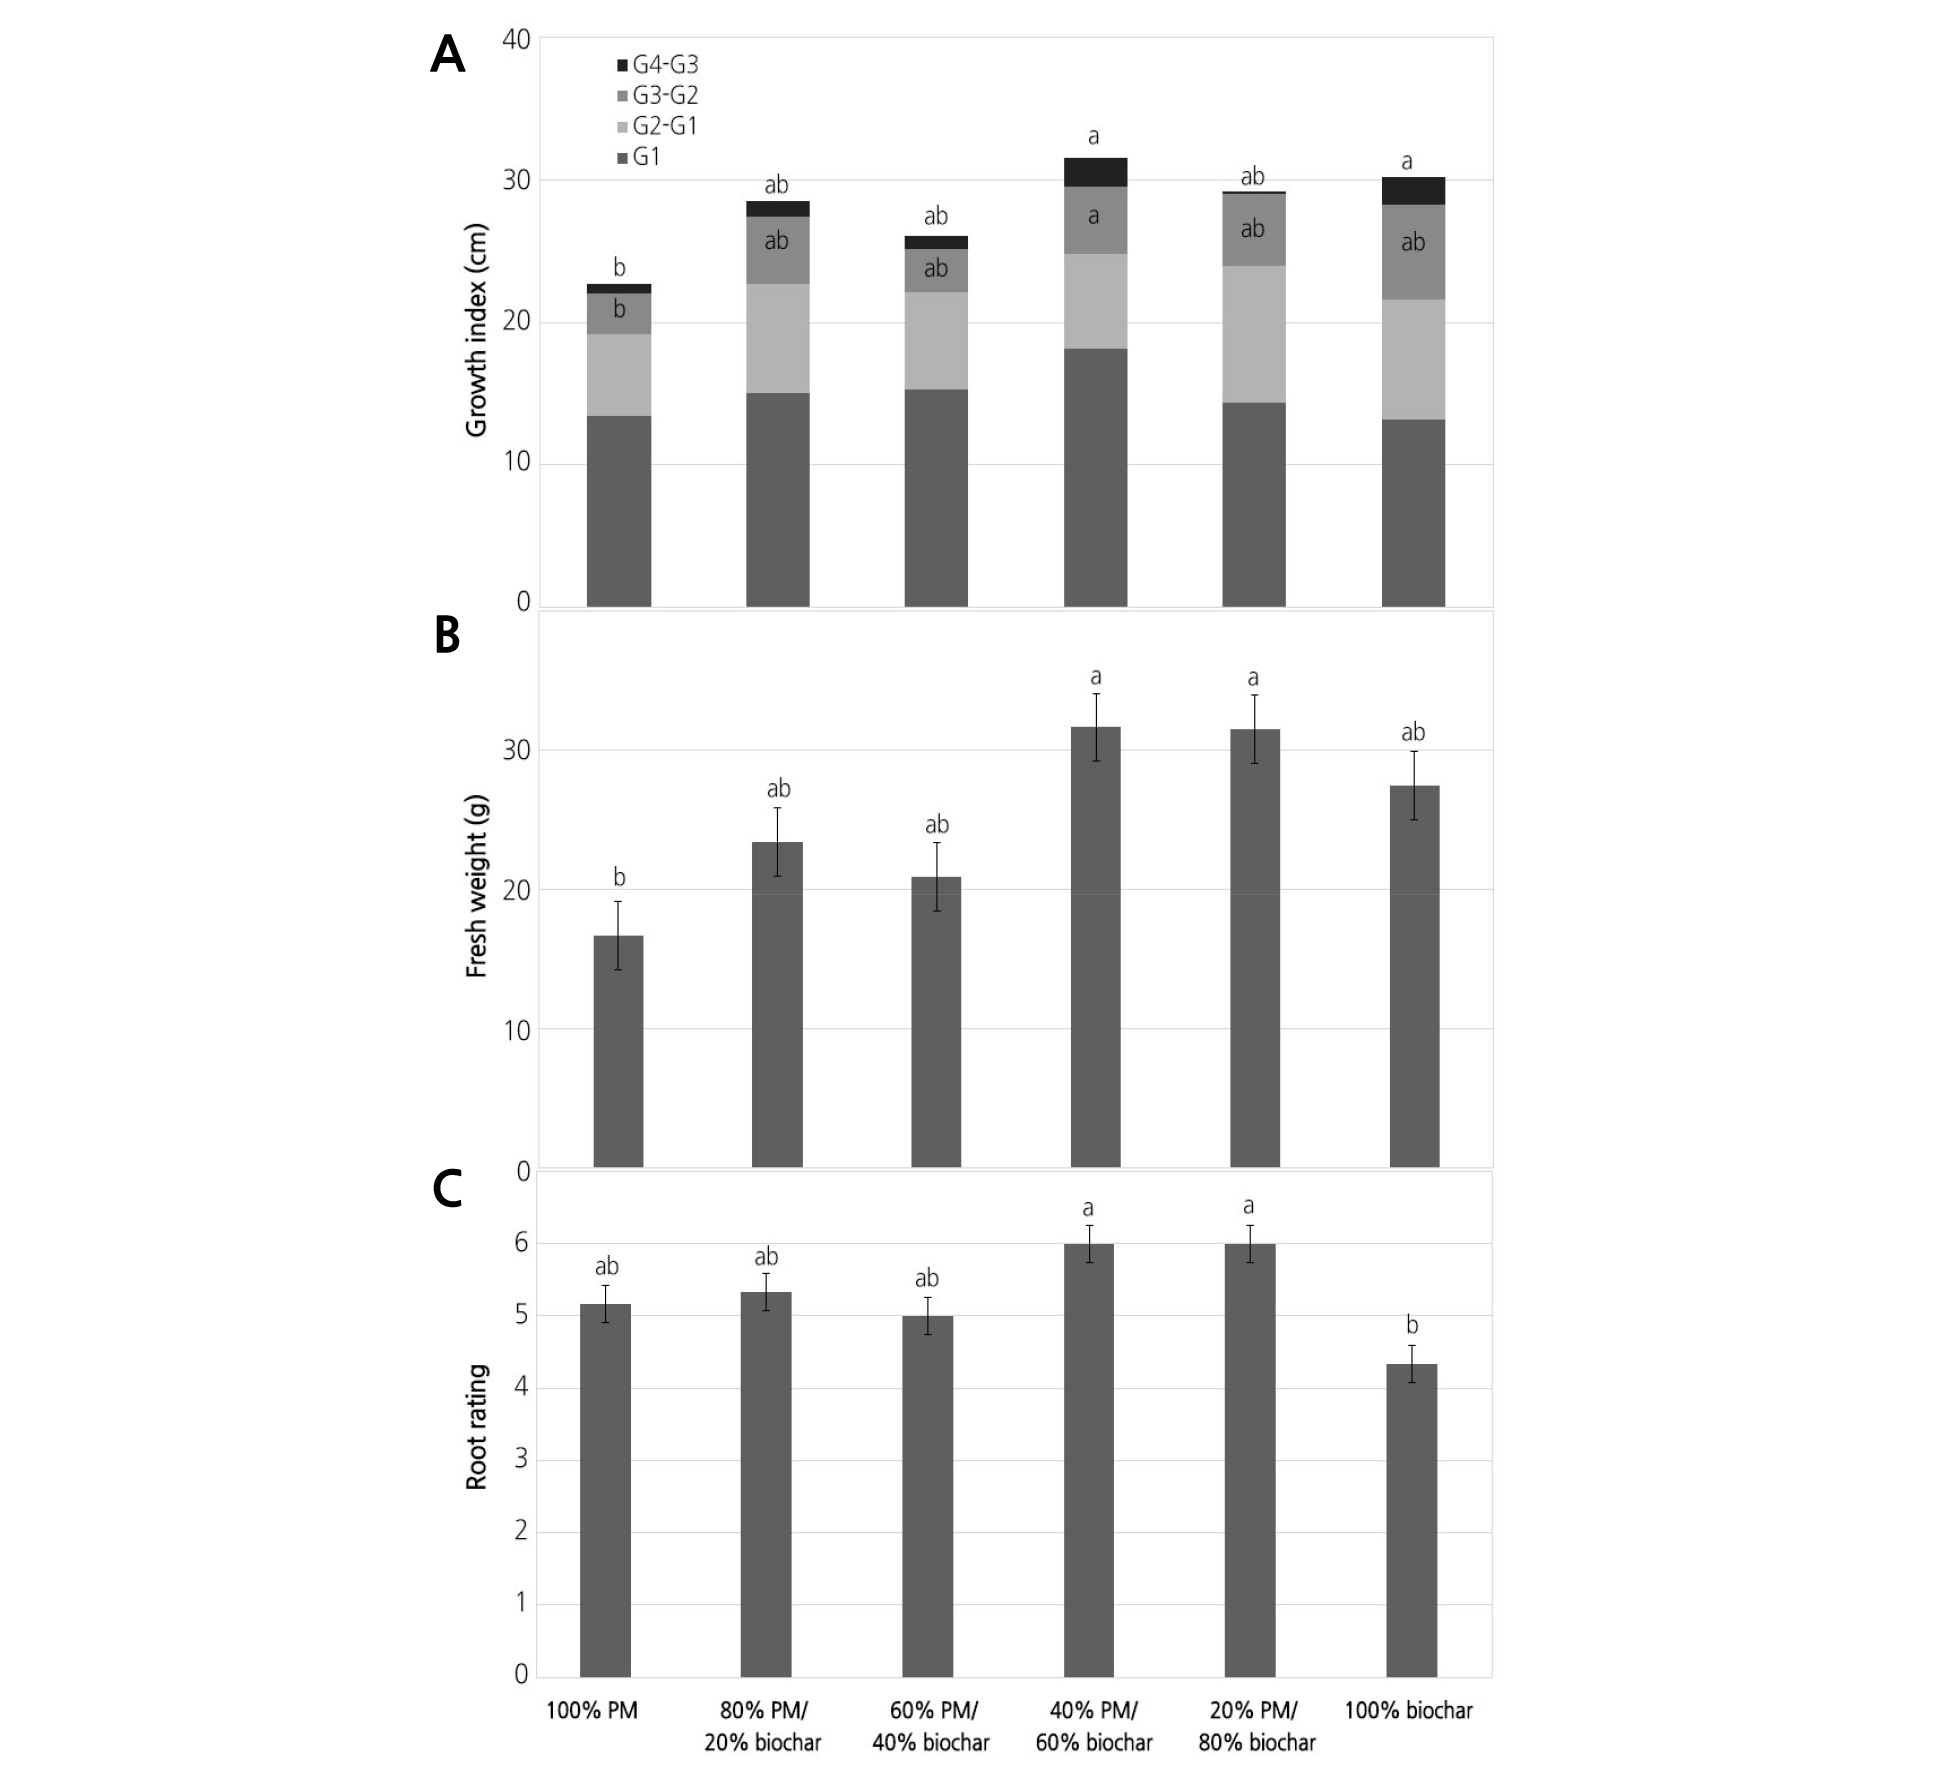
Fig. 2. Growth index (A), fresh weight (FW) (B), and root rating (C) of container-grown chrysanthemum in Sunshine #1Mix [peat-moss (PM) based] substrates amended with six levels of biochar percentage: 100% PM and 0% biochar, 80% PM and 20% biochar, 60% PM and 40% biochar, 40% PM and 60% biochar, 20% PM and 80% biochar, and 100% biochar. Growth index [GI= (Height + Width+ Width)/3] of chrysanthemum in PM was measured at 30 (GI1), 44 (GI2), 58 (GI3) and 72 (GI4) days after transplanting. Fresh weight and root rating were measured at 74 days after transplanting. The letter on the top bar is the treatment differences of GI4, while the letter on the GI3-GI2 is the treatment differences of GI3. GI4 or GI3 indicated by the same letter are not significantly different, respectively, tested by student-newman- keuls (SNK) multiple comparison at p < 0.05.
Growth of Chrysanthemum in Sunshine #1 Mix Amended with Biochar
There was a significant effect of the percentage of biochar on GI3, GI4, FW, and root coverage rating (Table 2). After 58 d of growth, the average of GI3 was the highest for chrysanthemum plants grown in 40% PM/60% biochar, while lowest for plants grown in 100% PM (Fig. 2A). At 72 DAP, plants had the highest average of GI4 in 40% PM/60% biochar and 100% biochar, with the lowest in 100% PM (Fig. 2A). Shoot FW of chrysanthemum plants ranged from 16.7 to 31.6 g, with the highest FW observed in plants grown in 40% PM/60% biochar and 20% PM/80% biochar and the lowest FW observed in plants grown in 100% PM (Fig. 2B). There was no significant difference between shoot DW among different mixes (data not shown). Root rating of chrysanthemum ranged from the lowest of 4.3 for 100% biochar to the highest of 6 observed in 40% PM/60% biochar and 20% PM/80% biochar (Fig. 2C).
Growth of Tomato in Sunshine #1 Mix Amended with Biochar
The effect of the percentage of biochar was significant in all variables except on GI1 (Table 2). Tomato plants grown in PM mixes with no more than 60% biochar had significantly higher GI2, measured at 19 DAP, than those in mixes with 80% or 100% biochar (Fig. 3A). Tomato plants grown in PM mixes with 20%, 40%, 60% and 80% biochar had higher GI3 and GI4 (measured 33 and 44 DAP, respectively) than those in biochar alone (100% biochar).
The lowest shoot FW was observed in tomato plants grown in PM mixes with 80% and 100% biochar, and there was no significant difference among the other PM mixes (Fig. 3B). Tomato plants grown in four PM mixes with no more than 60% biochar had the highest shoot DW among all treatments (Fig. 3C). Shoot DW of tomatoes grown in 100% biochar was the lowest. Shoot DW of tomatoes grown in PM mix with 80% or in 100% biochar had significantly lower shoot DW than those in PM alone (Fig. 3C). Root rating of tomato plants ranged from the lowest of 5 for 100% biochar to the highest of 7.8 for 40% PM/60% biochar (Fig. 3D). There was no significant difference among the PM mixes with 0%, 20%, 40%, and 60% biochar. Root rating of tomato plants grown in PM amended with 80% biochar was significantly lower than the other PM mixes (Fig. 3D).
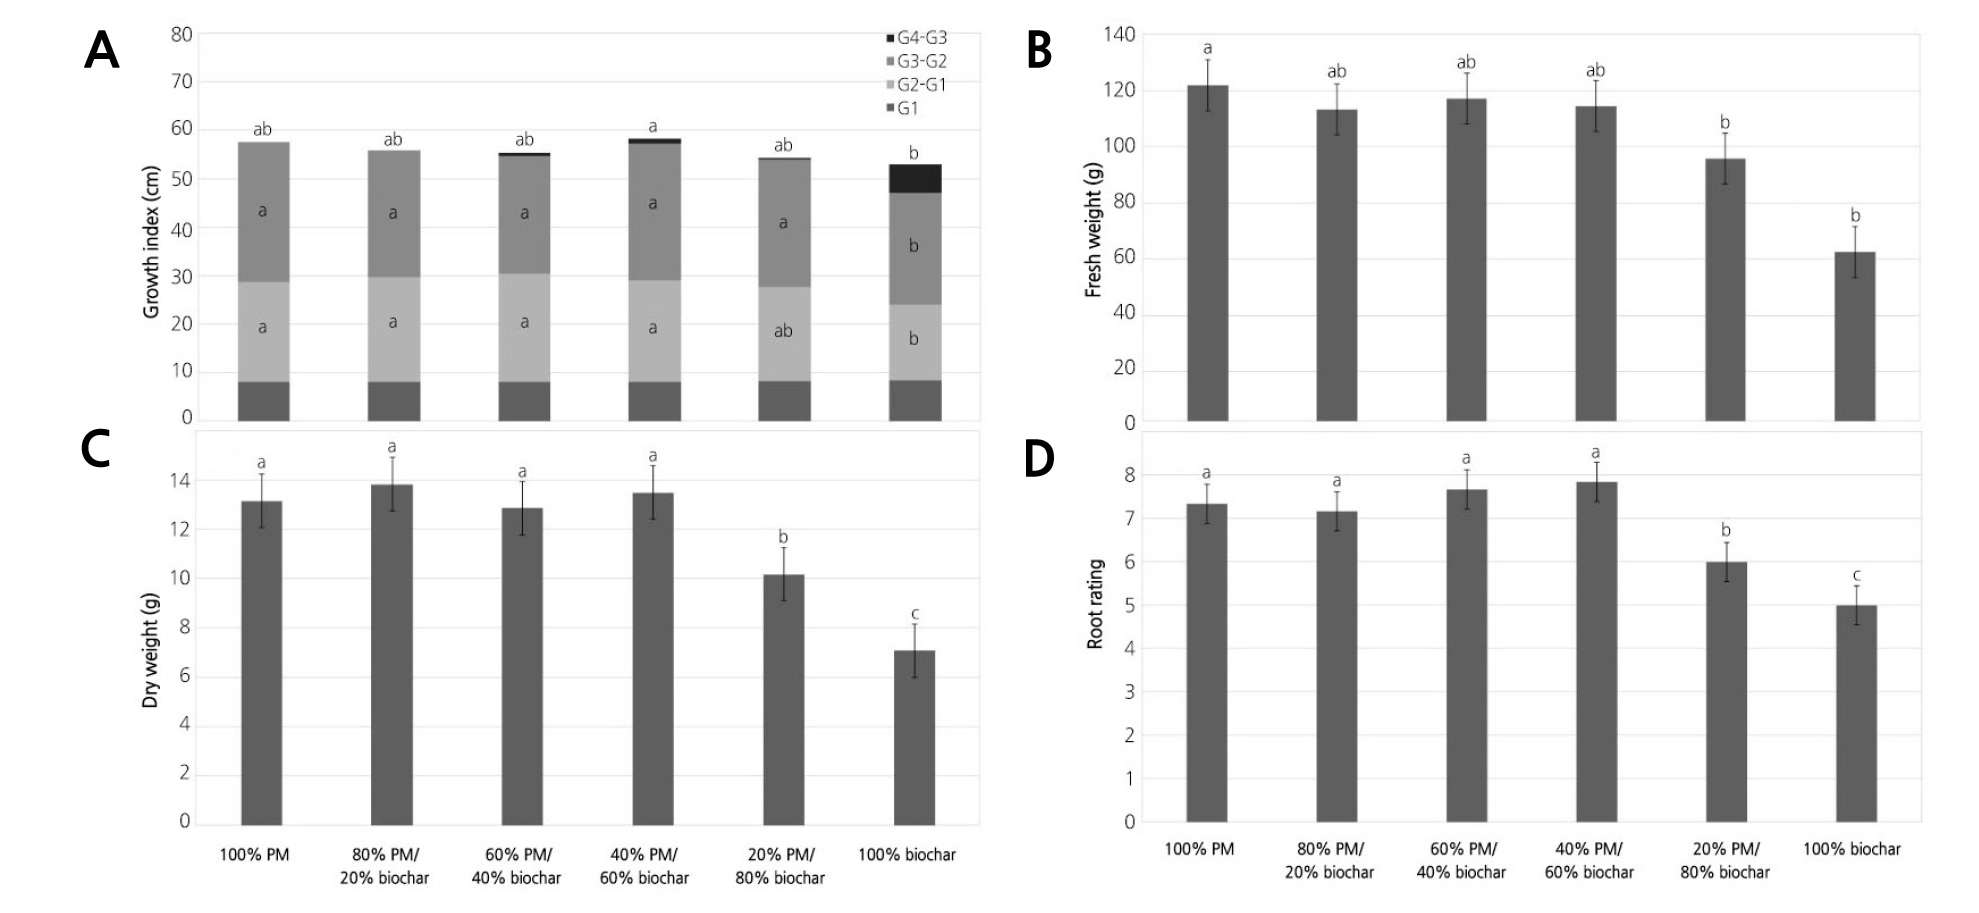
Fig. 3. Growth Index (A), fresh weight (FW) (B), dry weight (DW) (C), and root rating (D) of tomato in Sunshine #1Mix [peat-moss (PM) based] substrates amended with six levels of biochar percentage: 100% PM and 0% biochar, 80% PM and 20% biochar, 60% PM and 40% biochar, 40% PM and 60% biochar, 20% PM and 80% biochar, and 100% biochar. Growth index [GI= (Height + Width+ Width)/3] of tomato in SB was measured at 5 (GI1), 19 (GI2), 33 (GI3) and 44 (GI4) days after transplanting. Fresh and dry weights were measured at 44 days after transplanting. Root rating was measured at 45 days after transplanting. The letter on the top bar is the treatment differences of GI4. The letter on the GI3-GI2 is the treatment differences of GI3. The letter on the G2-G1 is the treatment differences of GI2. Means within each treatment followed by the same letter are not significantly different, tested by student-newman-keuls (SNK) multiple comparison at p = 0.05.
Growth of Lettuce in Sunshine #1 Mix Amended with Biochar
For lettuce, the effect of the percentage of biochar was not significant in GI1, GI2, GI3, and FW for the first crop, and the percentage of biochar had a significant effect on FW for the second crop (Table 2). For the second crop, the FW of lettuce grown in different percentages of biochar ranged from 37.2 to 60.1 g/lettuce, with the lettuce grown in 100% biochar having lower FW than the other PM mixes with biochar (Fig. 4).
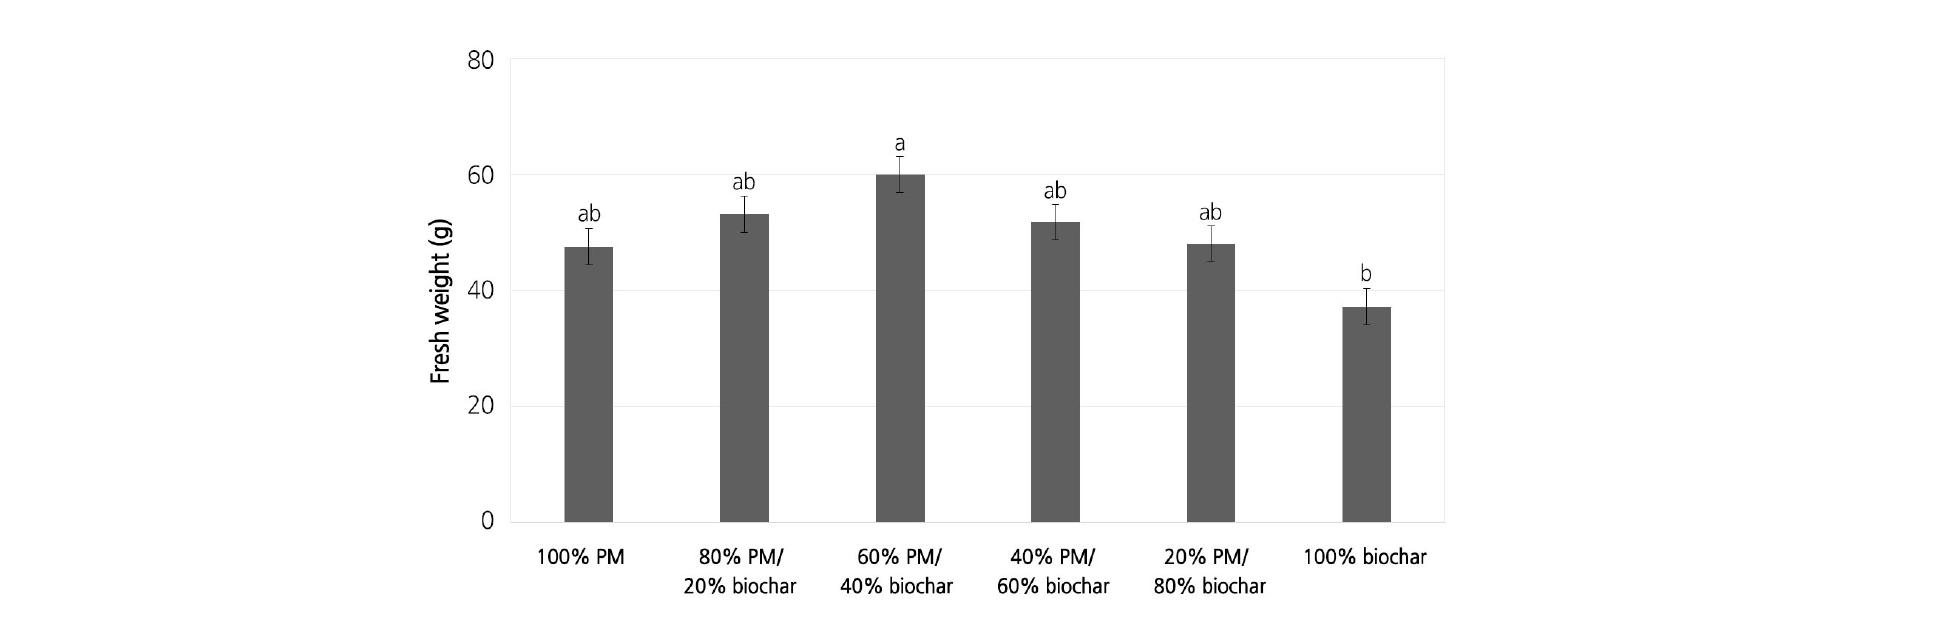
Fig. 4. Fresh weight (FW) of second lettuce crops (sowed after 52 days of the first crop) grown in Sunshine #1Mix [peat-moss (PM) based] substrates amended with six levels of biochar percentage: 100% PM and 0% biochar, 80% PM and 20% biochar, 60% PM and 40% biochar, 40% PM and 60% biochar, 20% PM and 80% biochar, and 100% biochar at 31 days after transplanting. Bars represent standard error. Means within each treatment followed by the same letter are not significantly different, tested by student-newman-keuls (SNK) multiple comparison at p = 0.05.
Growth of Basil in Sunshine #1 Mix Amended with Biochar
The effect of the percentage of biochar was significant in basil FW, DW, and root rating (Table 2). Basil grown in PM mixes with 20% biochar had higher FW (124.6 g) and DW (17.1 g) compared to other PM mixes, and there was no significant difference among the other PM mixes (Fig. 5A and B). Root rating of basil plants grown in PM mixes with 80% biochar was below 7, which was significantly lower than the other PM mixes, and there was no significant difference among the other PM mixes (Fig. 5C).
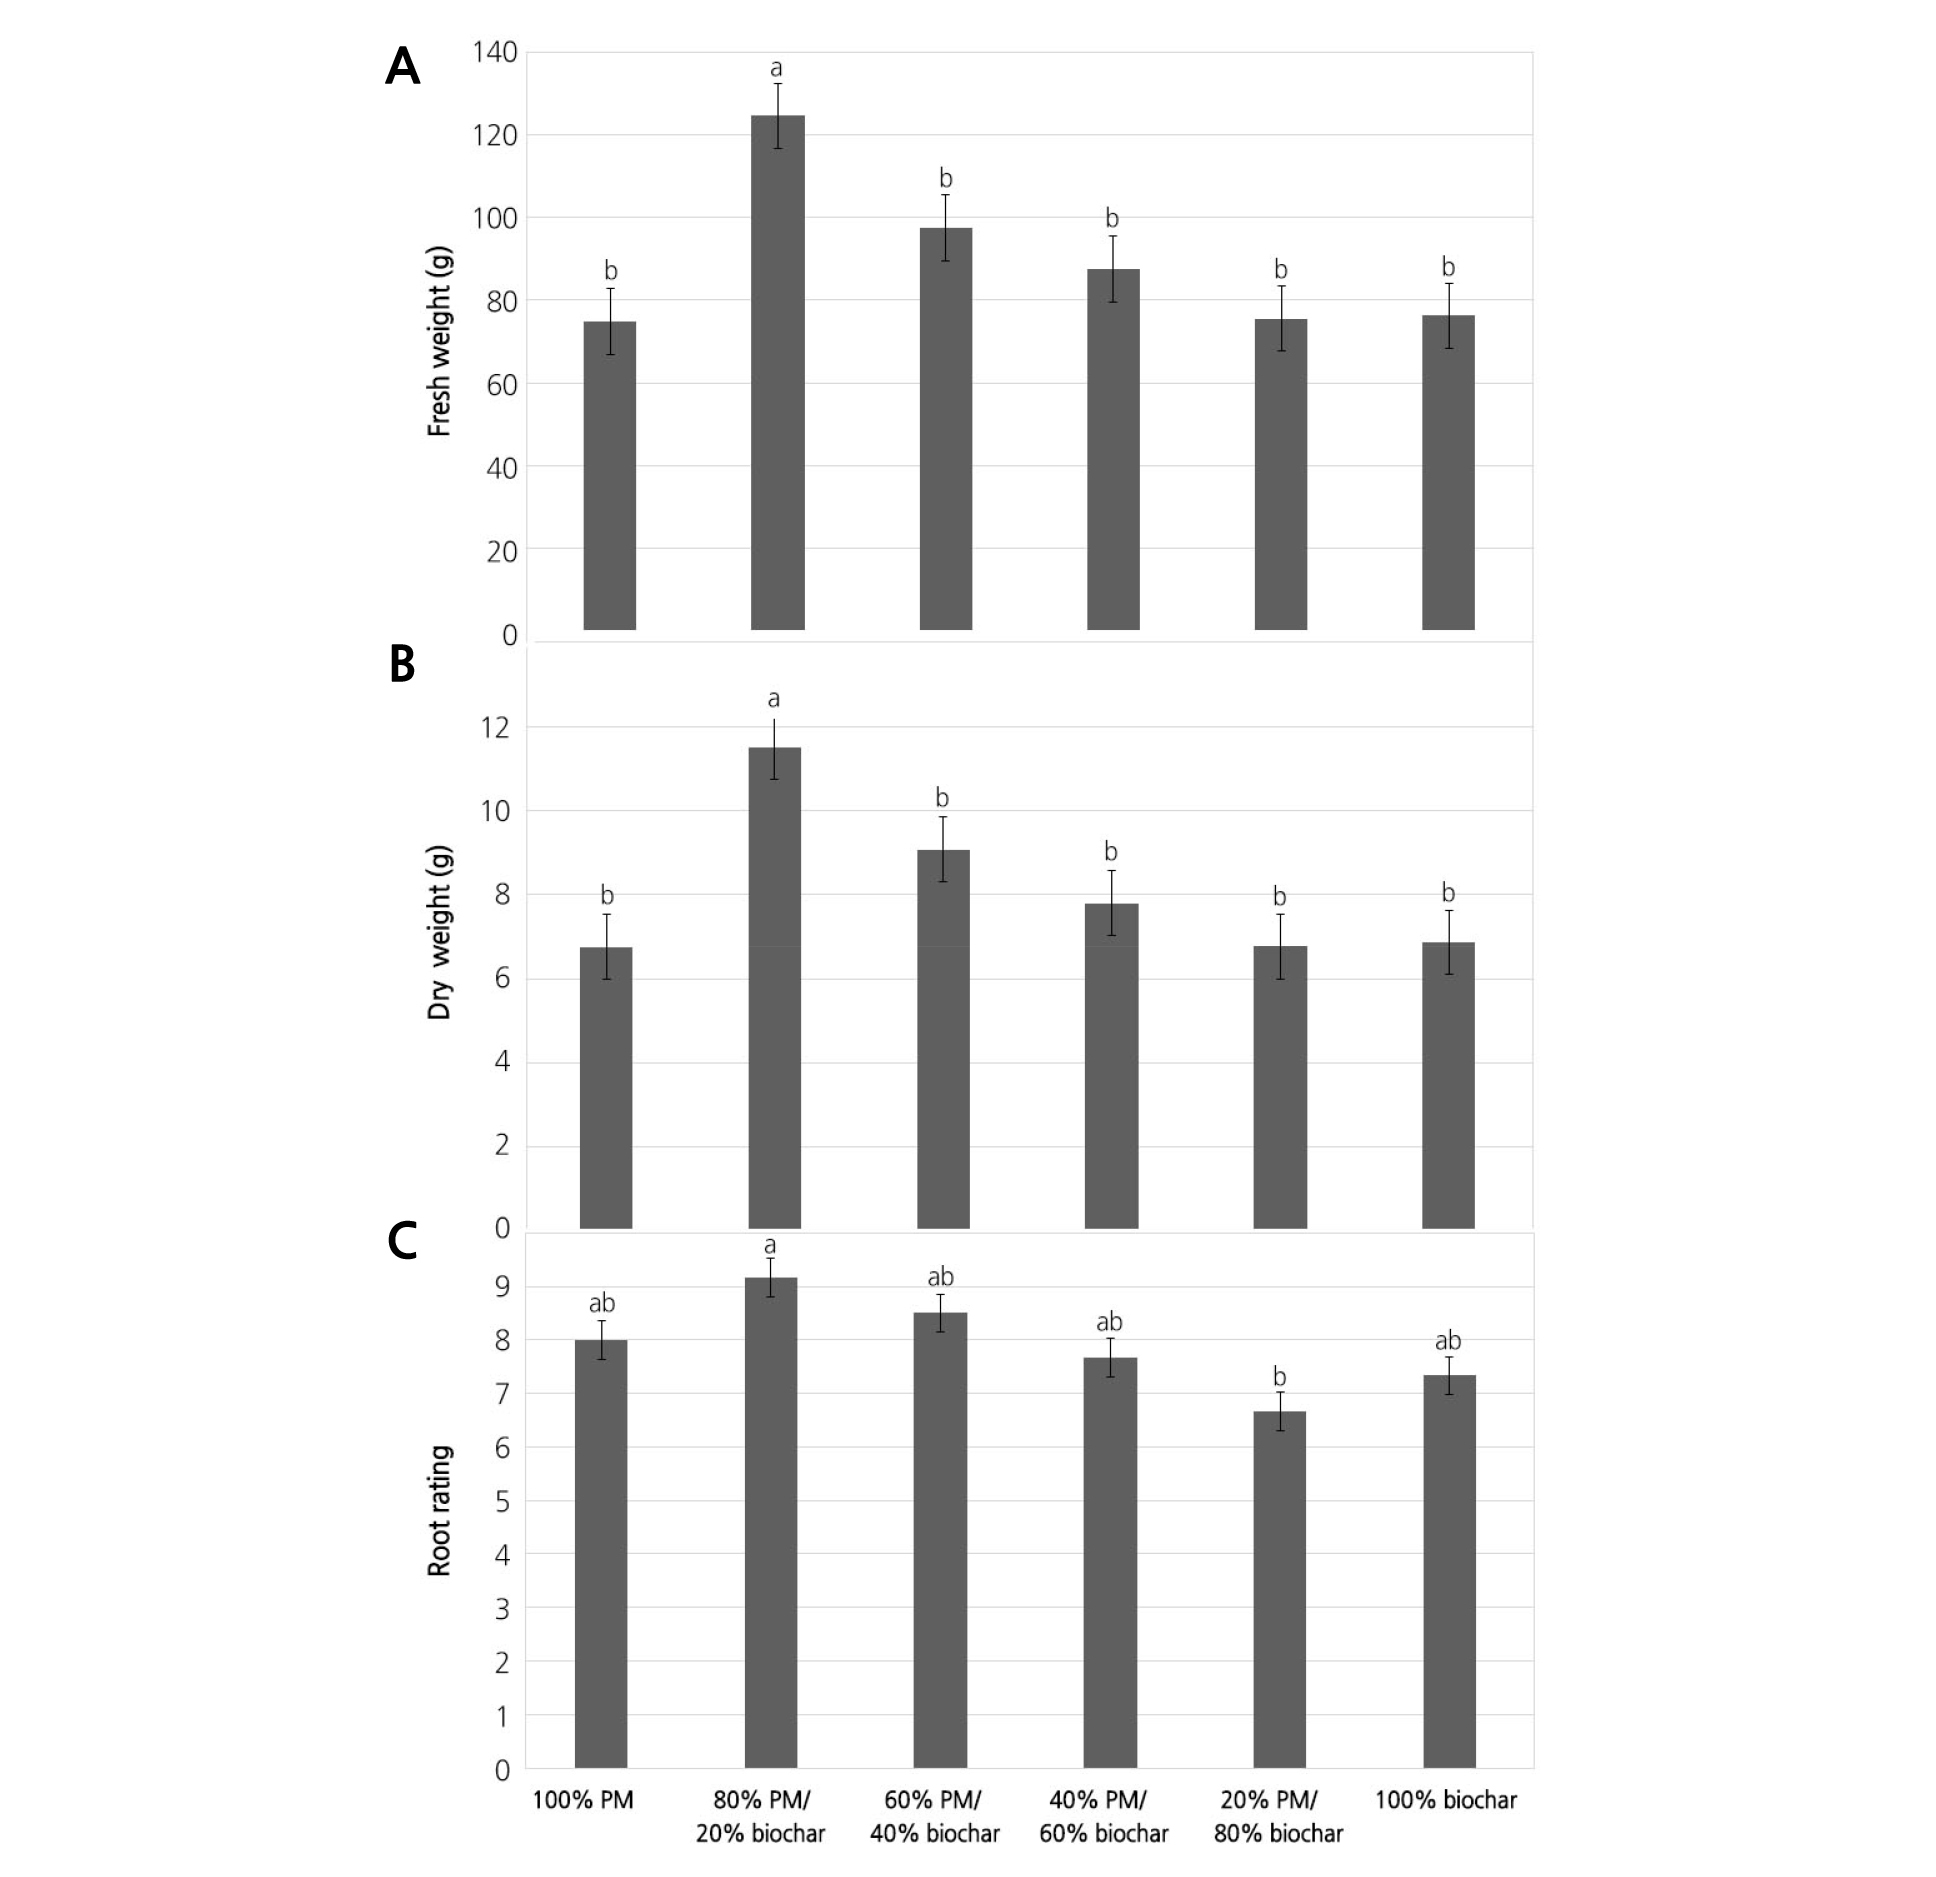
Fig. 5. Fresh weight (FW) (A), dry weight (DW) (B), and root rating (C) of basil plants grown in Sunshine #1Mix [peat-moss (PM) based] substrates amended with six levels of biochar percentage: 100% PM and 0% biochar, 80% PM and 20% biochar, 60% PM and 40% biochar, 40% PM and 60% biochar, 20% PM and 80% biochar, and 100% biochar at 61 days after transplanting. Bars represent standard error. Means within each treatment followed by the same letter are not significantly different, tested by student-newman-keuls (SNK) multiple comparison at p < 0.05.
Discussion
Biochar amendment can change PM chemical and physical properties, as Dumroese et al. (2011) demonstrated that a mixture of 75% peat and 25% pellets biochar has been found to enhance hydraulic conductivity and increase water availability at lower matric potential. High quality Sphagnum peat has low pH, high cation exchange capacity (CEC), low inherent fertility, proper balance of aeration and water-holding porosity, and sufficient rigidity to support the plant to be used alone, and is often mixed with inorganic amendments to improve soil structure (Landis et al., 1990). Due to the high pH of biochar, it could be added to peat moss at a concentration of up to 75% (vol.) for nursery production of plants (Steiner and Harttung, 2014). In this present study, tomato plants grown in PM mixes with higher biochar incorporation had higher substrate pH and lower leachate EC, while there was no significant difference of substrate pH and leachate EC among the biochar treatments in lettuce.
The proper percentage of biochar mixed with PM could have a positive impact on plant performance. The biochar could replace commercial peat moss and perlite-based substrate (Sunshine #1 Mix) from 5-30% (vol.) without negative impact on plant growth of gomphrena (Gu et al., 2013). Similarity between physical properties of the biochar used in this study and PM tested in this experiment could have contributed to the fact that replacing Sunshine #1 Mix at substantially high rate (>50%) did not negatively affect plant growth. The biochar amendment increased plant height and leaf size, but had no effect on flower and fruit yield in tomato (Graber et al., 2010). Facella (2015) reported that the stem diameter and leaf area of Euphorbia x lomi increased by adding 60% (vol.) conifer wood biochar to peat substrate. Flower production and root length also increased in plants grown with 45% and 60% (vol.) biochar (Facella, 2015; Olszewski and Eisenman, 2017). The present study had a much higher incorporation rate of biochar in peat moss substrate. The negative impact of biochar on tomato plants was only found on PM mixes with 80% and 100% (vol.) biochar, which may be due to the lower fertility (indicated by lower EC level). Chrysanthemum grown in PM mixes with 60% or higher biochar had improved shoot growth. In basil, plants grown in PM mixes with 20% biochar had improved yield and root growth. Visual rating of the root ball is a subjective indirect measurement of root growth, which does not assess root growth inside of the root ball, but is a much less labor-intensive process than measuring root dry weight. Measuring root dry weight has its own limitations. In addition to being labor intensive, roots often penetrate media particles and root loss normally occurs when washing media off roots.
The improved plant productivity by biochar can be directly due to its nutrient content and release characteristics (Graber et al., 2010), and it can be indirectly due to improved nutrient retention (Lehmann et al., 2003), soil pH (Rondon et al., 2007), and increased soil carbon exchange capacity (Liang et al., 2006). In the ornamental plant Calathea rotundifola cv. Fasciata, adding 50% biochar green waste to peat substrate could increase total plant biomass, leaf biomass and leaf area, which may be due to the improved substrate condition by biochar causing increased nutrient release (Tian et al., 2012). Biochar mixed with peat (25-75%) (vol.) has no effect on plant size and little effect on plant weight of miniature sunflower plants (Steiner and Harttung, 2014). In the present study of lettuce, no significant effect was observed in plants grown in PM mixes with up to 80% biochar.
Based on the results from the four plants tested in this experiment, incorporating biochar in container substrate could have positive effect on plant growth at low (20%) or very high rate (80% or 100%; by volume), and no negative effect on plant growth was observed in mixes incorporating biochar as high as 60% compared to PM. Therefore, the biochar used in this study could substantially (>50% by volume) replace peat-based substrate for horticulture plant growth in containers.
