

Introduction
Materials and Methods
Plant Materials
Whole Genome Resequencing
Selection of SNPs for MABC (marker-assisted backcross)
Genetic Relationship and Analysis of SNP Distribution in 19 Inbred Lines
Marker Development Specific to Crimson-type Watermelon
Results and Discussion
Summary of Whole Genome Resequencing of 19 Watermelon Inbred Lines
Discovery of SNPs for MABC Marker Development
Analysis of Relationship Between the Inbred Lines by SNP Localization
Development and Verification of Crimson- and Jubilee-type Specific Markers
Development and Verification of Crimson- and Jubilee-type Specific Markers
High Density-SNP Regions Specific to Fruit-related Traits
Introduction
Watermelon is one of the most economically important fruit and vegetable crops that taxonomically belongs to the Cucurbitaceae family and Citrullus genus. Watermelon originated from South Africa about 5,000 years ago and has since been introduced to Egypt, Mediterranean Europe, Central Asia,
and the United States during the European colonial era (Levi et al., 2011; Whitaker et al., 1976). The genus Citullusis is classified into four diploid species, C. colocynthis (L.) Schrad, C. ecirrhosus Cogn., C. rehmii De Winter, and Citrullus lanatus (Thunb.) Matsum & Nakai, among which Citrullus lanatus is one that is commercially grown and possesses red flesh color and sweetness characteristic to the species (Levi et al., 2001a; Levi et al., 2001b; Paris, 2015). A recent molecular-phylogenetic study using plastid and nuclear data, however, revealed that a sweet watermelon specimen (‘1773’) identified in South Africa may be more closely related to a perennial wild species, C. ecirrhosus Cogn. that originated from West Africa, but has been previously considered and classified as C. lanatus (Chomicki and Renner, 2015).
Despite the narrow bottleneck of genetic diversity from “the founder effect” that stemmed mainly from a limited number of accessions used in modern watermelon breeding (Levi et al., 2001b; Reddy et al., 2015), it is noteworthy that fruit traits (C. lanatus) such as shape, flesh and skin color, and the striped rind pattern are phenotypically diversified (Levi et al., 2004; Park and Cho, 2012, UPOV, http://www.upov.int). Cultivated watermelons can be largely divided into Crimson-type and Jubilee-type depending on their genetic (breeding) background and fruit-related traits. Crimson-type fruit is characterized by red or scarlet flesh covered in light green rind with broad green rind stripes, and represents cultivars historically bred in the US, Europe, and Middle East; whereas, Jubilee-type watermelon is characterized by pink and crisp flesh covered in a dark green rind with black stripes (i.e. tiger-strip rind pattern) are traditional cultivars in Asian countries including South Korea and Japan (Park and Cho, 2012). In recent years, it has become apparent that consumer demands favor a variety of colors (e.g., red, pink, yellow, orange), sizes (e.g., ice box-type to 15 Kg), and shapes (e.g., circular, oblong, elongated) that reinforce the development of new varieties by introducing new germplasms, and conventional and molecular breeding strategies to expand the genetic diversity of watermelon (Kim et al., 2015b; Levi et al., 2004; Park and Cho, 2012).
Although the narrow genetic diversity of watermelon and the limitation of using classical molecular markers such as restricted fragment length polymorphisms (RFLPs), random amplified polymorphic DNAs (RAPDs), and simple sequence repeats (SSRs) have so far hindered the discovery of novel gene polymorphisms, recent advancements of next-generation sequencing (NGS) technology and high-throughput genotyping approaches has made it possible to identify a new set of single nucleotide polymorphisms (SNPs) in cultivated watermelons. The whole genome of cultivated watermelon was first sequenced using the Chinese inbred line '97103' (Ren et al., 2012) that has become a reference genome sequence (97103 v1) (Cucurbit Genome Database, CGD, http://www.icugi.org/cgi-bin/ICuGI/genome). Whole genome resequencing (WGRS) of 20 inbred lines (ten of C. lanatus ssp. vulgaris, six of C. lanatus ssp. mucosospermus, and four C. lanatus ssp. lanatus) uncovered a large number of nucleotide sequence variations (i.e., 6,000,000 single nucleotide polymorphisms and 960,000 insertions/deletions (Indel); Guo et al., 2013). In addition, Nimmakayala et al. (2014) conducted a genotype-by-sequencing (GBS) for 183 C. lanatus ssp. lanatus accessions and identified a suite of 11,458 SNP markers. These results enable rapid, efficient, and cost-effective ways for analyzing the genomic structure, genetically complex trait loci, and mining novel genes based on molecular markers in watermelon.
Marker-assisted backcrossing (MABC) is a breeding technique that employs molecular markers to select backcross progeny associated with a target trait and shortens the recovery time of the recurrent parent genome (Edwards and Batley, 2010). In MABC, not only the introduced trait of the donor parent is selectable using molecular markers (i.e, foreground selection), but also it is also possible that backcross progeny can be detected early using a number of recurrent parent chromosome-specific markers (i.e., background selection). Although MABC technology has been successfully applied to various crops including rice (Hasan et al., 2015; Neeraja et al., 2007) and pepper (Jeong et al., 2015) to develop new cultivars, its application to horticultural crops such as watermelon is still lacking.
In this study, we performed WGRS on 19 advanced watermelon inbred lines with various fruit traits and identified a new collection of genome-wide SNPs. Based on the SNP information collected, we analyzed the genetic relationship between the inbred lines, identified SNPs specific to Crimson- and Jubilee-type cultivars, and examined the distribution pattern of SNPs at QTLs, which provided a genetic and molecular foundation for the marker-assisted breeding (MAB) and development of new watermelon cultivars.
Materials and Methods
Plant Materials
A total of 19 inbred watermelon lines used for whole genome resequencing (WGRS) were obtained from three domestic seed companies in South Korea (Table 1). Various fruit traits such as shape (e.g., circular, elliptic), rind color (e.g., black, green, yellow), stripe pattern (e.g., non-stripe or solid, green stripe, black stripe), and flesh color (e.g., pink, red, yellow) that are characteristics to either the Crimson- or Jubilee-type are examined (Table 1). Seedlings from each inbred line were grown in a plastic cell tray in a greenhouse (Pusan National University, Miryang, Korea). The fully expended 2nd and 3rd true leave were collected for genomic DNA extraction.
Table 1. List of 19 watermelon cultivars (inbred lines) collected from three private seed companies in Korea and their representative fruit
characteristics
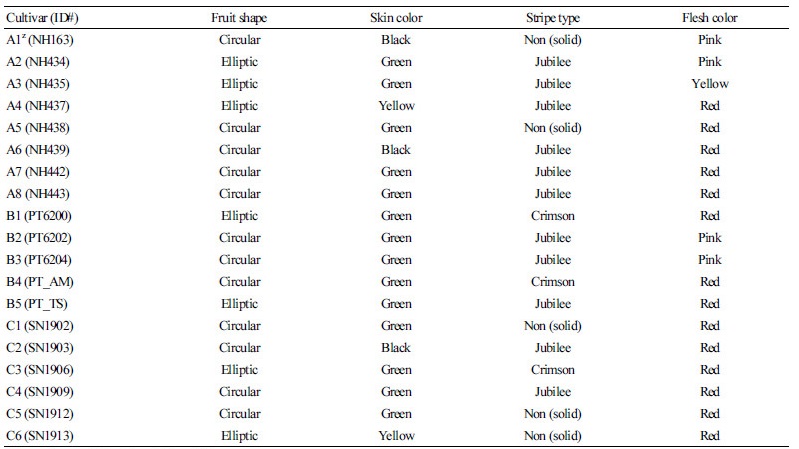 | |
zCompanies are indicated as A, B, and C. | |
Marker Development Specific to Crimson-type Watermelon
Of the 19 inbred lines, three Crimson-type (CT), eleven Jubilee-type (JT), and five non-stripe-type (solid rind) were classified according to their stripe patterns (Table 1), and the Jubilee-type specific SNP markers were searched. Throughout the entire SNP matrix, we identified HRM primer sets for SNPs that were 1) monomorphic among Crimson-type, 2) monomorphic among the rest (n = 16) of the non-Crimson-type, and 3) polymorphic between Crimson-type and non- Crimson-type inbred lines. In addition, SNPs that had recognition sites for restriction enzymes were subjected to CAPS primer set generation. We searched for restriction enzyme recognition sites for the SNPs that were available in an in-house database at the Seeders Company (Daejeon, South Korea), and designed CAPS primer sets using Primer3 (http://bioinfo.ut.ee/ primer3- 0.4.01).
For PCR amplification, we used 10 ng genomic DNA, 0.3 µM each primer, 1x PCR buffer, 0.2 mM dNTPs, and 0.5 U Taq polymerase (Solgent, Daejoen, South Korea) in a total reaction volume of 20 µL. Reactions were initially incubated at 95°C for 5 min (Touch-down PCR), followed by 10 cycles of 95°C for 15 s, 65°C for 30 s (decreasing incrementally by 0.5°C per cycle), 72°C for 1 min; followed by 35 cycles at 95°C for 15 s, 60°C for 30 s, and 72°C for 1 min; and a final cycle at 72°C for 3 min. Amplicons were digested following the manufacturer’s protocol (New England BioLabs, Inc., Ipswich, MA, USA). Digested products were analyzed by electrophoresis in a 2% agarose gel that contained 1x TAE (Tris-acetate-EDTA) buffer at 180 V for one hour, followed by ethidium bromide staining and examination under UV light.
Results and Discussion
Summary of Whole Genome Resequencing of 19 Watermelon Inbred Lines
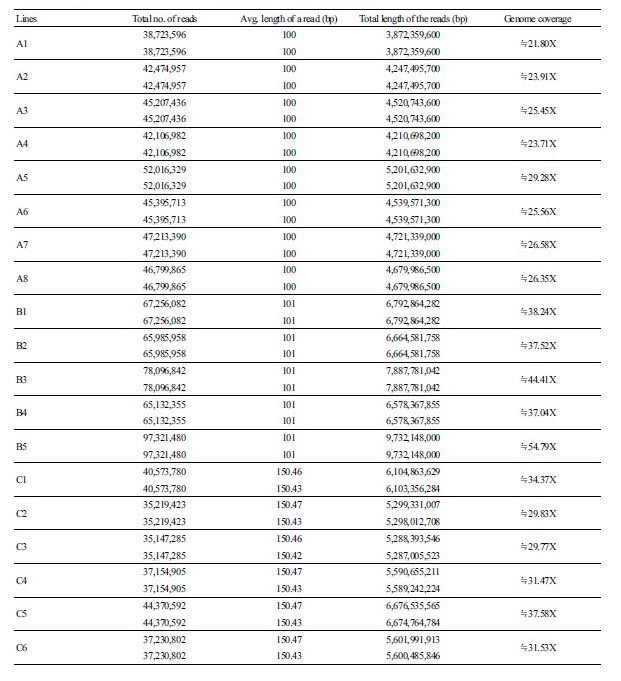
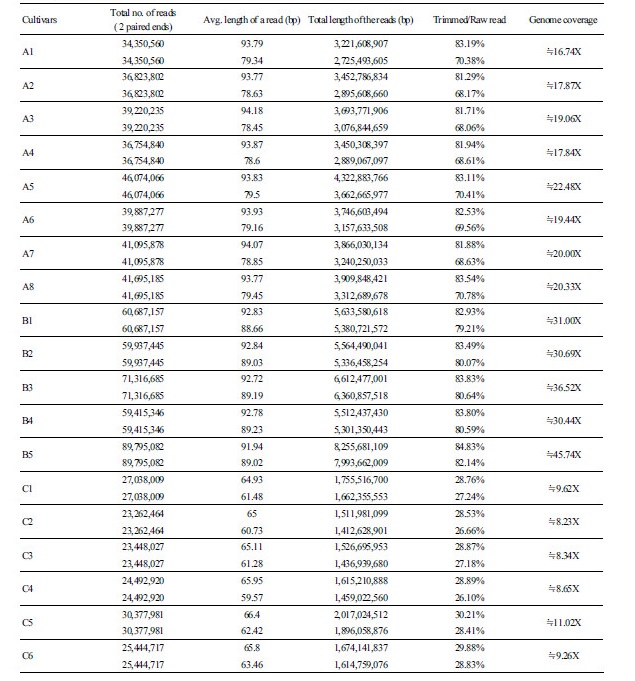
We have completed an NGS-based whole genome resequencing (WGRS) for 19 inbred lines of watermelon cultivars (Table 1). A summary of the resequencing for the number of generated reads, the average length of reads, the total length of reads, and the genome coverage for each DNA sample of the inbred lines is presented in Supplementary File 1 (S1). In short, the number of generated reads ranged from 35,147,285 (C3) to 97,321,480 (B5) with an average read length between 100 bp and 150.46 bp. The total length of generated reads for each inbred line ranged from 3,872,359,600 bp (A1) to 9,732,148,000 bp (B5). The genome coverage, which is the total read length of each inbred line divided by the reference sequence size (425 Mb), varied from 21.80 × (A1) to 54.79 × (B5). In addition, information on the sequenced data after trimming is presented as a ratio of the total length of raw reads over the trimmed reads (e.g., trimmed/raw) in Supplementary File 2 (S2). The ratio after trimming for the inbred lines obtained from various seed companies differed (Supplementary File S2): the ratio range for 13 inbred lines from companies A and B was between 68.06% (A3) and 84.83% (B5), but it was very low for six inbred lines from company C, which ranged from 26.10% (C4) to 30.21% (C5). These differences after trimming for the six latter inbred lines were partly due to the different sequencing platforms used. In case of the 13 inbred lines from companies A and B, sequence analysis was performed on HighSeq2000 NGS platform, while the six inbred lines from company C was performed on a Newseq platform. Nevertheless, even after the trimming process, a total genome coverage of at least 8-45x was obtained for all samples and the sequenced data were subjected to downstream SNP analysis.
Discovery of SNPs for MABC Marker Development
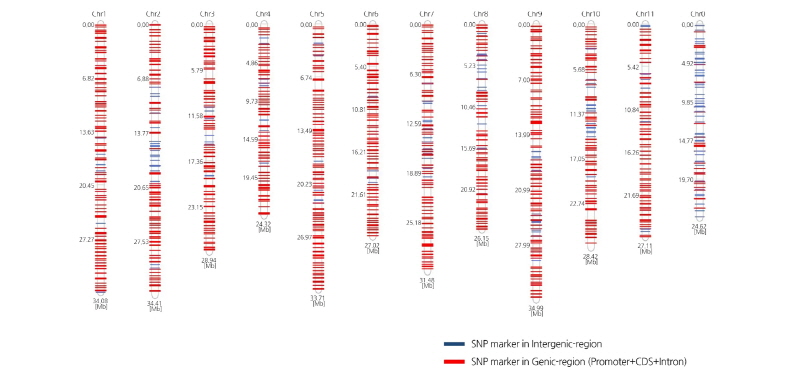
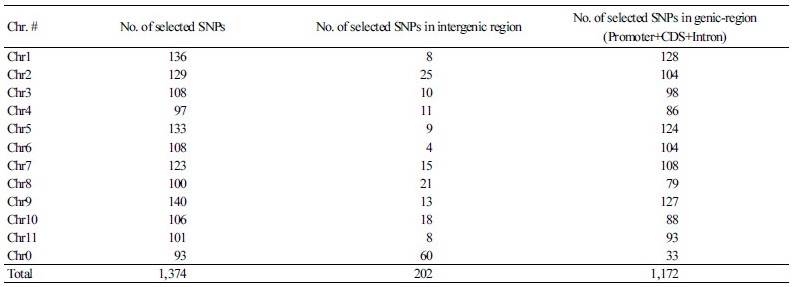
Based on an SNP matrix of 19 inbred lines we calculated and selected high values of polymorphism information content (PIC) to develop SNP markers for MABC. In total, 424,953 SNPs were chosen to calculate PIC values that ranged from 0.095 to 0.375 with a mean value of 0.241. If the PIC value of a SNP is higher between 0 and 1, the possibility of existence of the SNP for a certain gene or allele in a population is higher. We have selected SNPs with a PIC value higher than 0.095 so that we could use this information to develop makers for MABC. Of the selected 1,374 SNPs present at 0.5 Mb intervals on each chromosome, we identified 1,172 of these SNPs in genic regions that included a coding sequence (CDS), promoter, and intron; 202 of the SNPs were located in intergenic regions (Fig. 1). Overall, information on these SNPs and the primer information for high resolution melting (HRM) analysis used in MABC are provided in Supplementary File 3 (S3).
Analysis of Relationship Between the Inbred Lines by SNP Localization
Using the selected 1,374 SNPs (S3), we performed PCA and classified 19 inbred lines into three groups (Group A, B, and C) based on PC1 and PC2, which represent combinations of SNPs that showed maximum variation among the lines (Fig. 2). Based on the phenotypic characteristics for the stripe patterns of the watermelon cultivars, PCA clearly separated the 19 inbred lines into the Crimson-type that had broad and light green striped fruit (Group C), and non-Crimson-type (Group A and B) that had a narrow and black striped rind (Jubilee-type). This genetic distinction was not supported when the correlation of other fruit traits such as fruit shape, skin color, and flesh color in either type of cultivars were examined (Table 1, Fig. 2). Thus, PCA in this study using SNPs detected in 19 inbred lines further confirmed that a striped rind pattern is one representative fruit trait that distinguishes the Crimson-type from the non-Crimson-type as previously noted (Kim et al., 2015a).
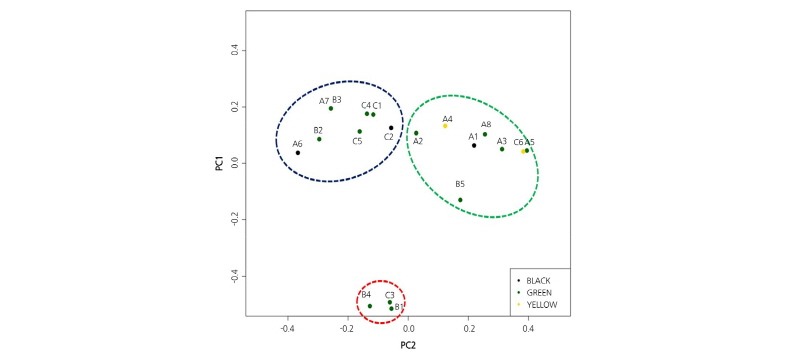
PFig. 2. rincipal components analysis (PCA) of 1,374 genome-wide SNPs. Crimson- (red circles) and Jubilee-type (blue and green circles) watermelon cultivars were grouped independently, but no significant differences in their clustering was observed based on fruit skin color (black, green, yellow dots) and fruit shape.
Using three selected inbred lines (A8: Group A, B2: Group B, and B1: Group C) grouped separately in PCA, we determined the genome-wide diversity distribution of SNPs and InDels, and their relation to previously reported QTLs (Hashizume et al., 2003; Ren et al., 2012; Sandlin et al., 2012). Locations of SNPs, InDels, and major fruit trait QTLs were displayed as a circular genome schematic (Fig. 3). As shown in the Circos plot, based on the genome-wide distribution of coding sequences, the majority of genes were located in the paracentromeric region of the chromosome and the frequency of distribution decreased in the centromeric region (Circle 2). When we examined the distribution of SNPs (Circle 3) and InDels (Circle 4) in three inbred lines (A8, B1, and B2) selected in PCA (Fig. 2), they were present at a relatively higher frequency in the genomic regions with a low number of genes (Circle 2) (Fig. 3). Comparison of the distribution frequency for SNPs and InDels between these three lines revealed different patterns and indicated that genetic similarity was low, which further supported the PCA results (Figs. 2 and Fig. 3). In addition, it was observed that QTL distribution (Circle 5) associated with fruit traits including fruit shape, fresh weight, seed size, and the glucose, sugar, saccharide, and fructose content was centralized on chromosomes 2 and 6, implying that many genes responsible for these fruit traits are clustered together in the genome. Moreover, the majority of QTLs were located in the paracentromeric regions of chromosome, which are regions of high gene density. The QTLs detected on chromosome 3 and 6 localized in genomic regions with high frequency of SNPs specific to either Crimson- or non-Crimson-type traits, indicating that the genes of these SNPs could be important for the characteristic differences between these two watermelon types.
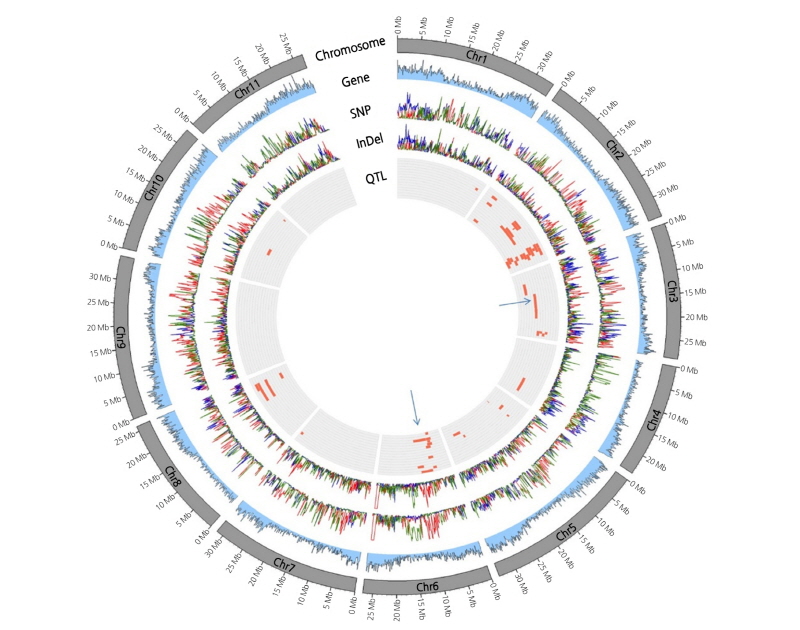
Fig. 3. A Circos plot showing genome-wide distribution of coding sequences (second circle from outside), SNPs (third circle), InDels (fourth circle) and the position of QTLs for watermelon fruit-related traits (fifth circle). Peaks in the second, third, or fourth circles indicate the number of genes, SNPs, or InDels detected in every 100-Kb genomic region (minimum = 0, maximum = 300). NPs and InDels colored in green, red, and blue indicate the cultivars A8, B1, and B2, respectively (refer to Fig. 2 for their genetic relatedness). Two QTL blocks are possibly responsible for Jubilee or Crimson-type watermelon-specific fruit traits and are indicated by blue arrows.
Development and Verification of Crimson- and Jubilee-type Specific Markers
A total of 259 SNPs that can distinguish between Crimson and non-Crimson-type cultivars were selected and HRM primer sets for these SNPs were designed (S3). Of 259 SNPs, 54 could also be used as cleavage amplified polymorphic sequence (CAPS) markers. Among these 54 SNPs, 26 relatively high read depth (≥10) in all 19 inbred lines the PIC values of ≥ 0.30 used to design primers for CAPS markers (Table 3). Using 26 CAPS markers, PCR was performed on 11 of the inbred lines that included three Crimson-type and eight Jubilee-type cultivars to verify the application of the SNPs detected by resequencing (Table 4). Aside from two CAPS markers (WSNP-2 and WSNP-20) that failed to amplify a PCR product, 19 of the 24 markers were in agreement with rates of higher than 0.8 between genotypes of SNPs and CAPS. Furthermore, the average agreement rate for all CAPS markers was 0.85 (Table 4), suggesting that the SNPs identified has high reliability. The discrepancy between SNP information and CAPS genotyping was also noted; it is likely that this may have resulted from a technical error of the resequencing process, or that since the observed inconsistencies were mainly due to a failure of the restriction digestion, the discrepancy may have been due to methylated sites within the recognition sites of the enzymes used (McClelland, 1981). However, given that the overall reliability and applicability of the Crimson- and Jubilee-type specific SNPs detected in this study was as high as 85% of the average agreement, most of 259 SNPs discovered in this study are not only useful for cultivar identification between the Crimson- and Jubilee-type, but will be valuable for MABC that uses these two watermelon types as donor or recurrent parents.
Table 3. List of CAPS markers designed for the SNPs specific to the Crimson-type(CT) or Non-Crimson-type (NCT) watermelons
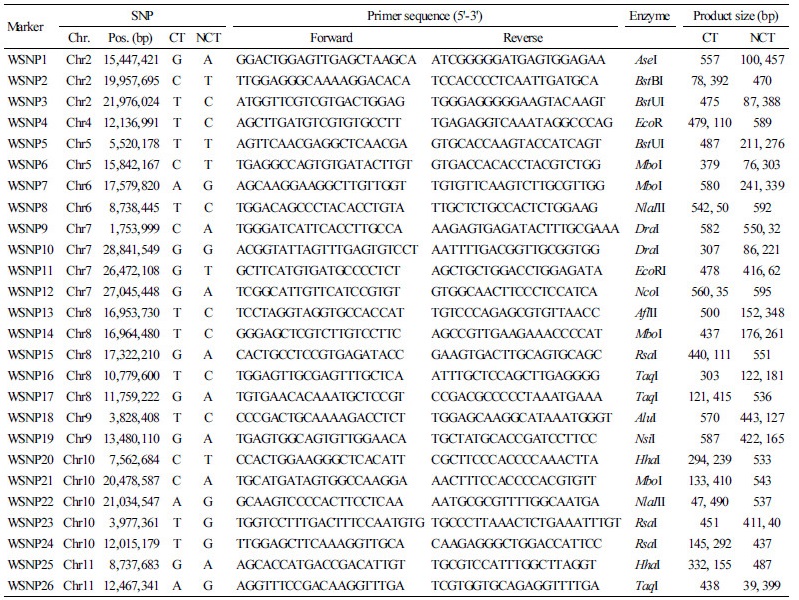 |
Table 4. The results of the SNP/CAPS match rate analysis in 11 watermelon inbred lines
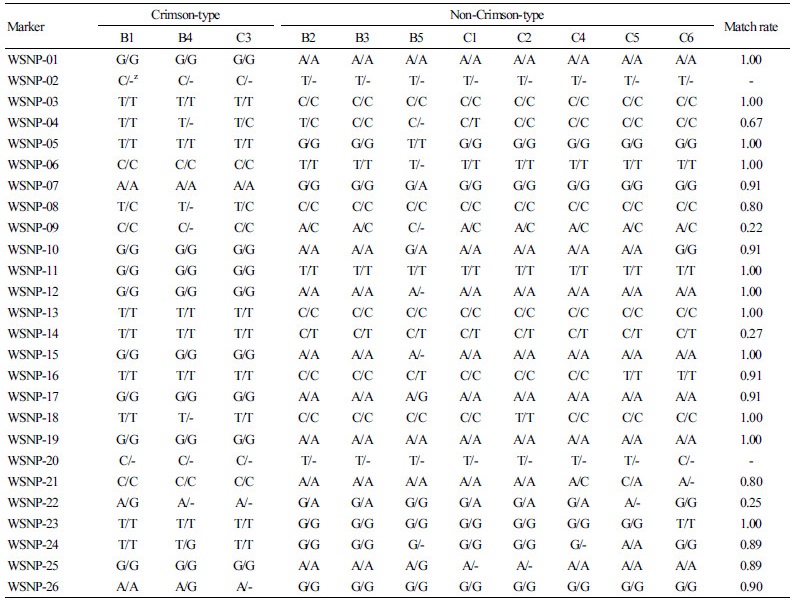 | |
z(-) Indicates that the genotype was not available due to a failed PCR. | |
High Density-SNP Regions Specific to Fruit-related Traits
The genome-wide distribution of SNPs specific to fruit-related traits was investigated. All 19 inbred lines were grouped based on fruit shape, flesh color, striped rind pattern, and rind (skin) color; trait-specific SNPs that were monomorphic within the group and polymorphic between the groups were identified. Chromosome positions that were highly dense with trait-specific SNPs (SNP hotspot) are illustrated in Supplementary File 4 (S4). Interestingly, SNPs associated with the striped rind patterns that were Crimson-/Jubilee-type-specific were concentrated at 25-26 Mb region of Chr. 6, where a SCAR marker tightly linked to rind stripe pattern was identified (Kim et al., 2015; Park et al., 2016) (Fig. 4). Hot spots for rind color-specific SNPs were detected at 6-Mb intervals in Chr. 6 and 3-Mb on Chr. 10. For flesh color, two SNP hot spots were found in 10-Mb and 19-20-Mb intervals on Chr. 1 and 3-Mb and 7-12-Mb intervals on Chr. 4. In our previous study (Kim et al., 2015a), a major QTL for fruit shape was detected from Chr. 3; however, no SNP hot spot was found for the fruit shape trait in this study. The trait-specific SNP hot spots found in our study may be associated with a chromosome block carrying loci responsible for the particular trait and could be an ideal region to develop molecular markers for selecting that trait.
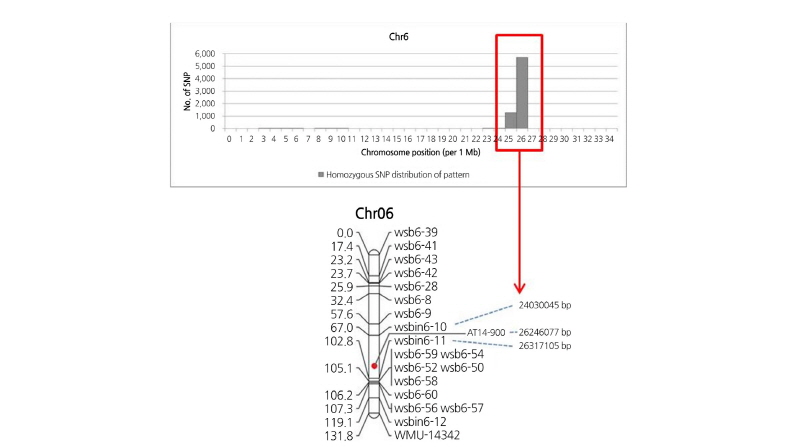
Fig. 4. Chromosome position of stripe rind pattern-specific SNPs on Chr. 6 (up) and the genetic linkage map for markers (wsbin6-10 to wsbin6-11) linked to stripe rind pattern (Kim et al., 2015a) (down). Physical locations of SNP hot spots (red box) are according to the map locus for stripe rind pattern.
