

Introduction
Materials and Methods
Plant Materials
Treatment with Ethylene
RNA Extraction and cDNA Synthesis
Quantitative Real-Time RT-PCR (qRT-PCR)
Experiment Design and Data Analysis
Results
Vase Life and Senescence of Cut Roses
Expression of Ethylene Biosynthesis Genes
Expression of Ethylene Receptor Genes
Expression of Ethylene Signaling Genes
Discussion
Introduction
Flower senescence in most species is associated with several physiological and biochemical changes regulated by the plant hormone ethylene (Reid et al., 1992). Rose plants are classified as ethylene sensitive and show a considerable amount of ethylene production under abiotic stresses including lack of water, vibration, darkness, and high and low temperature (Faragher et al., 1987; Mor et al., 1989; Muller et al., 2001; Huang et al., 2017; Gong et al., 2018). While the vase life of cut
roses is largely dependent on water stress (Doi et al., 2000), cut roses are also susceptible to ethylene injury and show a distinct variation in sensitivity to the hormone depending on the genotype (Reid et al., 1989; Muller et al., 1998; Macnish et al., 2010; In et al., 2017). Ethylene perception by the ethylene receptors has been proposed to be indispensable for the initiation of ethylene-mediated senescence, and the ability to perceive ethylene is strongly related to changes in ethylene sensitivity during flower development (Thomas et al., 1985; Bleecker et al., 1988; Borochov and Woodson, 1989; Verlinden et al., 2002).
In rose plants, five ethylene receptor genes (RhETR1, RhETR2, RhETR3, RhETR4, and RhETR5) and several downstream target genes (RhCTR1, RhCTR2, RhEIL1, and RhEIN3) have been identified to date that act in a signal transduction cascade (Muller et al., 2000a; Muller et al., 2000b; Muller, 2002; Müller et al., 2003; Wang et al., 2004; Tan et al., 2006). Ethylene perception by the receptor family inactivates the Raf-like kinase CTR1, immediately downstream of the ethylene receptor, inhibiting the negative regulation of the receptors at the cell membrane (Chang et al., 1993; Kieber et al., 1993; Hua and Meyerowitz, 1998; Hua et al., 1998; Sakai et al., 1998).
The various organs in flowers have different senescence rates and sensitivities to ethylene. During carnation flower senescence, the transcripts of ethylene synthesis genes, such as DcACS1-2 and DcACO1, accumulate first in the ovaries, followed by the styles, receptacle, and petals (Jones and Woodson, 1997; Jones and Woodson, 1999). In the cut rose ‘Samantha’, the expression of ethylene biosynthesis and receptor genes is differentially induced by ethylene in different floral tissues (Xue et al., 2008). Previous studies have also shown that the expression of the ethylene biosynthesis, receptor, and signaling genes varies tissue specifically during flower development and senescence (O'Neill et al., 1993; ten Have and Woltering, 1997; Jones, 2003). However, the nature of the floral organ responses to ethylene during flower senescence is not clear in cut roses, and it is also not fully understood why the responses to ethylene differ among rose varieties. We previously demonstrated that ethylene sensitivity varies considerably depending on the variety of cut roses and is mediated by the expression of ethylene synthesis genes (In et al., 2017; In and Lim, 2018).
In this study, we carried out experiments to test the hypothesis that the onset of ethylene response varies tissue specifically according to the variety and that this accounts for the differential responsiveness to ethylene among rose cultivars. To explore the relationship between flower senescence and tissue sensitivity to ethylene, we monitored the expression patterns of ethylene biosynthesis, receptor, and signaling genes in various floral organs during flower senescence in two cut rose cultivars, which have distinct sensitivity to ethylene.
Materials and Methods
Plant Materials
Cut roses (Rosa hybrida L.) of ethylene-sensitive (‘All For Love’) and -insensitive (‘Peach Valley’) cultivars were selected based on our previous study (In et al., 2017). Cut roses were harvested from a commercial grower in Goyang, Korea in October 2017. Immediately after harvest, the cut flowers were placed in a bucket containing tap water and then transported to the laboratory within 2 h. At the laboratory, the rose stems were trimmed to 50 cm with three upper leaves. Flowers were kept in a glass jar containing 500 mL of distilled water; 12 replicates consisting of one flower per vase were used. For nontreated control, flower organs were detached from 3 of 12 of the flowers of each cultivar prior to ethylene treatment.
Treatment with Ethylene
For ethylene exposure, cut flowers were enclosed in a transparent plastic chamber (462 L) at 25°C under dark conditions. Based on the work of In et al. (2017), 10 µL·L-1 ethylene was used for the following treatments. Two petri dishes containing 100 mL of 1 M KOH were placed in the chamber to prevent the accumulation of CO2 released by respiration during treatment. After 20 h of the treatment, six of nine flowers per cultivar were placed under the following controlled conditions for vase life assessment: 25°C room temperature, 50% relative humidity, and 30 µmol.m-2.s-1 fluorescent lighting for 12 h. The remaining three flowers in each cultivar were used for floral organ detachment after exposure to ethylene.
RNA Extraction and cDNA Synthesis
Total RNA from leaves, pedicels, receptacles, sepals, petals, stamens, and stigmas was extracted using the GeneJET plant RNA Purification Mini Kit (Thermo Fisher Scientific, Baltics, Lithuania) with slight modifications to the manufacturer’s procedure. Total RNA was quantified at 260 and 280 nm using a NanoDrop spectrophotometer (NanoDrop One, Thermo Fisher Scientific, Madison, USA).
cDNA was synthesized from 0.1 µg of purified total RNA using the Power cDNA Synthesis Kit (INTRON Biotechnology, Inc., Seongnam, Korea) according to the manufacturer’s procedure. Briefly, 9.5 µL of sterile water and 0.1 µg of total RNA were mixed with 1 µL of oligo (dT)15 primer in a total volume of 10.5 µL. The mixture was incubated at 75°C for 5 min and quickly cooled for at least 1 min. Then, reagents were added and mixed gently in the order RNase inhibitor, 5x reverse transcriptase (RT) buffer, deoxyribonucleotide triphosphate (dNTP), dithiothreitol (DTT), and Avian Myeloblastosis (AMV) RT enzyme in a final volume of 20 µL.
The reverse reaction was incubated in a SimpliAmp Thermal Cycler machine (AB Amplied Biosystems, Singapore) for 60 min at 42°C followed by 5 min at 70°C to terminate the reaction.
Quantitative Real-Time RT-PCR (qRT-PCR)
The transcript levels of ethylene biosynthesis, receptor, and signaling genes were measured using the StepOnePlusTM real-time PCR system (Applied Biosystems, CA, USA). The gene-specific primers were designed using an online version of Primer 3 software, then synthesized by Cosmogenetech (Seoul, Korea). The qRT-PCR was performed with the primer pairs shown in Table 1. To confirm the amount of template RNA, Rosa hybrida actin (RhACT1) was used as an internal control. Reaction mixtures consisted of cDNA (1 µL) as a template, 0.5 µM forward and reverse primers (2 µL), and 2X Maxima SYBR Green/ROX qPCR Master Mix (10 µL) (Applied Biosystems, USA). Then the reaction mixtures were dispensed in an optical 96-well plate. qRT-PCR reactions were carried out for 2 min at 50°C and for 10 min at 95°C, followed by 40 cycles of 95°C for 15 s, 60°C for 30 s, and 72°C for 30 s. The threshold cycle (Ct) value was automatically detected for each reaction by the qRT-PCR system with default parameters. The final Ct value was the mean of three independent biological replicates, and the coefficient of variance (CV) for each gene was also calculated. The relative level of the gene expression was calculated as the absolute integrated absorbency normalized to the relative actin.
Table 1. The forward and reverse primers used in qRT-PCR to assess mRNA levels for ethylene biosynthesis, receptor, and signaling genes in rose petals 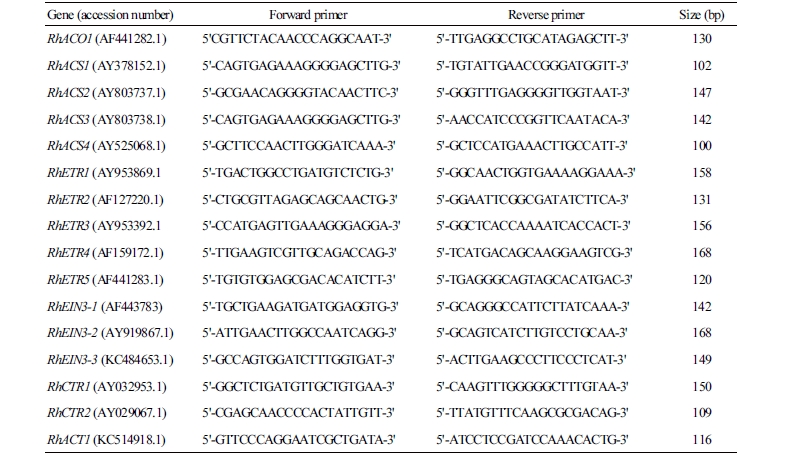 |
Experiment Design and Data Analysis
The vase life experiment followed a completely randomized block design with six replicates for each cultivar and one flower per each replicate. The qRT-PCR analysis was performed with three independent biological replicates. Data are presented as mean ± standard error (SE). Student’s t-tests were performed for no-ethylene and ethylene treatment vase life data at p ˂ 0.05.
Results
Vase Life and Senescence of Cut Roses
To identify the relationship between flower longevity and tissue-specific responsiveness to ethylene, flowers were dissected into petals (Pt), stigmas (St), stamens (Sm), receptacles (R), sepals (Sp), and pedicels (Pd) for qRT-PCR analysis (Fig. 1A); the senescence and vase life of the cut flowers were also evaluated (Fig. 1B, C). Exposure to ethylene immediately (20 h after the treatment) accelerated petal abscission and leaf yellowing significantly in ‘All For Love’, reducing the vase life of cut ‘All For Love’ flowers considerably by 52.86 % (3.3 d) after ethylene treatment (Fig. 1B, C). In contrast, ‘Peach Valley’ cultivar was only slightly affected by ethylene, resulting in less than 1 d of vase life reduction compared with no ethylene (Fig. 1B, C).
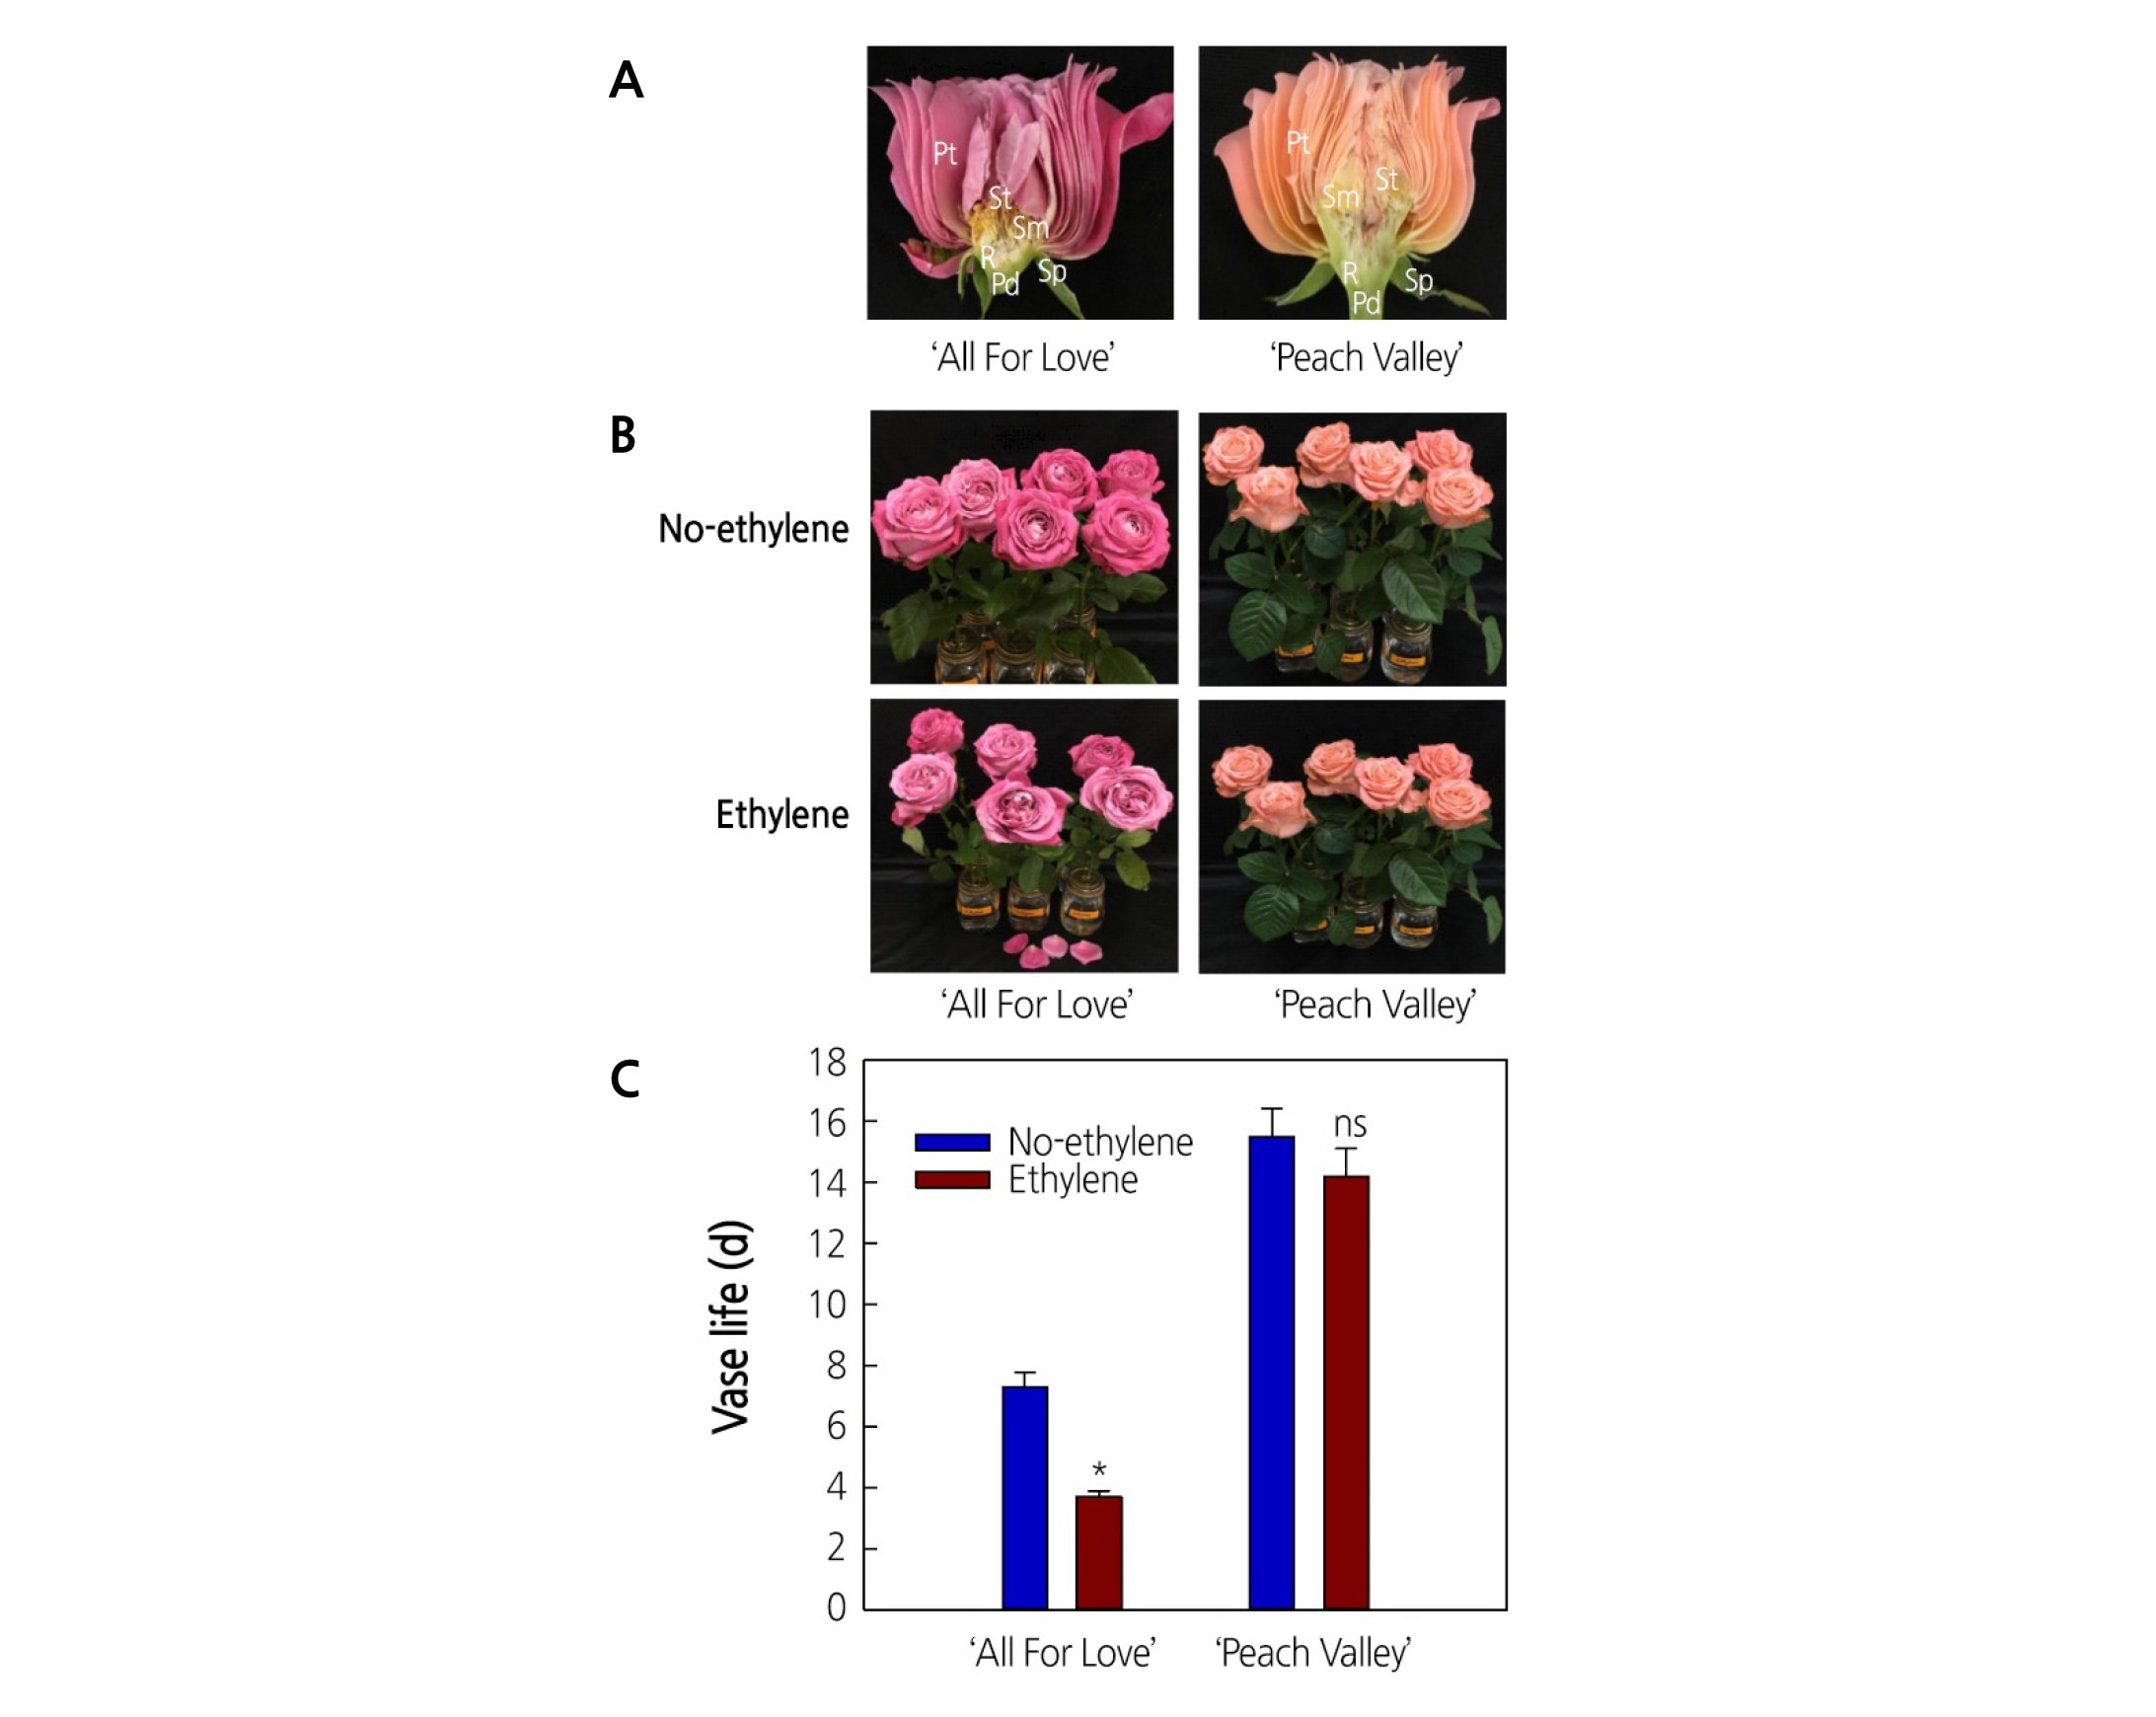
Fig. 1. The longitudinal section of the floral organs (A) and effects of ethylene on flower senescence (B) and vase life (C) of cut roses ‘All For Love’ and ‘Peach Valley’. Pt, petals; St, stigmas; Sm, stamens; R, receptacles; Sp, sepals; Pd, pedicels. Cut flowers were incubated in chambers with air (No-ethylene) or with 10 µL·L-1 ethylene (Ethylene) for 20 h at 25°C. Vertical bars represent standard errors of the means (n = 6). * and ns represent a significant and nonsignificant difference between No-ethylene and Ethylene, determined by Student’s t-test at p ˂ 0.05.
Expression of Ethylene Biosynthesis Genes
Generally, transcript levels of RhACS1-4 and RhACO1 genes were specific to different floral organs and mostly increased after ethylene treatment. Among ethylene biosynthesis genes, the expression of RhACS2 and RhACO1 in floral organs of ‘All For Love’ was higher than that of other isoforms (Fig. 2A). In response to ethylene, the accumulation of RhACS1-4 and RhACO1 transcripts was substantially enhanced in leaves, petals, and stigmas in ‘All For Love’, whereas it was induced in stamens and stigmas in ‘Peach Valley’ (Fig. 2A, B). In the receptacles of both cultivars, ethylene biosynthesis genes were expressed weakly and were not influenced by ethylene. In other organs, the expression of ethylene biosynthesis genes changed slightly in response to ethylene (Fig. 2A, B).
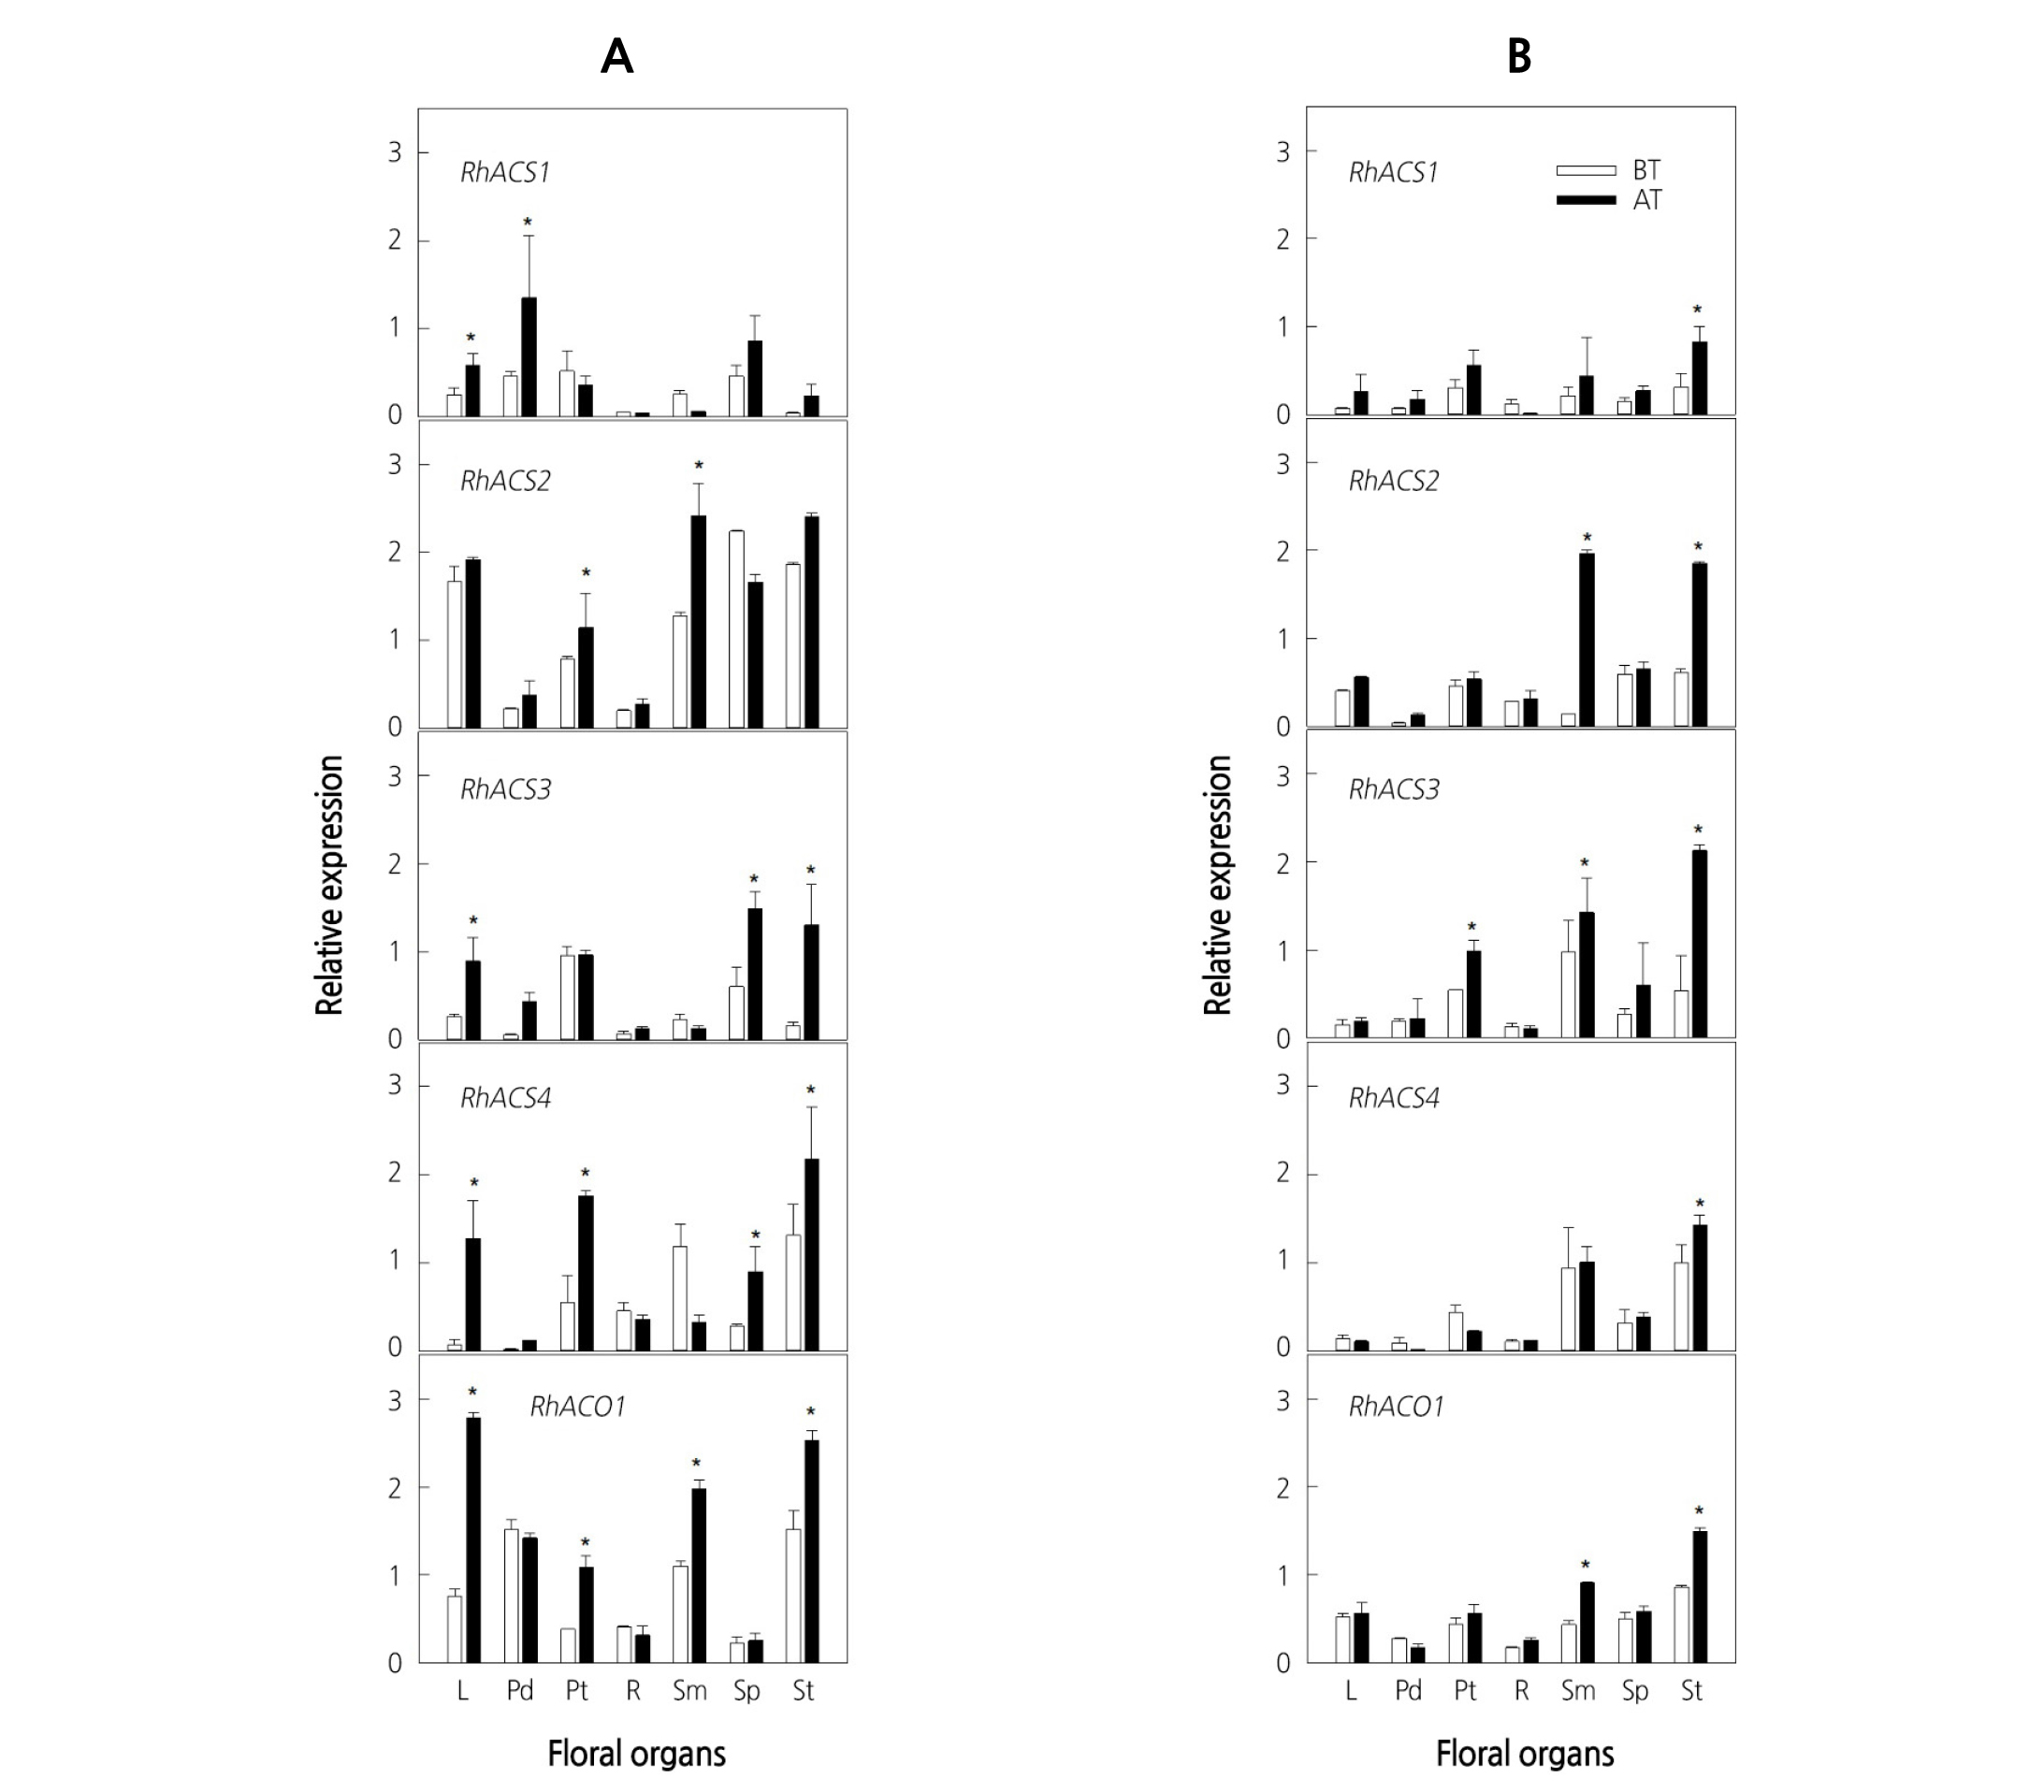
Fig. 2. Expression patterns of ethylene biosynthesis genes in various floral organs of cut roses ‘All For Love’ (A) and ‘Peach Valley’ (B). Cut flowers were incubated in the chamber with 10 µL·L-1 ethylene for 20 h at 25°C. BT, before ethylene treatment; AT, after 20 h of ethylene treatment. L, leaves; Pd, pedicel; Pt, petals; R, receptacle; Sm, stamens; Sp, sepals; St, stigmas. Vertical bars represent standard errors of the means (n = 3). * represents a significant difference between before and after 20 h of ethylene treatment, determined by Student’s t-test at p ˂ 0.05.
Expression of Ethylene Receptor Genes
To identify the role of ethylene receptors in flower senescence induced by ethylene, the expression patterns of five ethylene receptor genes were analyzed in the different floral organs of cut roses. In ‘All For Love’, the expression of ethylene receptor genes was detected in all floral organs; however, the patterns of expression varied for each receptor isoform. While RhETR1, RhETR2, and RhETR4 transcript levels were higher in all floral organs, RhETR3 and RhETR5 genes were expressed weakly in most floral organs, with the exception of the petals, in which expression was high (Fig. 3A). Conversely, in ‘Peach Valley’, five ethylene receptor genes were weakly expressed in all floral organs (Fig. 3B). After exposure to ethylene, RhETR1-5 transcripts were up-regulated consistently in petals and leaves in ‘All For Love’. In contrast, the ethylene-inducible expression of the receptors was observed mostly in the reproductive floral organs, such as stigmas and stamens, in ‘Peach Valley’ (Fig. 3A, B), indicating that the location of initiation of the ethylene response varies depending on the genotype.
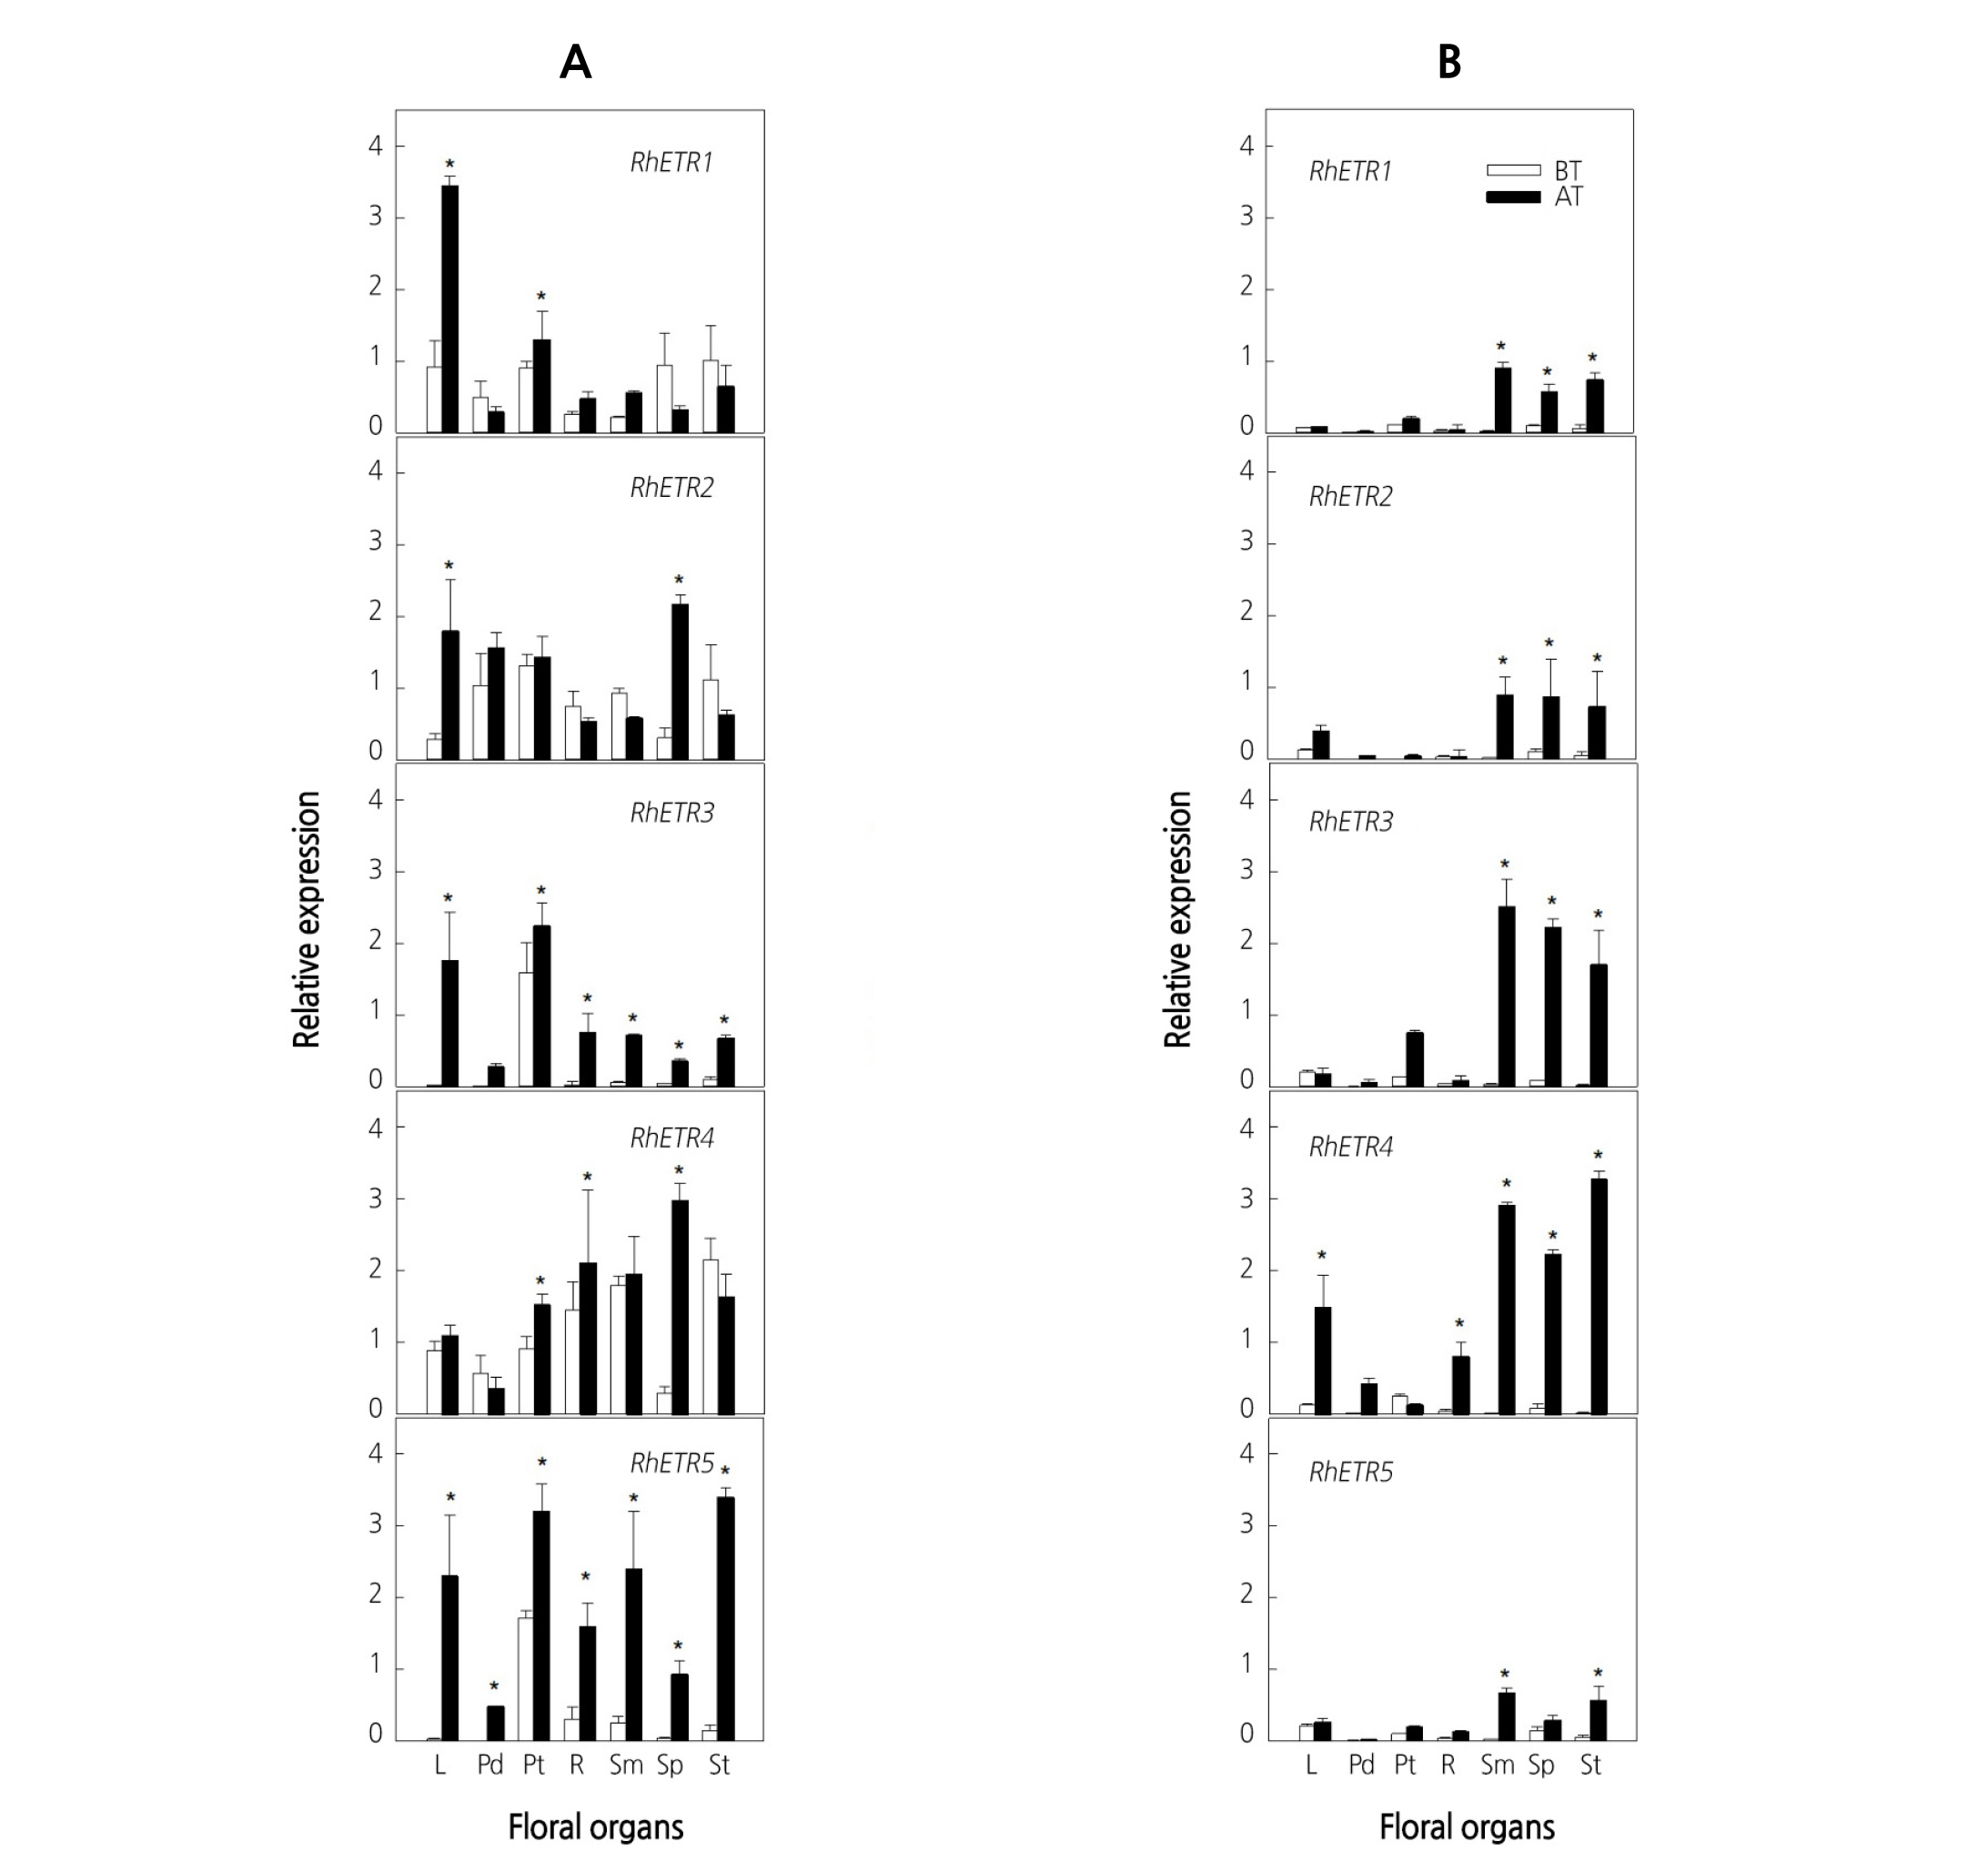
Fig. 3. Expression patterns of ethylene receptor genes in various floral organs of cut roses ‘All For Love’ (A) and ‘Peach Valley’ (B). Cut flowers were incubated in the chamber with 10 µL·L-1 ethylene for 20 h at 25°C. BT, before ethylene treatment; AT, after 20 h of ethylene treatment. L, leaves; Pd, pedicel; Pt, petals; R, receptacle; Sm, stamens; Sp, sepals; St, stigmas. Vertical bars represent standard errors of the means (n = 3). * represents a significant difference between before and after 20 h of ethylene treatment, determined by Student’s t-test at p ˂ 0.05.
Expression of Ethylene Signaling Genes
The expression of the RhCTR1 and RhCTR2 genes, which encode protein kinases involved in ethylene signal transduction, was also investigated in different floral organs of both cultivars. RhCTR1 and RhCTR2 transcripts were detected in all floral organs of the two cultivars (Fig. 4A, B). In ‘All For Love’, the transcript levels of RhCTR1 and RhCTR2 were significantly decreased in leaves and petals in response to ethylene, but increased in pedicel, stigmas, and sepals (Fig. 4A). In contrast, RhEIN3s showed ethylene-inducible expression and was most strongly enhanced in leaves and petals in ‘All For Love’. Similarly, in ‘Peach Valley’, RhCTRs expression was down-regulated and RhEIN3s transcript was up-regulated in stamens and stigmas in response to ethylene (Fig. 4B), indicating an inverse relationship between the ethylene receptors and the CTRs as well as the EINs.
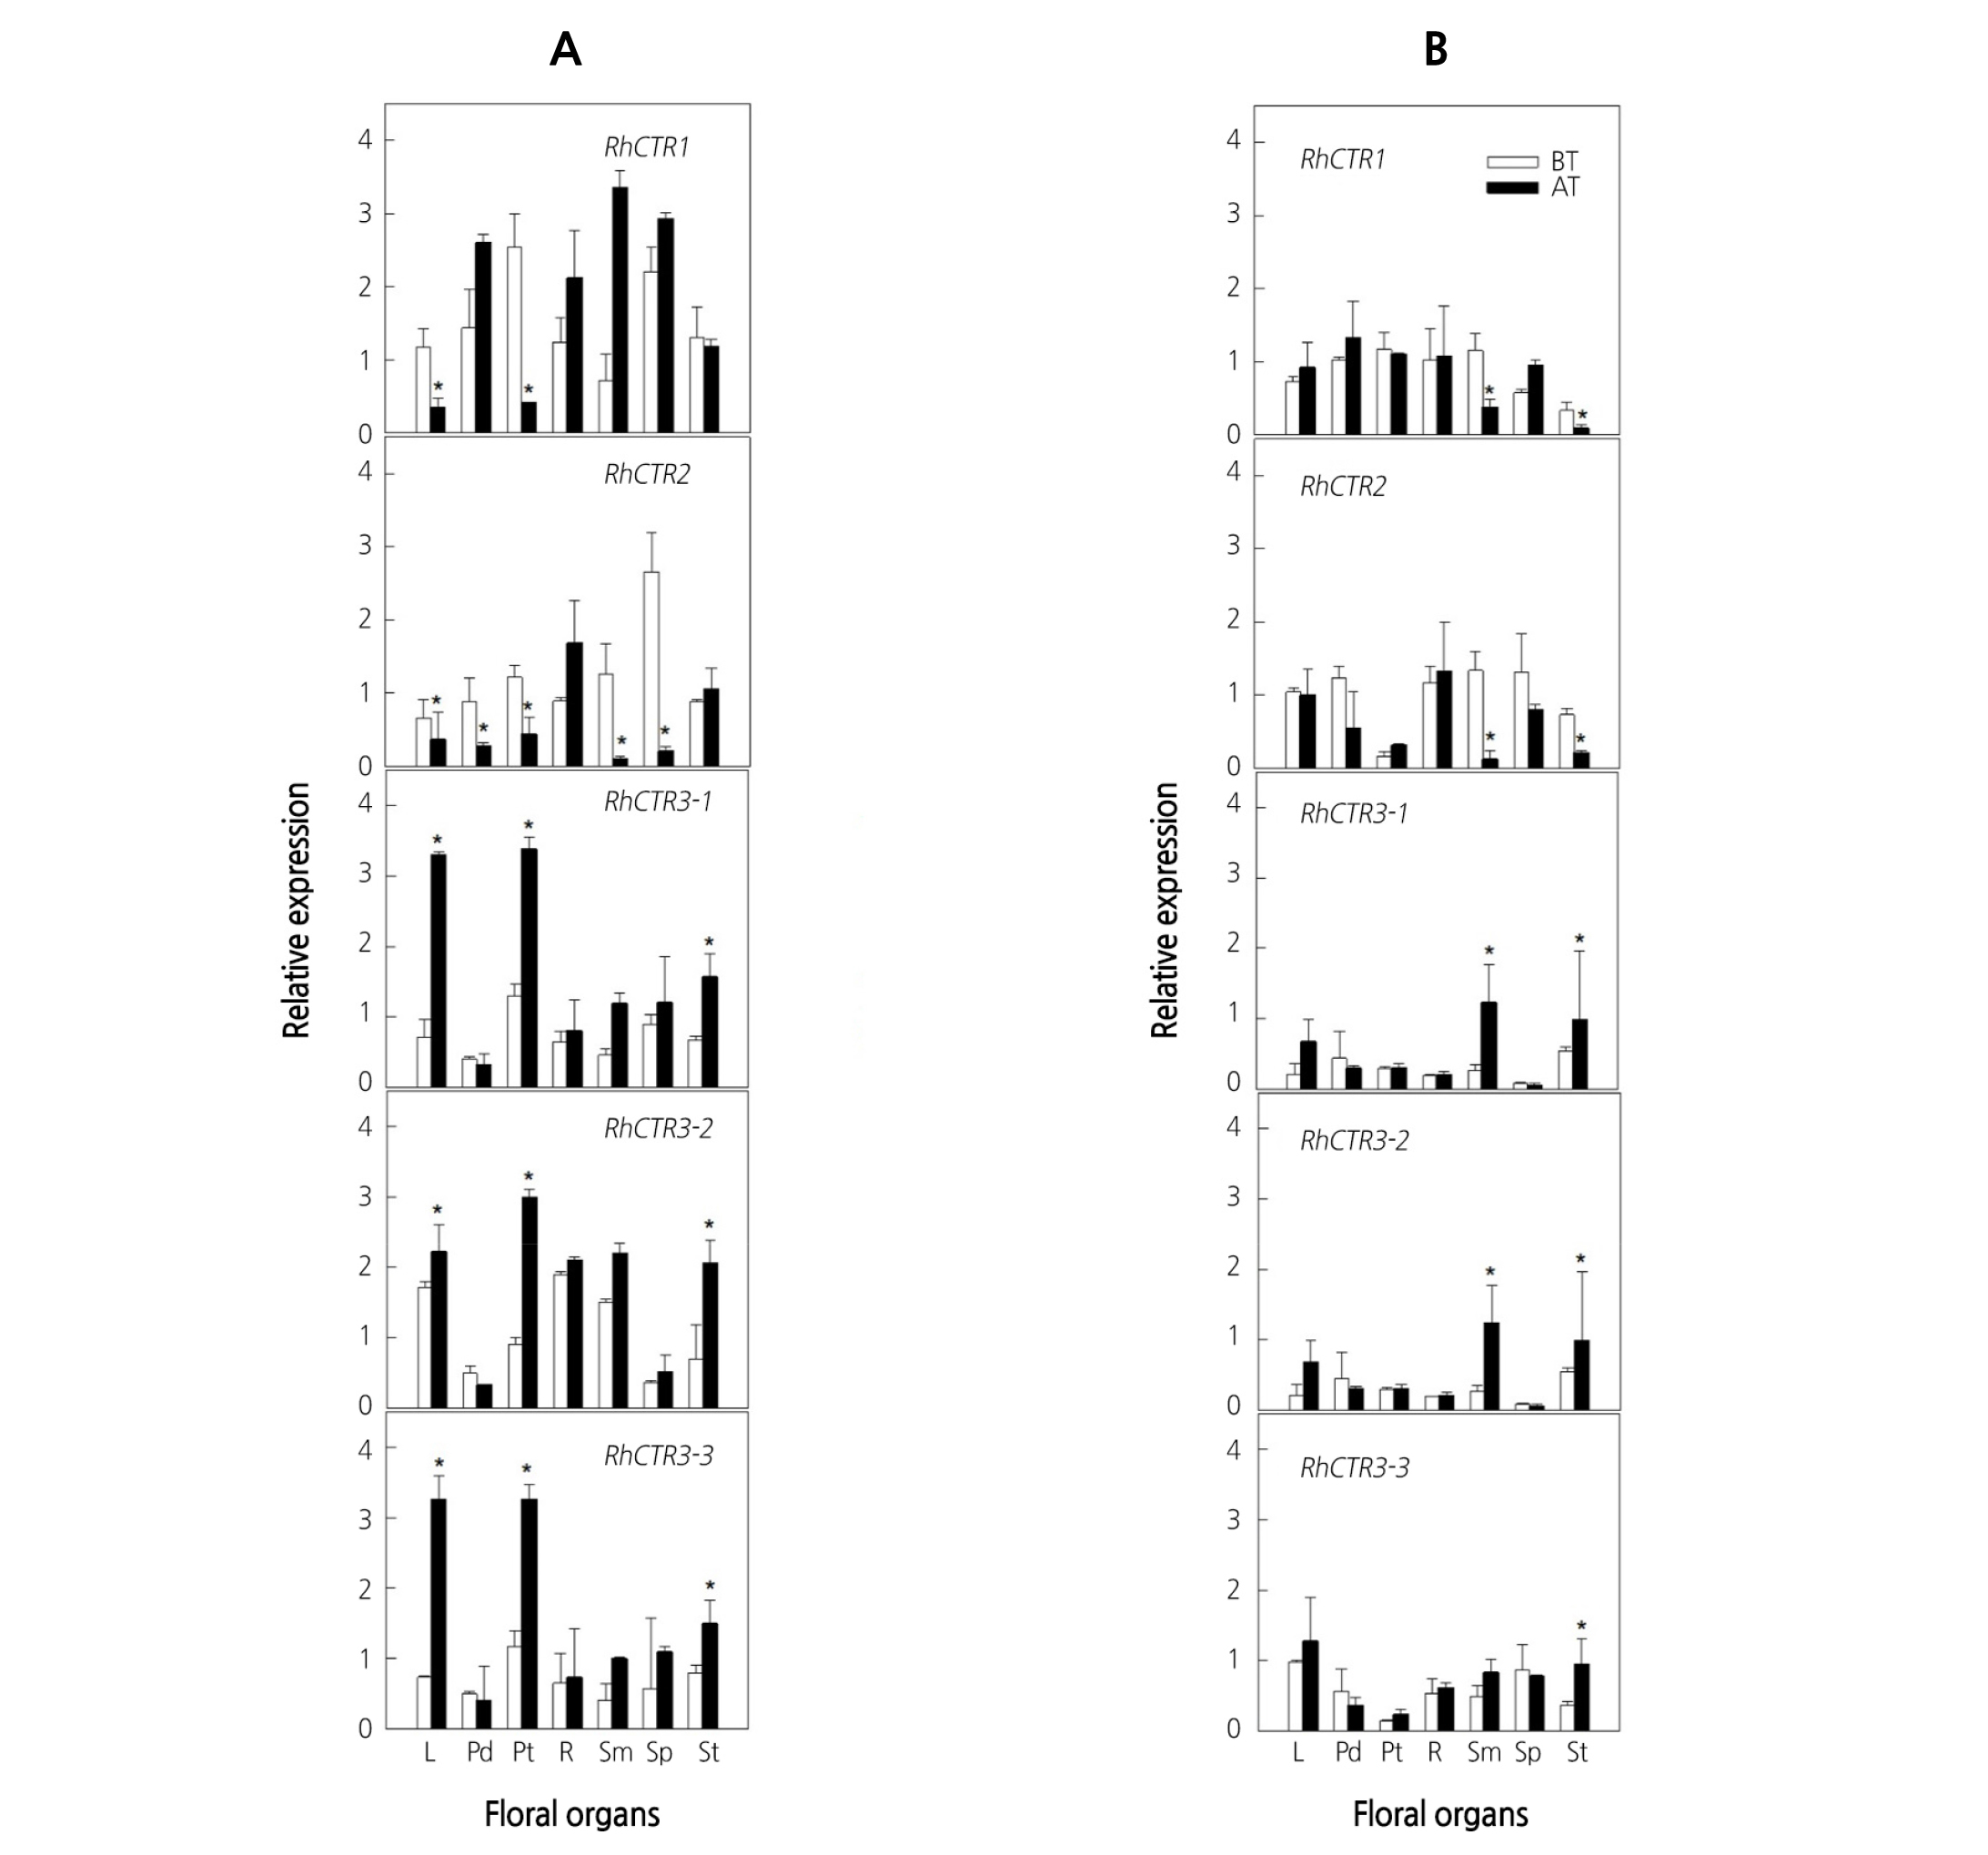
Fig. 4. Expression patterns of ethylene signaling genes in various floral organs of cut roses ‘All For Love’ (A) and ‘Peach Valley’ (B). Cut flowers were incubated in the chamber with 10 µL·L-1 ethylene for 20 h at 25°C. BT, before ethylene treatment; AT, after 20 h of ethylene treatment. L, leaves; Pd, pedicel; Pt, petals; R, receptacle; Sm, stamens; Sp, sepals; St, stigmas. Vertical bars represent standard errors of the means (n = 3). * represents a significant difference between before and after 20 h of ethylene treatment, determined by Student’s t-test at p ˂ 0.05.
Discussion
The pattern of flower senescence varies based on the difference in ethylene sensitivity of the flowers. The ethylene sensitivity in petals is correlated with ethylene synthesis, which is associated with the corresponding increase of endogenous ACC. The synthesis of ACC was translocated from ovary and receptacle to pistil, stamen, and the lower and upper part of the petals within the floral organs (ten Have and Woltering, 1997; Shibuya et al., 2000; Jones, 2003).
The results from this study revealed that, while RhACO1 and RhACS1-4 transcripts were considerably accumulated in SENS petals and leaves following ethylene treatment, the increase in accumulation was greater in INSENS stamens and stigmas. The rapid accumulation of RhACO1 and RhACS1-4 transcripts in the petal and leaf tissues of SENS flowers immediately led to petal abscission and leaf yellowing, resulting in shorter vase life of cut flowers. By contrast, transcript accumulation in the reproductive tissues of INSENS flowers did not induce senescence of flowers and leaves until the late stage of flower development. These results are in concordance with those observed in other plants, such as orchids and petunia, where petal senescence coincided with ACS and ACO transcript accumulation in petal tissues (Singh et al., 1992; O'Neill et al., 1993; O'Neill, 1997).
Transcript levels of ethylene receptor genes are generally higher in reproductive organs in many plant species, such as Arabidopsis, roses, rice, and tobacco (Sakai et al., 1998; Tieman and Klee, 1999; Zhang et al., 2001; Yau et al., 2004; Xue et al., 2008). In roses, expression of the receptor genes (RhETR1-5) differed among floral organs and was closely related with the ethylene sensitivity of the cultivars. An increase in the receptor transcripts in petals and leaves of SENS flowers coincided with increased ethylene synthesis, followed by petal senescence. In contrast, the accumulation of the receptor transcripts in the reproductive organs of INSENS flowers did not lead to ethylene synthesis in the plant tissues. These results may imply that ethylene sensitivity of rose varieties is determined by the accumulation of RhACS1-4 and RhACO1 in petals. This hypothesis is supported by the observation that ACS and ACO transcript accumulation in petals is an essential requirement for increase in ethylene sensitivity and subsequent flower senescence (Mor et al., 1985; Overbeek and Woltering, 1990; ten Have and Woltering, 1997; In et al., 2013). Similarly, previous works have shown that the expression of ethylene receptors is ethylene inducible and up-regulated during flower senescence (Vriezen et al., 1997; Kuroda et al., 2003; Narumi et al., 2005; Ma et al., 2006; Mutui et al., 2007).
The ethylene-inducible increase in ethylene receptor transcripts led to a decrease in the transcript of RhCTRs, which is a direct downstream target of the receptors and functions as a negative regulator in ethylene signaling (Kieber et al., 1993; Gao et al., 2003; Huang et al., 2003). The qRT-PCR analysis showed that the decrease in RhCTRs transcripts coincided with the induction of the transcription factors RhEIN3s in the leaves and petals of SENS flowers and in the stamens and stigmas of INSENS flowers after ethylene treatment.
Overall, this study revealed that the expression patterns of ethylene-related genes in various floral organs were different and depended on ethylene sensitivity of the flower cultivars. It has generally been considered that ethylene is synthesized in all floral organs, but the initiation of petal senescence depends on the responsiveness of the organs to ethylene. Importantly, it has been shown that the variation in ethylene sensitivity in flower cultivars is probably regulated by the transcriptional accumulation of the ethylene receptors and synthesis genes in petals and perhaps in leaves.
