

Introduction
Materials and Methods
Plant materials and growth condition
Nitrogen deficiency treatment
Growth parameter measurements
Image acquisition and analysis
Model building and validation
Statistical analysis
Results and Discussion
Growth of kimchi cabbage seedling under nitrogen deficiency
Performance of the regression model on estimations of the leaf area
Performance of vegetation indices for detecting nitrogen deficiency
Conclusions
Introduction
Seedling production refers to the process of raising high-quality seedlings suitable for transplanting within a specific time frame (RDA 2008). Although the seedling stage is shorter than the cultivation period after transplanting, it requires precise regulation of environmental conditions, nutrient and water supply levels, and pest management to ensure optimal seedling growth and quality. During this stage, various cultivation and environmental factors, such as salinity, the composition of the growth medium, nutrient availability, and irrigation, can adversely affect seedling growth and lead to physiological disorders (Hannachi and Van Labeke 2018; Wang et al. 2022a; Farjana et al. 2023). Moreover, seedling growth and quality significantly influence subsequent crop growth and yield after transplanting (Yan et al. 2019). Therefore, the production of high-quality seedlings requires the integration of appropriate environmental control strategies and cultivation techniques.
Kimchi cabbage (Brassica rapa subsp. pekinensis) is one of the most economically and agronomically important vegetable crops in Korea. In 2023, the total cultivation area reached 26,787 ha, with annual production of 1,958,500 tons (KOSIS 2025). Based on the standard transplanting density (RDA 2021), approximately 1.07 billion seedlings are required for its cultivation, highlighting the crop’s significance in Korean nursery production systems. Unlike other fruit vegetables that are often cultivated in greenhouses, kimchi cabbage is typically grown in open fields after transplanting, which makes it more vulnerable to suboptimal environmental conditions. Consequently, more robust and healthy seedlings at the time of transplanting are better equipped to tolerate both abiotic and biotic types of stress and to maintain stable growth under field conditions.
Nitrogen is a critical nutrient for plant growth and development, as it is a key component of amino acids, nucleotides, and chlorophyll. Leaf nitrogen content levels are closely associated with the photosynthetic capacity of plants due to the involvement of nitrogen in the Calvin cycle and thylakoid proteins (Evans 1989). Numerous studies have demonstrated that plant responses to nitrogen vary depending on the crop and application rate. In leafy vegetables, including kimchi cabbage, growth tends to increase with the nitrate supply but declines when nitrogen exceeds optimal levels (Chen et al. 2004). Cao et al. (2023) also reported that yields increased with the application of nitrogen but showed no further increase once crop nitrogen requirements were met. In contrast, nitrogen deficiency reduces plant growth, induces chlorosis, and lowers chlorophyll content levels (Wei et al. 2015). Thi Nong et al. (2020) also found that nitrogen-deficient rice seedlings negatively affected vegetative growth after transplanting.
In the vegetable production industry, there is increasing demand for non-destructive methods to monitor crop status and growth dynamics over time and in different spaces. Image-based phenotyping technologies such as RGB imaging, chlorophyll fluorescence, hyperspectral and multispectral imaging, and thermal imaging have been used to detect various physiological traits (Humplík et al. 2015). Among these, multispectral imaging has particularly attracted attention due to its balance between resolution, cost, and ease of application (Li et al. 2020). Multispectral imaging has been applied to detect plant growth, disease symptoms, nutrient status, and responses to stressors such as drought or salinity (Albetis et al. 2017; Lazarević et al. 2021; Peng et al. 2022). The application of this modality in nitrogen status monitoring has primarily been explored in relation to wheat and rice, often through aerial platforms in open fields (Lu et al. 2019; Wang et al. 2022b). Sun et al. (2019) predicted nitrogen, phosphorus, and potassium contents in tomato plants using multispectral 3D imaging, but their approach was based on individual plants during the growth stage after transplanting. Most image-based studies have focused on individual-level assessments. However, in commercial nurseries, seedlings are produced in plug trays. Therefore, to enhance the field applicability of image-based monitoring, it is essential to develop techniques capable of evaluating seedling responses to nutrient stress at the plug tray level. Accordingly, the objective of this study is to evaluate the feasibility of multispectral image analysis for the monitoring of the growth and nitrogen deficiency levels of kimchi cabbage seedlings at the plug tray level.
Materials and Methods
Plant materials and growth condition
The experiment was conducted in a greenhouse at the University of Seoul (37°34'57.1" N, 127°03'37.7" E). The plant material was the kimchi cabbage (Brassica rapa L. ssp. pekinensis) cultivar ‘Odae’ (The Kiban Co., Ltd., Anseong, Gyeonggi-do, Republic of Korea). Seeds were sown in 128-cell plug trays filled with a commercial medium (Biosangto; Nongwoo Bio Co., Ltd., Incheon, Gyeonggi-do, Republic of Korea) and cultivated from July 4 to August 3, 2023. Seedlings were sub-irrigated daily with tap water until 7 DAS, prior to the initiation of the nitrogen deficiency treatments. Environmental data in the greenhouse were automatically logged at 5-minute intervals using an agricultural environmental monitoring system (aM-31; WISE Sensing Inc., Yongin, Gyeonggi-do, Republic of Korea). During the experimental period, the average daytime and nighttime air temperatures were 30.8 and 27.7°C, respectively, and the average daily cumulative solar radiation was 4.1 MJ·m‒2.
Nitrogen deficiency treatment
Nutrient solutions with varying nitrogen concentrations were prepared based on the standard formulation for kimchi cabbage seedling production recommended by the Rural Development Administration (RDA) of the Republic of Korea (Lee et al. 2000). The N40, N80, and N100 treatments contained 40, 80, and 100% of the nitrogen concentration (8.0 me·L‒1) in the standard nutrient solution, respectively, whereas the N0 treatment consisted of tap water without any added inorganic nutrients. The seedlings were sub-irrigated with nutrient solutions containing different nitrogen concentrations from 7 DAS until the end of the experiment, with the solution pH maintained at 6.2–6.3.
Growth parameter measurements
Growth parameters, in this case the number of leaves, SPAD value, leaf area, and shoot fresh and dry weights, were measured at 10, 15, 20, 25, and 30 DAS. The leaf area and SPAD values were obtained using a leaf area meter (LI-3100; LI-COR Inc., Lincoln, NE, USA) and a chlorophyll meter (SPAD-502PLUS; Konica Minolta Inc., Tokyo, Japan), respectively. The shoot fresh weight and dry weights (SDW) were measured using an electronic scale (Kern EWJ 300-3; Kern & Sohn GmbH, Balingen, Germany), with the shoot dry weight determined after oven-drying at 70°C for seven days. The leaf area index (LAI) was calculated by dividing the leaf area of a seedling by the area of one plug tray cell (13.6 cm2), and the specific leaf weight (SLW) was calculated as the ratio of the shoot dry weight to the leaf area.
Image acquisition and analysis
Seedling images were acquired using a Plant Image Measurement System (PIMS), which consisted of a light-shielded imaging chamber equipped with LED lighting and a multispectral camera (FS-3200T-10GE-NNC; JAI, Copenhagen, Denmark). The LED lighting covered a wavelength range of 400–1,000 nm, enabling image acquisition in both the visible (VIS) and near-infrared (NIR) regions. The multispectral camera, with a resolution of 2,048 × 1,536 pixels, was mounted at the top of the chamber, approximately 1.2 m above the surface of the plug tray. Top-view images were acquired at five spectral bands: blue (450 nm), green (550 nm), red (650 nm), NIR1 (750 nm), and NIR2 (830 nm).
Multispectral images of the seedlings and plug trays were acquired prior to the destructive measurements of growth parameters at 10, 15, 20, 25, and 30 DAS. Image data were calibrated using a standard spectral reflectance reference bar. The image analysis was conducted with ENVI software (ENVI 5.3; L3Harris Geospatial, Broomfield, CO, USA) (Fig. 1). Leaf area within both the seedling and plug tray units was predicted from the multispectral images. Spectral reflectance at each wavelength was extracted to analyze changes in seedling characteristics in response to nitrogen deficiency. The vegetation indices used in this study were calculated based on spectral reflectance and analyzed to evaluate the potential for non-destructive assessments of seedling growth responses to deficient nitrogen conditions. The vegetation indices used in this study are presented in Table 1.
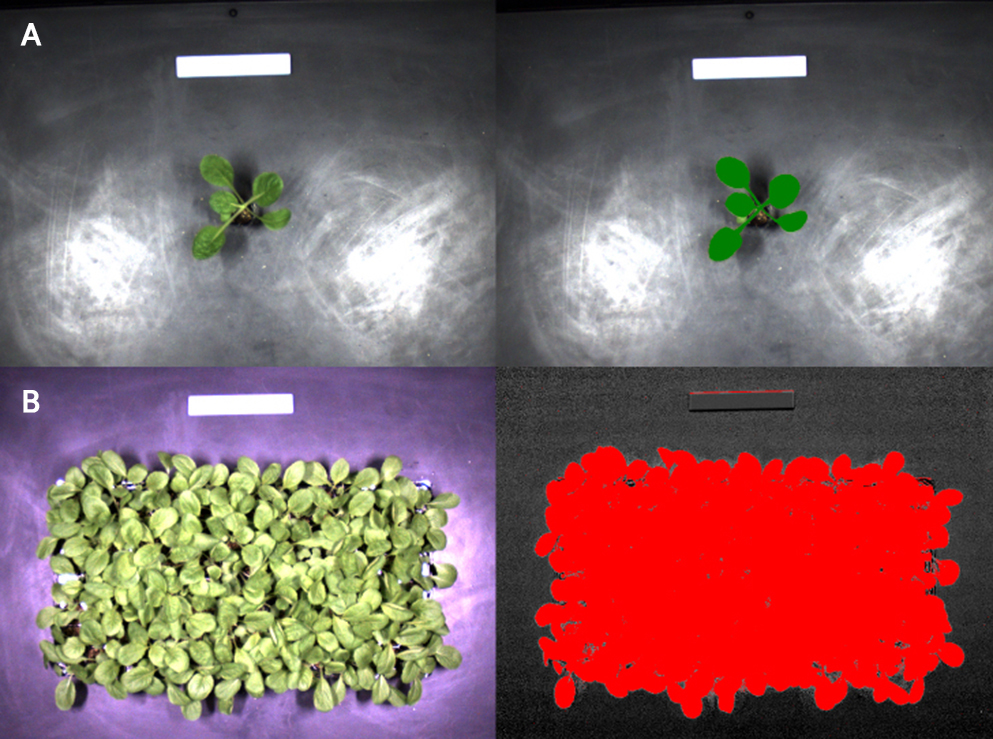
Table 1.
Vegetation indices evaluated in this study. R denotes spectral reflectance at the specified wavelengths, and RNIR represents the average of R750 and R830
| Index | Equation | Reference |
| Normalized Difference Vegetation Index (NDVI) | Rouse et al. (1974) | |
| Green Normalized Difference Vegetation Index (GNDVI) | Gitelson et al. (1996) | |
| Green Chlorophyll Index (CIgreen) | Gitelson et al. (2003, 2005) | |
| Triangle Vegetation Index (TVI) | Broge and Leblanc (2001) | |
| Modified Red Edge Normalized Difference Vegetation Index (mrNDVI) | Sims and Gamon (2002) | |
| Renormalized Difference Vegetation Index (RDVI) | Roujean and Breon (1995) |
Model building and validation
Simple linear regression (SLR) is a statistical method that explains a single dependent variable with a single independent variable. The relationships between the measured and predicted leaf area outcomes were determined based on a regression analysis with RStudio software (version 4.5.0; RStudio Desktop, Boston, MA, USA). The SLR model is expressed as
where is the measured leaf area, is the predicted leaf area obtained from the image analysis, is the regression coefficient, is the intercept, and 𝜀 represents the residual error term.
The data were randomly divided into a training set (70%) and a test set (30%). To ensure the robustness and reliability of the model, 5-fold cross-validation (CV) was performed within the training dataset, in which the data were split into five folds for iterative training and validation. The test set was subsequently used to evaluate the performance of the model independently. Model performance outcomes were assessed based on the coefficient of determination (R2), the root mean square error (RMSE), and the relative root mean square error (RRMSE).
In these equations, denotes the number of samples, is the measured value, is the estimated value by the regression model, and is the mean of measured values.
Statistical analysis
The effects of the treatments on the growth parameters were analyzed using SAS statistical software (version 9.4; Enterprise Guide 8.3; SAS Institute Inc., Cary, NC, USA) with Duncan’s multiple range test at p < 0.05. The linear regression analysis conducted here relied on Microsoft® Excel® (Microsoft 365 MSO Version 16.0.16501.20074; Redmond, WA, USA) to determine the correlations between the vegetation indices and growth parameters at specific time points. Pearson’s correlation analysis was performed using RStudio software (version 4.5.0; RStudio Desktop, Boston, MA, USA) to assess the relationships between the vegetation indices and growth parameters over the entire experimental period.
Results and Discussion
Growth of kimchi cabbage seedling under nitrogen deficiency
The changes in the growth of kimchi cabbage seedlings in the seedling and plug tray units under different nitrogen deficiency conditions are presented in Fig. 2. Seedling growth was significantly affected by nitrogen deficiency throughout the cultivation period, and the effects became particularly pronounced in the growth parameters from 20 DAS (Fig. 3). The seedlings in the N100 and N80 treatments exhibited statistically similar growth after 20 DAS, both showing greater growth than those in the N40 and N0 treatments. In the N0 treatment, seedling growth stagnated after 20 DAS, whereas in the other treatments, growth continued to increase until the end of the experiment. Leaf area decreased significantly as nitrogen deficiency became more severe during the cultivation period. The leaf area of the seedlings in the N100 and N80 treatments was approximately four times greater than that in the N0 treatment.
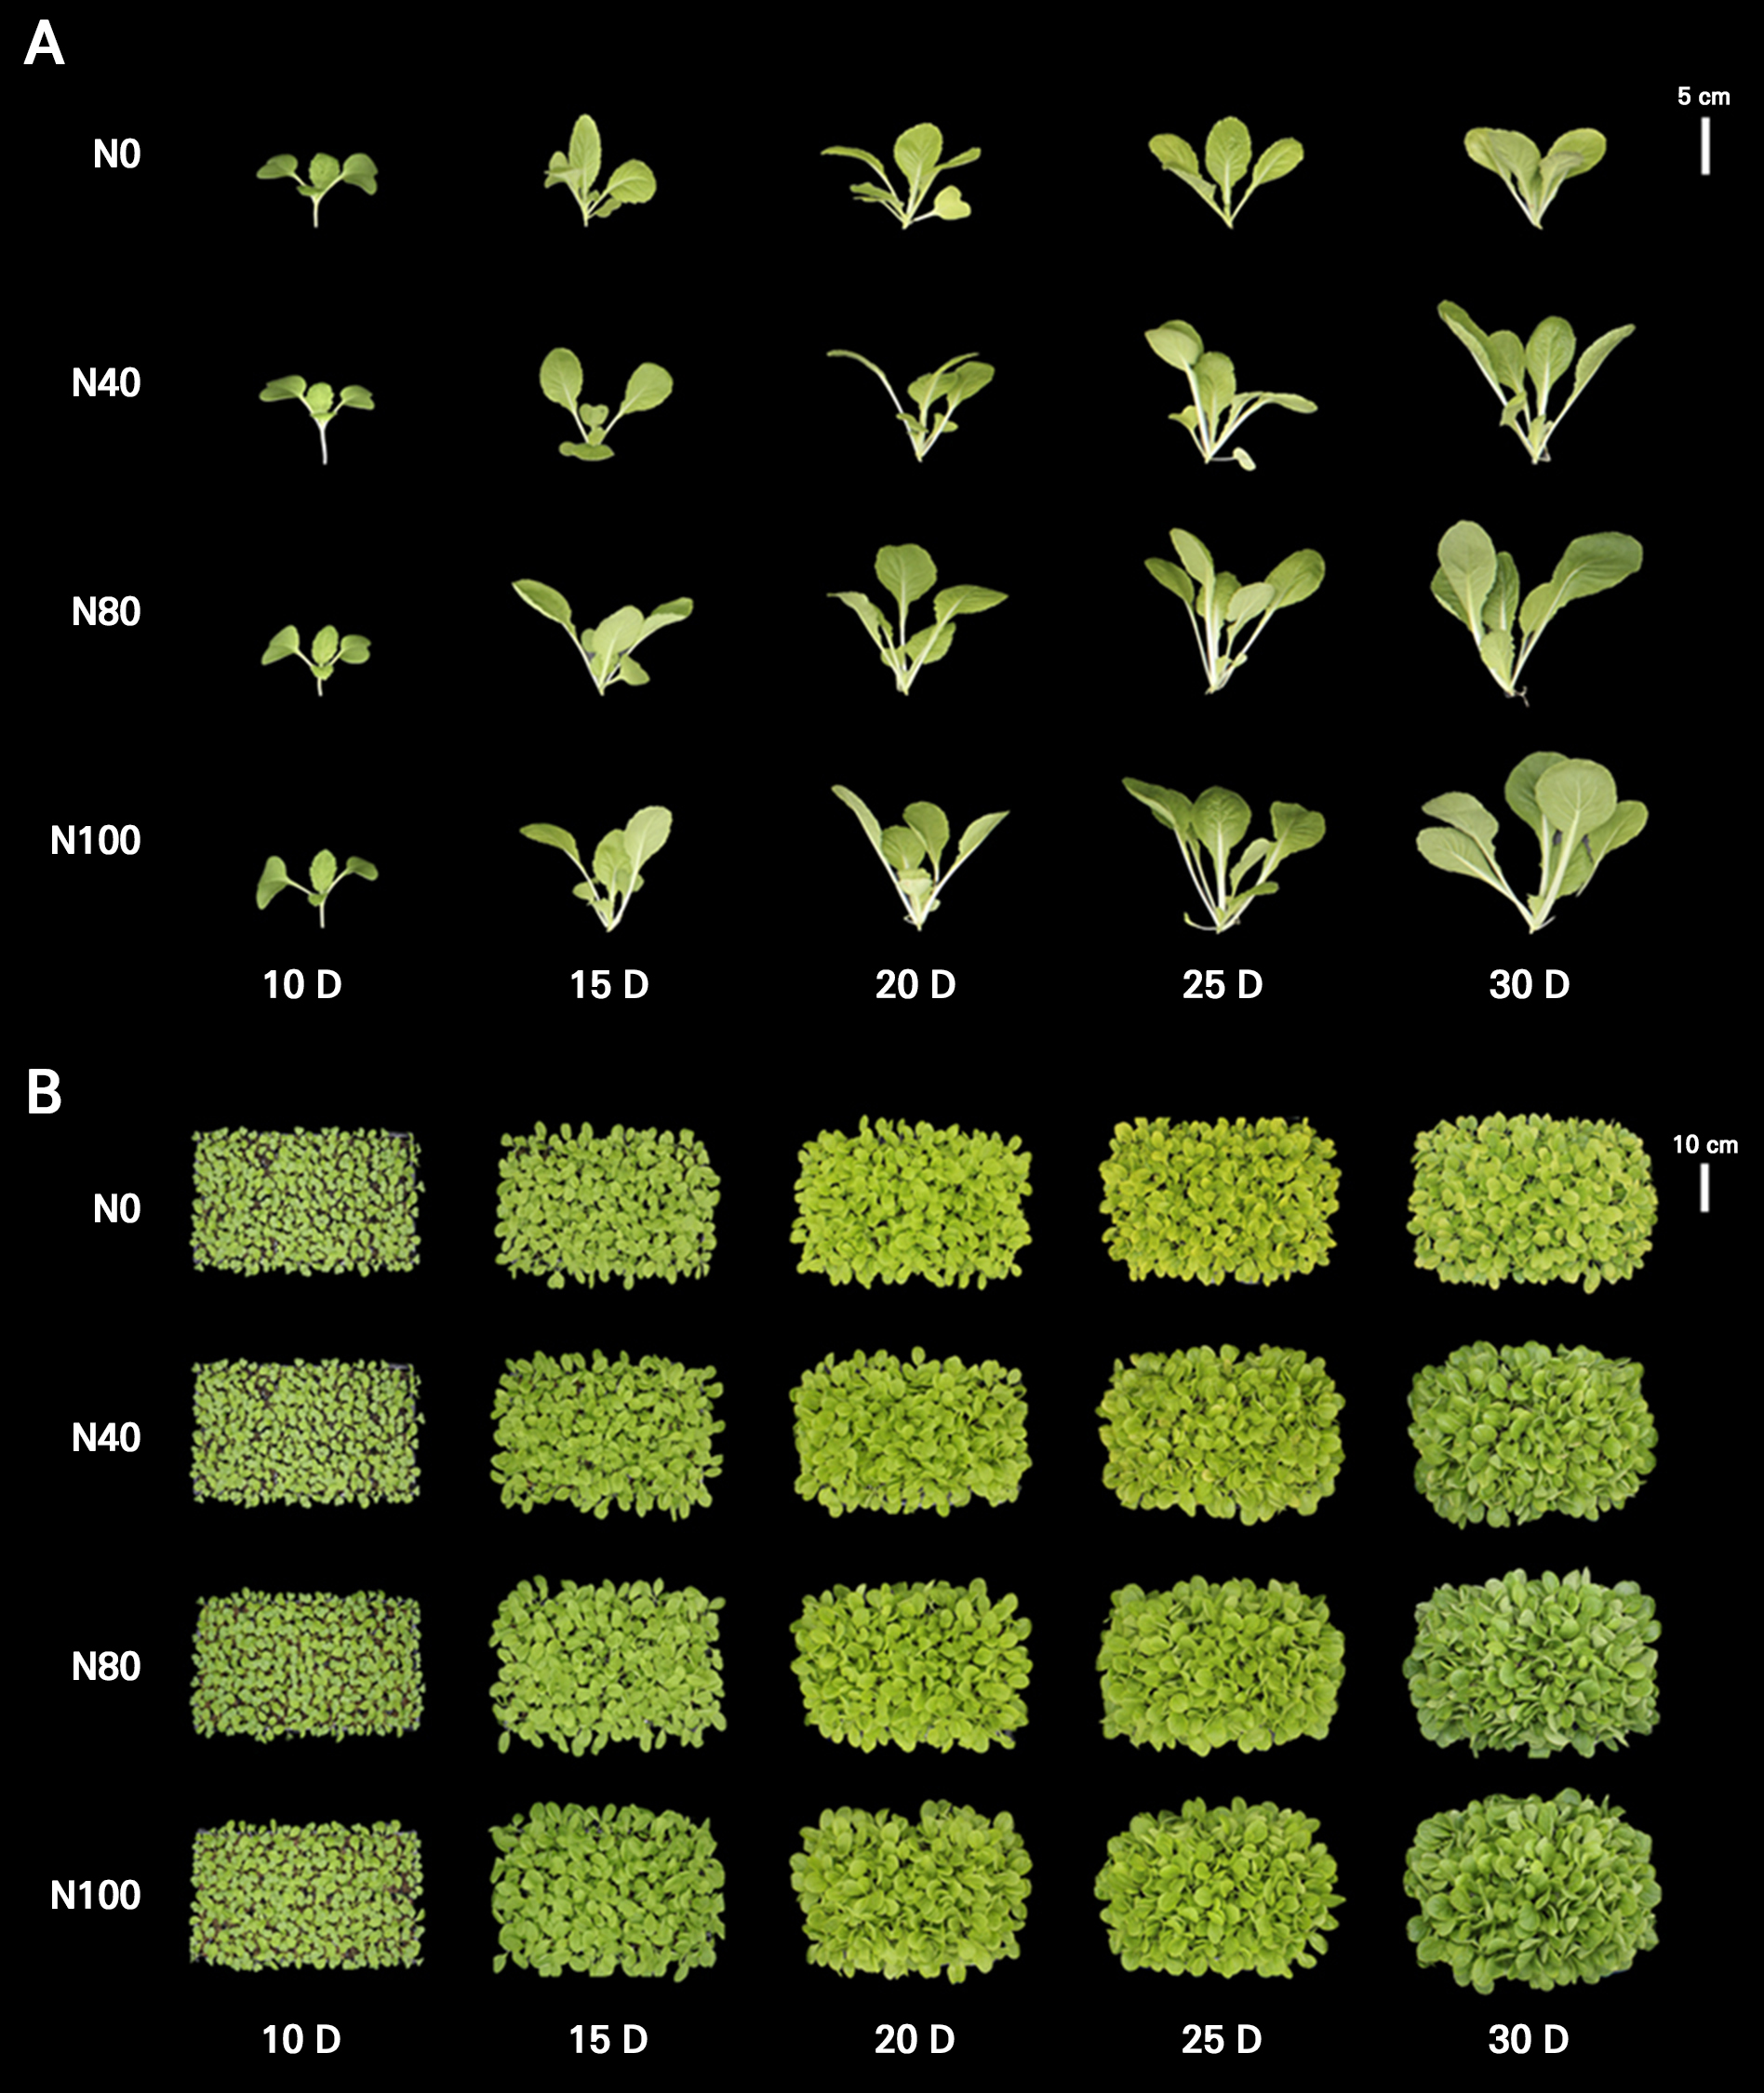
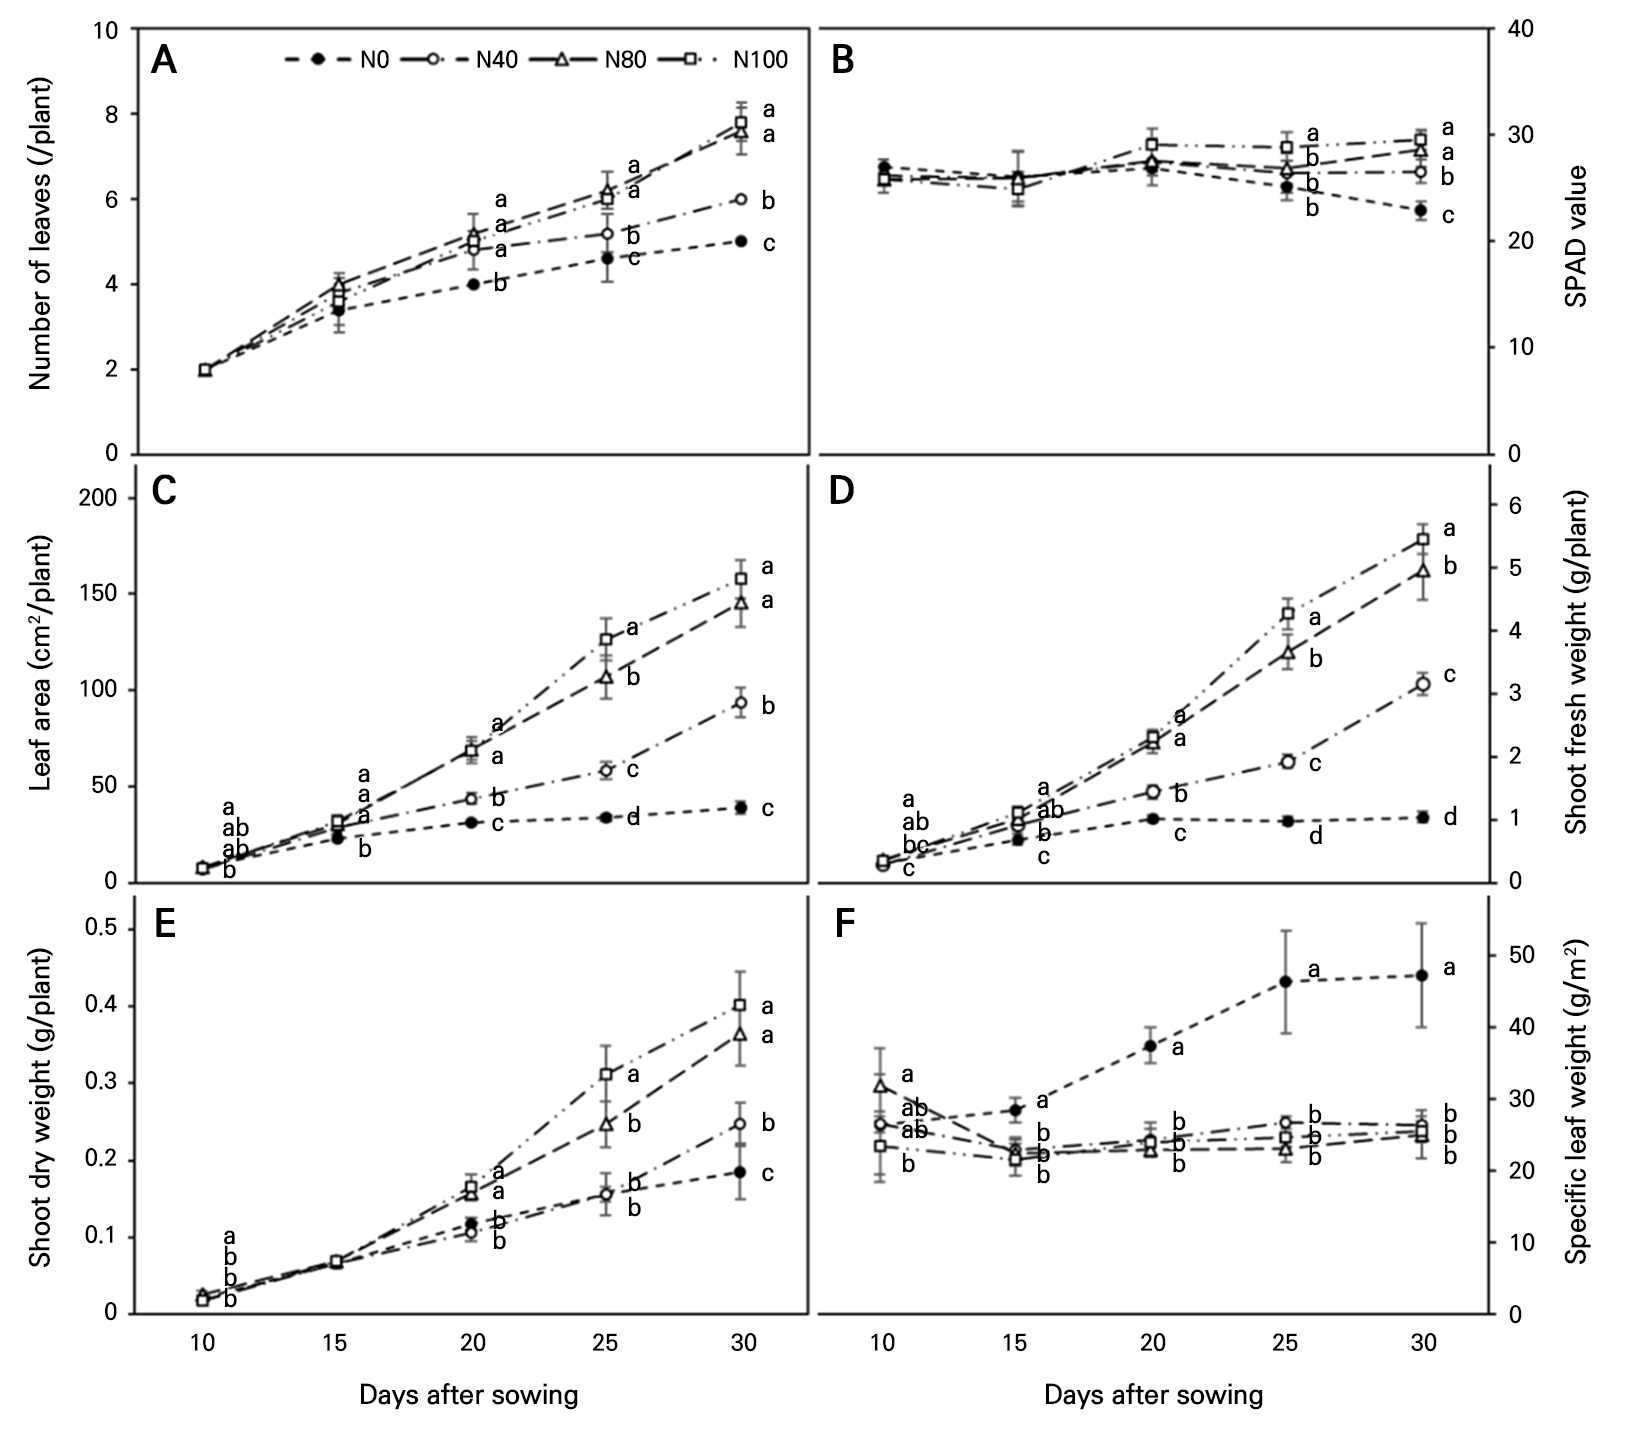
Fig. 3.
Changes in growth parameters of kimchi cabbage ‘Odae’ seedlings under different nitrogen treatments at 10, 15, 20, 25, and 30 DAS: number of leaves (A), SPAD value (B), leaf area (C), shoot fresh weight (D), shoot dry weight (E), and specific leaf weight (F). Vertical bars represent the standard deviation (SD; n = 5). Different letters indicate significant differences among the treatments within each measurement date according to Duncan’s multiple range test (p < 0.05).
These results are consistent with previous studies reporting that seedling growth parameters decline with decreasing nitrogen concentrations in the nutrient solution (Al-Harbi et al. 2008). For example, Schultheis and Dufault (1994) found that watermelon seedlings exhibited reductions in plant height, number of leaves, leaf area, and both the shoot and root dry weights as the nitrogen concentration was decreased. Similarly, Melton and Dufault (1991) reported that reduced nitrogen levels led to decreased growth of tomato seedlings and lower marketable yields after transplanting. However, when the nitrogen concentration exceeded a certain threshold, no significant differences in seedling growth were observed. In the present study, a similar trend was observed, as the N80 and N100 treatments did not show significant differences at certain time points or for some growth parameters.
Chlorophyll meters such as the SPAD-502 provide a quick and non-destructive measurement of the chlorophyll concentration in leaves (Netto et al. 2005). The SPAD value is calculated based on the difference in light transmission at 650 nm and 940 nm (Xiong et al. 2015), and this value has been shown to correlate positively with the chlorophyll content (Shah et al. 2017). Given that the leaf chlorophyll content is positively correlated with the nitrogen supply (Mu et al. 2016) and leaf nitrogen content (Padilla et al. 2018), SPAD values can serve as a reliable indicator for estimating the nitrogen status of leaves (Rhezali and Aissaoui 2021). In this study, we estimated the leaf nitrogen content using SPAD values rather than analytical methods. SPAD values decreased significantly as the nitrogen supply decreased, and this tendency was particularly pronounced in the later stages of the cultivation period. Similar positive correlations between SPAD values and leaf nitrogen content levels have been reported in rice (Hou et al. 2021), sweet pepper (De Souza et al. 2019), and tomato and pepper (Fidler et al. 2025). These consistent results suggest that SPAD values accurately reflect changes in the leaf chlorophyll content in response to a decreasing nitrogen supply.
Specific leaf weight (SLW), a physiological indicator of leaf thickness, is defined as the dry weight per unit leaf area and is generally greater when measuring thicker leaves (Amanullah 2015). Nitrogen availability plays a critical role in determining SLW by regulating leaf expansion and dry matter accumulation (Grindlay 1997). Under nitrogen-deficient conditions, leaf expansion is limited, while starch and structural compounds such as cellulose and lignin accumulate (McDonald et al. 1986). Hu et al. (2025) reported increased cell wall and spongy tissue thickness in oilseed rape under low nitrogen condition. Similarly, SLW and leaf thickness values have been found to increase in rice under nitrogen-deficient conditions in both paddy fields (Jinwen et al. 2009) and pot conditions (Liu and Li 2016). These findings are consistent with those in the present study, where the highest SLW was observed under the N0 treatment.
Performance of the regression model on estimations of the leaf area
The relationship between the measured leaf area and predicted leaf area as derived from multispectral image data is illustrated in Fig. 4. The regression model for seedling unit closely approximated the 1:1 line (Fig. 4A). A strong relationship was also observed between the estimated and measured leaf area at the plug tray level (Fig. 4B). These results indicate that the predicted leaf area derived from multispectral imaging reliably reflects changes in the actual leaf area under nitrogen-deficient conditions. The SLR model showed high accuracy in both the training dataset and independent test dataset (Table 2). The coefficients of determination (R2) for test data at the seedling and plug tray level were 0.97 and 0.92, respectively. At the individual seedling level, the RRMSE was 12.45%, whereas at the plug tray level, the RRMSE increased to 18.44%. This difference is attributable to the greater variability in the leaf area due to overlapping leaves and vertical growth within the trays.
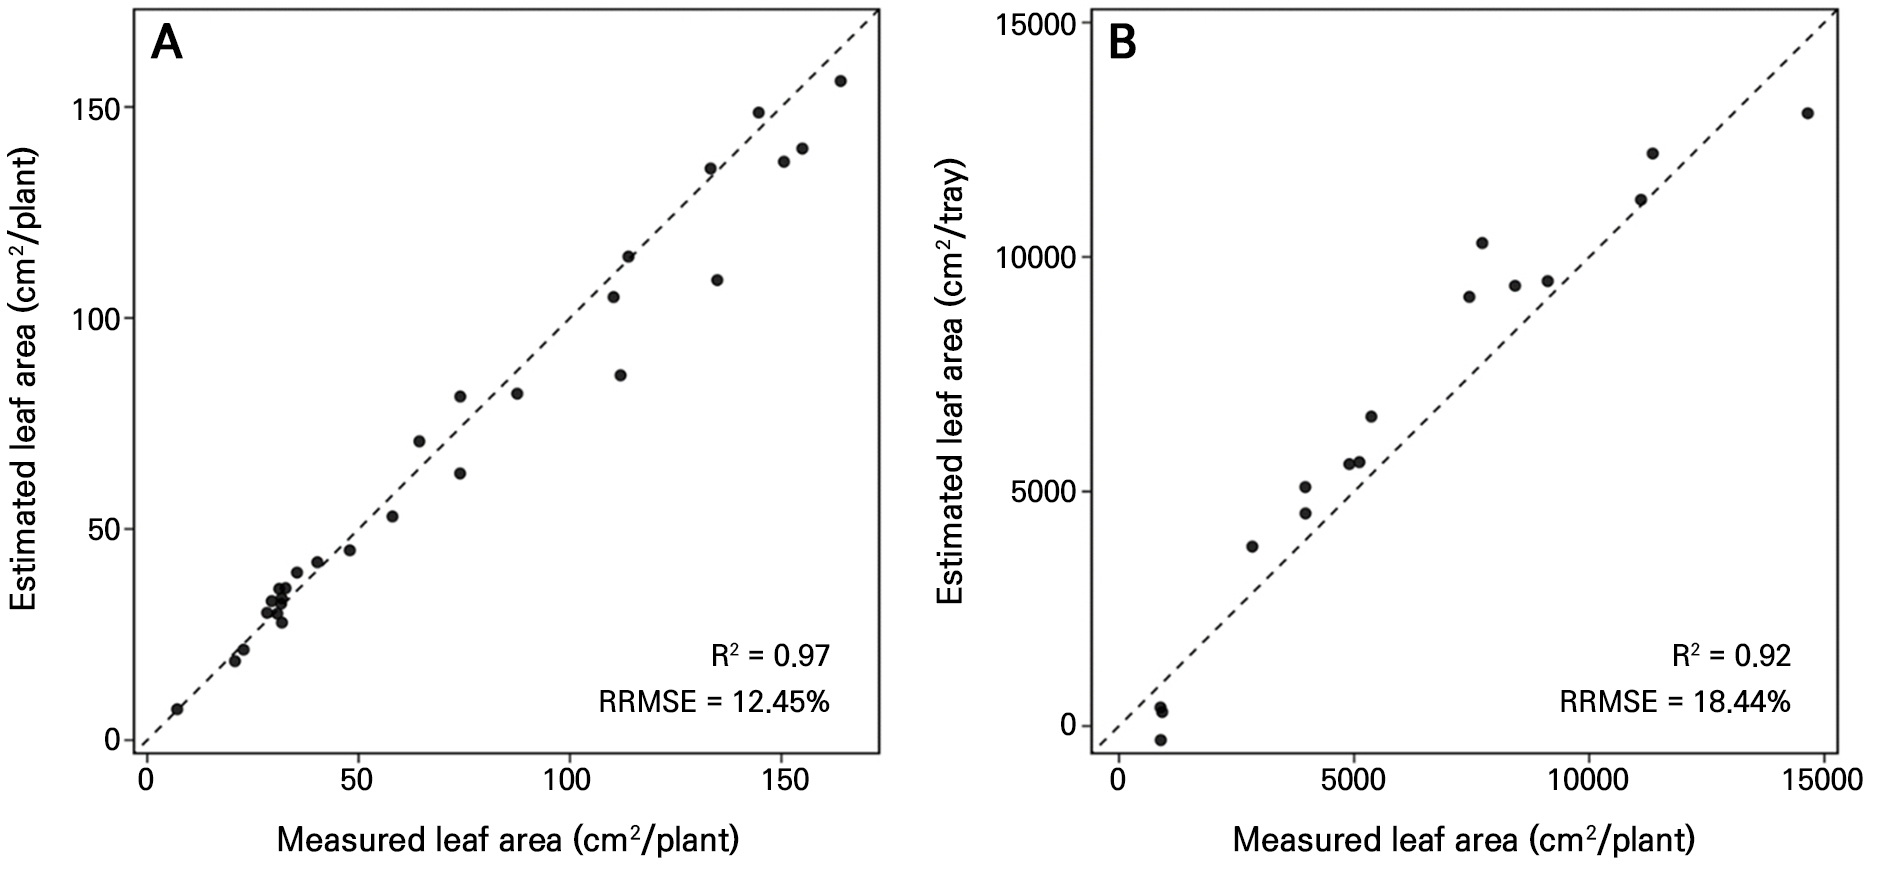
Fig. 4.
Relationship between measured leaf area and leaf area estimated by means of simple linear regression for kimchi cabbage ‘Odae’ at the individual seedling (A) and plug tray (B) levels. Each point represents an individual observation. The dashed line indicates the 1:1 reference line, representing perfect agreement between measured and estimated values.
Table 2.
Performance of the simple linear regression (SLR) model on leaf area estimations in the individual seedling and plug tray units
| Unit | Model Equation | Training set | Test set | |||
| R2 | RRMSE (%) | R2 | RRMSE (%) | |||
| Individual | 0.99 | 7.95 | 0.97 | 12.45 | ||
| Plug tray | 0.96 | 15.41 | 0.92 | 18.44 | ||
Growth parameters, particularly the leaf area, are widely used to evaluate the quality of vegetable seedlings grown under different conditions (Formisano et al. 2022). Leaf area is especially important in vegetable seedlings, as a sufficient leaf area is a critical indicator of seedling vigor, supporting effective photosynthesis and the accumulation of assimilates essential for growth and development after transplanting (Kacheyo et al. 2024). Previous studies have developed image-based methods to estimate the leaf area with high accuracy in various vegetable species. Tong et al. (2013) reported more than 95% identification accuracy in plug trays using a non-destructive image-processing approach across four vegetable seedling varieties, while Mohammadi et al. (2021) demonstrated precise estimation of the per-plant leaf area in bell peppers, with particularly high accuracy for smaller leaves. Rahimikhoob et al. (2023) reported high accuracy for predicting lettuce leaf area values using their developed algorithm based on image analyses. Most of these studies were conducted under conditions in which individual plants did not overlap, thereby minimizing errors caused by leaf clustering or shading. Consistent with these findings, in the present study, image-based estimations of leaf area at the seedling level achieved very high accuracy. However, for practical applications during commercial plug tray cultivation, leaf area estimations at the tray level are of greater significance. Although prolonged cultivation can introduce errors due to leaf overlapping among seedlings, our study demonstrated that changes in the leaf area of kimchi cabbage seedlings at the tray level were accurately estimated under different nitrogen fertilization levels.
Performance of vegetation indices for detecting nitrogen deficiency
The relationships between nitrogen-deficiency-induced growth changes and vegetation indices as calculated from spectral reflectance values were examined by means of a correlation analysis. During the early stage of seedling cultivation (10 DAS), vegetation indices were found only to be weakly related to growth parameters (data not shown). Significant correlations first appeared at 15 DAS, when NDVI, GNDVI, CIgreen, and mrNDVI were strongly correlated (r2 > 0.6) with LAI (Fig. 5A). At 20 DAS, LAI maintained strong correlations with NDVI, GNDVI, CIgreen, and mrNDVI, while SLW also became strongly correlated with NDVI, GNDVI, CIgreen, mrNDVI, and RDVI (Fig. 5B). By 25 DAS, all measured growth parameters, i.e., LAI, SPAD, SDW, and SLW, were strongly correlated with NDVI, GNDVI, CIgreen, mrNDVI, and RDVI. Notably, NDVI and mrNDVI exhibited exceptionally strong correlations with SLW (r2 > 0.90), indicating their high potential for estimating seedling biomass accumulation and morphological development under nitrogen-deficient conditions (Fig. 5C). At 30 DAS, LAI, the SPAD value, SDW, and SLW remained strongly correlated with most vegetation indices. TVI showed significant relationships with LAI, the SPAD value, and SDW but remained weakly associated with SLW. Among all relationships, CIgreen exhibited the strongest correlation with LAI (r2 > 0.95), whereas NDVI, GNDVI, and mrNDVI each showed exceptionally strong correlations with SLW (r2 > 0.95) (Fig. 5D).
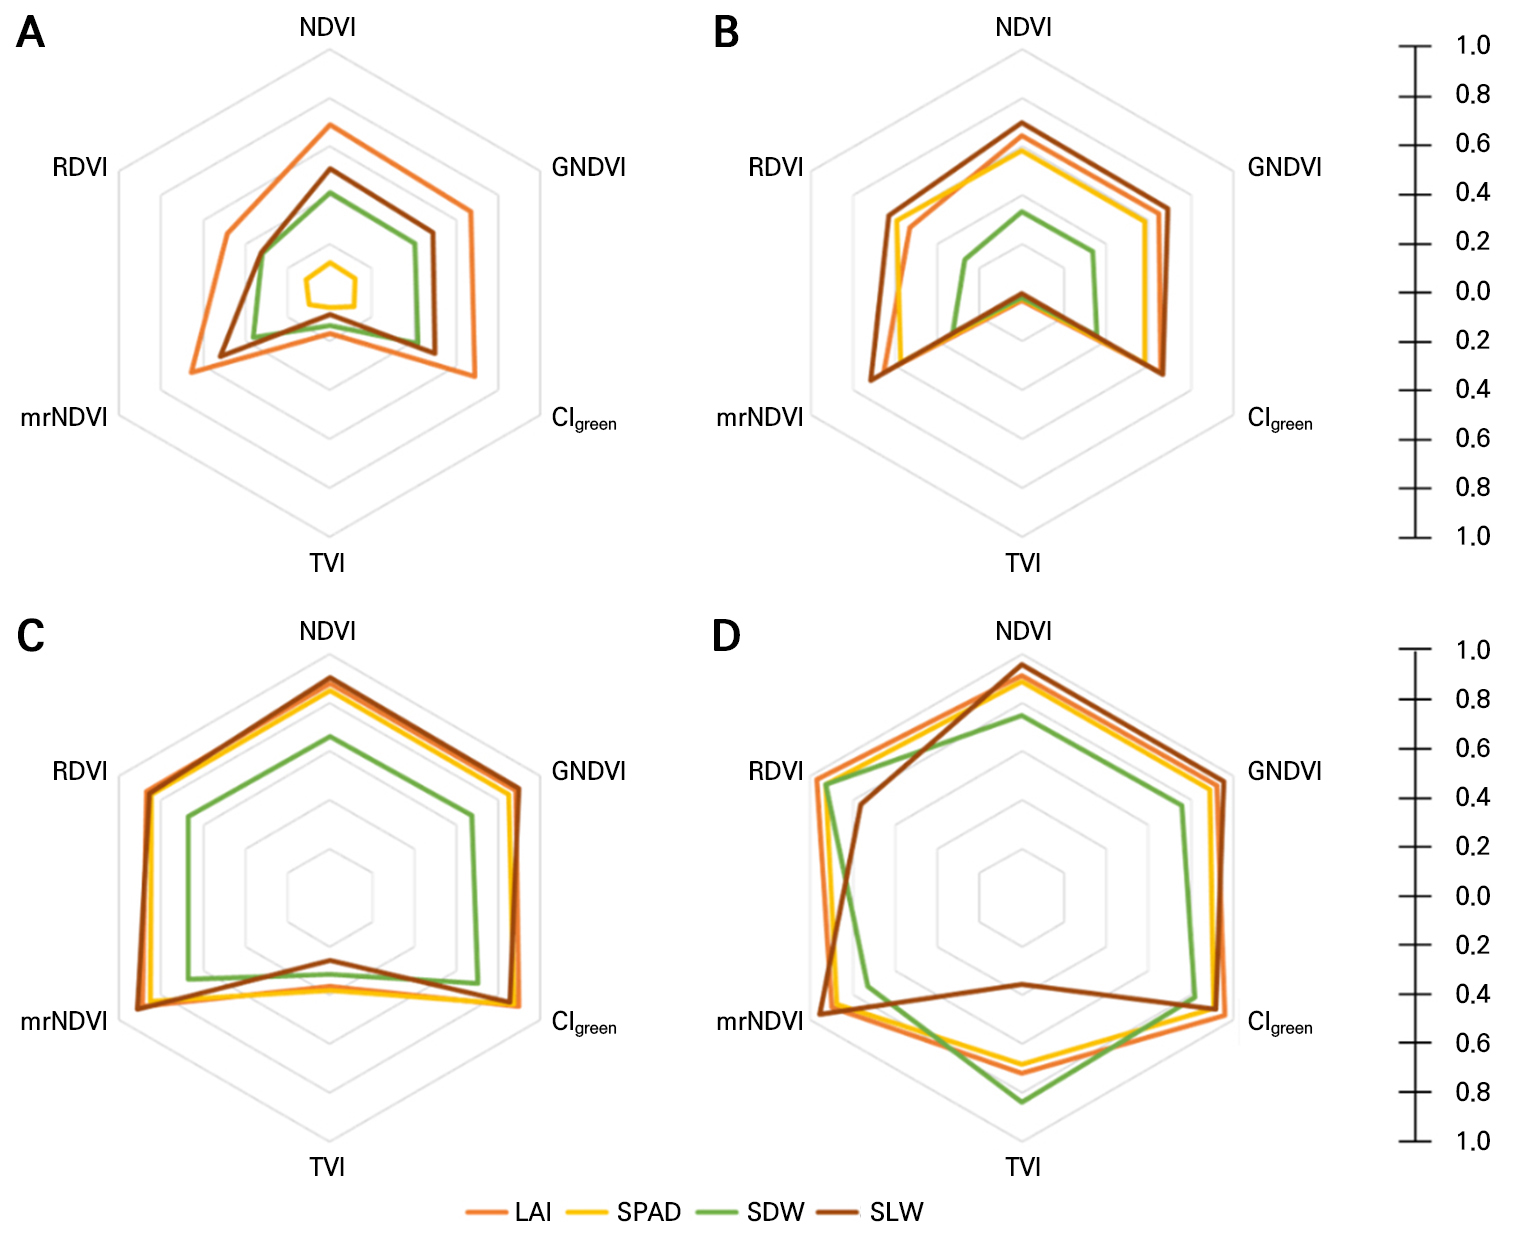
Fig. 5.
Coefficients of determination (R2) derived from linear regression analyses of the relationships between growth parameters and vegetation indices in kimchi cabbage ‘Odae’ seedlings grown under different nitrogen concentrations at 15 (A), 20 (B), 25 (C), and 30 (D) DAS. Each radial axis represents a vegetation index, and the colored lines represent individual growth parameters. The radial distance from the center indicates the magnitude of R2.
The optical properties of leaves are determined by light absorption, transmission, and reflection, which are influenced by leaf pigments, the chemical composition, and the internal structure (Mahlein 2016). Reflectance in the VIS region is primarily governed by photosynthetic pigments such as chlorophyll and carotenoids, whereas NIR reflectance is mainly affected by leaf structural characteristics (Gates et al. 1965). Vegetation indices combine reflectance from different spectral bands to estimate plant traits, including the chlorophyll content, canopy development, and biomass (Xue and Su 2017).
In this study, six vegetation indices were selected to evaluate their relationships with growth responses to nitrogen deficiency. Although all indices were derived from spectral reflectance, they differed in terms of the spectral regions used and the physiological and structural information they capture. NDVI and RDVI, which are based on red and NIR reflectance, have been widely used to estimate canopy-structure-related traits such as LAI, canopy development, and biomass (Broge and Leblanc 2001; Li et al. 2018). In contrast, GNDVI and CIgreen, which incorporate green and NIR reflectance, are commonly regarded as chlorophyll- and nitrogen-sensitive indices associated with plant physiological status (Gitelson et al. 1996; Burns et al. 2022). TVI and mrNDVI are interpreted as mixed indices because they may reflect both pigment-related physiological variations and canopy structural properties (Sims and Gamon 2002; Haboudane et al. 2004; Zou et al. 2024). Therefore, the different relationships observed between vegetation indices and growth parameters in the present study are attributable to the distinct spectral sensitivities of each index and their differential responses to nitrogen deficiency.
Among the vegetation indices evaluated, CIgreen showed the strongest correlation with LAI throughout seedling development. Previous studies have consistently reported that CIgreen is closely associated with LAI and provides more accurate estimations than NDVI under dense canopy conditions owing to its lower susceptibility to saturation (Viña et al. 2011; Madonsela et al. 2023). A similar trend was observed in the present study, particularly during the middle stage of cultivation when LAI exceeded approximately 3. The superior performance of CIgreen is likely due to its greater sensitivity to the canopy chlorophyll status and its reduced saturation at relatively high LAI values, allowing it to capture LAI variations in kimchi cabbage seedlings subjected to nitrogen deficiency more effectively than the other indices.
Similarly, mrNDVI exhibited consistently strong correlations with SLW from the middle to late stages of cultivation. Previous studies suggested that SLW is more closely associated with reflectance in longer infrared wavelengths (>1,000 nm) than with conventional vegetation indices (Zhang et al. 2012; Ecarnot et al. 2013). In contrast, our results demonstrate that mrNDVI, calculated from blue, red and near-infrared reflectance, was sufficiently sensitive to detect nitrogen-deficiency-induced changes in SLW. This finding indicates that leaf structural changes associated with nitrogen deficiency can be effectively captured within the VIS–NIR spectral range.
Unlike LAI and SLW, the vegetation indices most strongly associated with the SPAD value and SDW varied across growth stages, indicating that chlorophyll- and biomass-related traits were influenced by dynamic changes in the leaf physiology and canopy structure during plant development. Similar growth-stage-dependent responses have been reported for SPAD estimations in maize and soybean (Shi et al. 2023; Ma et al. 2024) and biomass estimations in rice and winter oilseed rape (Gnyp et al. 2014; Ma et al. 2019). Consistent with these findings, RDVI and CIgreen alternately showed the strongest correlations with the SPAD value and SDW depending on the seedling developmental stage. These results suggest that no single vegetation index is universally optimal throughout seedling growth and that selecting an appropriate index according to the developmental stage can improve the accuracy of nitrogen deficiency assessments.
The growth-stage-specific analysis (Fig. 5) revealed that the most informative vegetation index varied with seedling development, whereas the Pearson correlation analysis conducted across the entire cultivation period (Fig. 6) demonstrated that NDVI, GNDVI, CIgreen, mrNDVI, and RDVI consistently maintained strong relationships with nitrogen-deficiency-induced growth responses. Similar responses of vegetation indices to nitrogen restriction were observed in tomato seedlings, in which NDVI, GNDVI, and CIgreen derived from multispectral imaging exhibited significant changes at the plug-tray level (Kang et al. 2025). Although the vegetation indices shared similar spectral information, their relative performance differed depending on the growth parameter and developmental stage. CIgreen consistently exhibited the strongest relationship with LAI, whereas NDVI and mrNDVI showed particularly strong relationships with SLW during the middle and late stages of cultivation. In contrast, GNDVI maintained stable correlations with multiple growth parameters throughout the cultivation period. These findings indicate that no single vegetation index is universally optimal, as noted above, for monitoring nitrogen deficiency throughout seedling production. Instead, selecting vegetation indices according to the target growth parameter and developmental stage, or integrating complementary vegetation indices, may improve the accuracy and robustness of nitrogen deficiency assessments. Nevertheless, none of the vegetation indices showed significant relationships with growth parameters at 10 DAS, indicating that the early detection of nitrogen-deficient conditions remains challenging. At this stage, treatment-induced growth differences were limited, and the small canopy size likely increased the influence of background reflectance from the plug trays and growing media. Because background reflectance is a well-known limitation of reflectance-based measurements (Bannari et al. 1995), improved image analysis methods, including those with more effective background removal, or the development of vegetation indices specifically optimized for early seedling growth, may enhance the applicability of multispectral imaging further for early nitrogen deficiency detection.
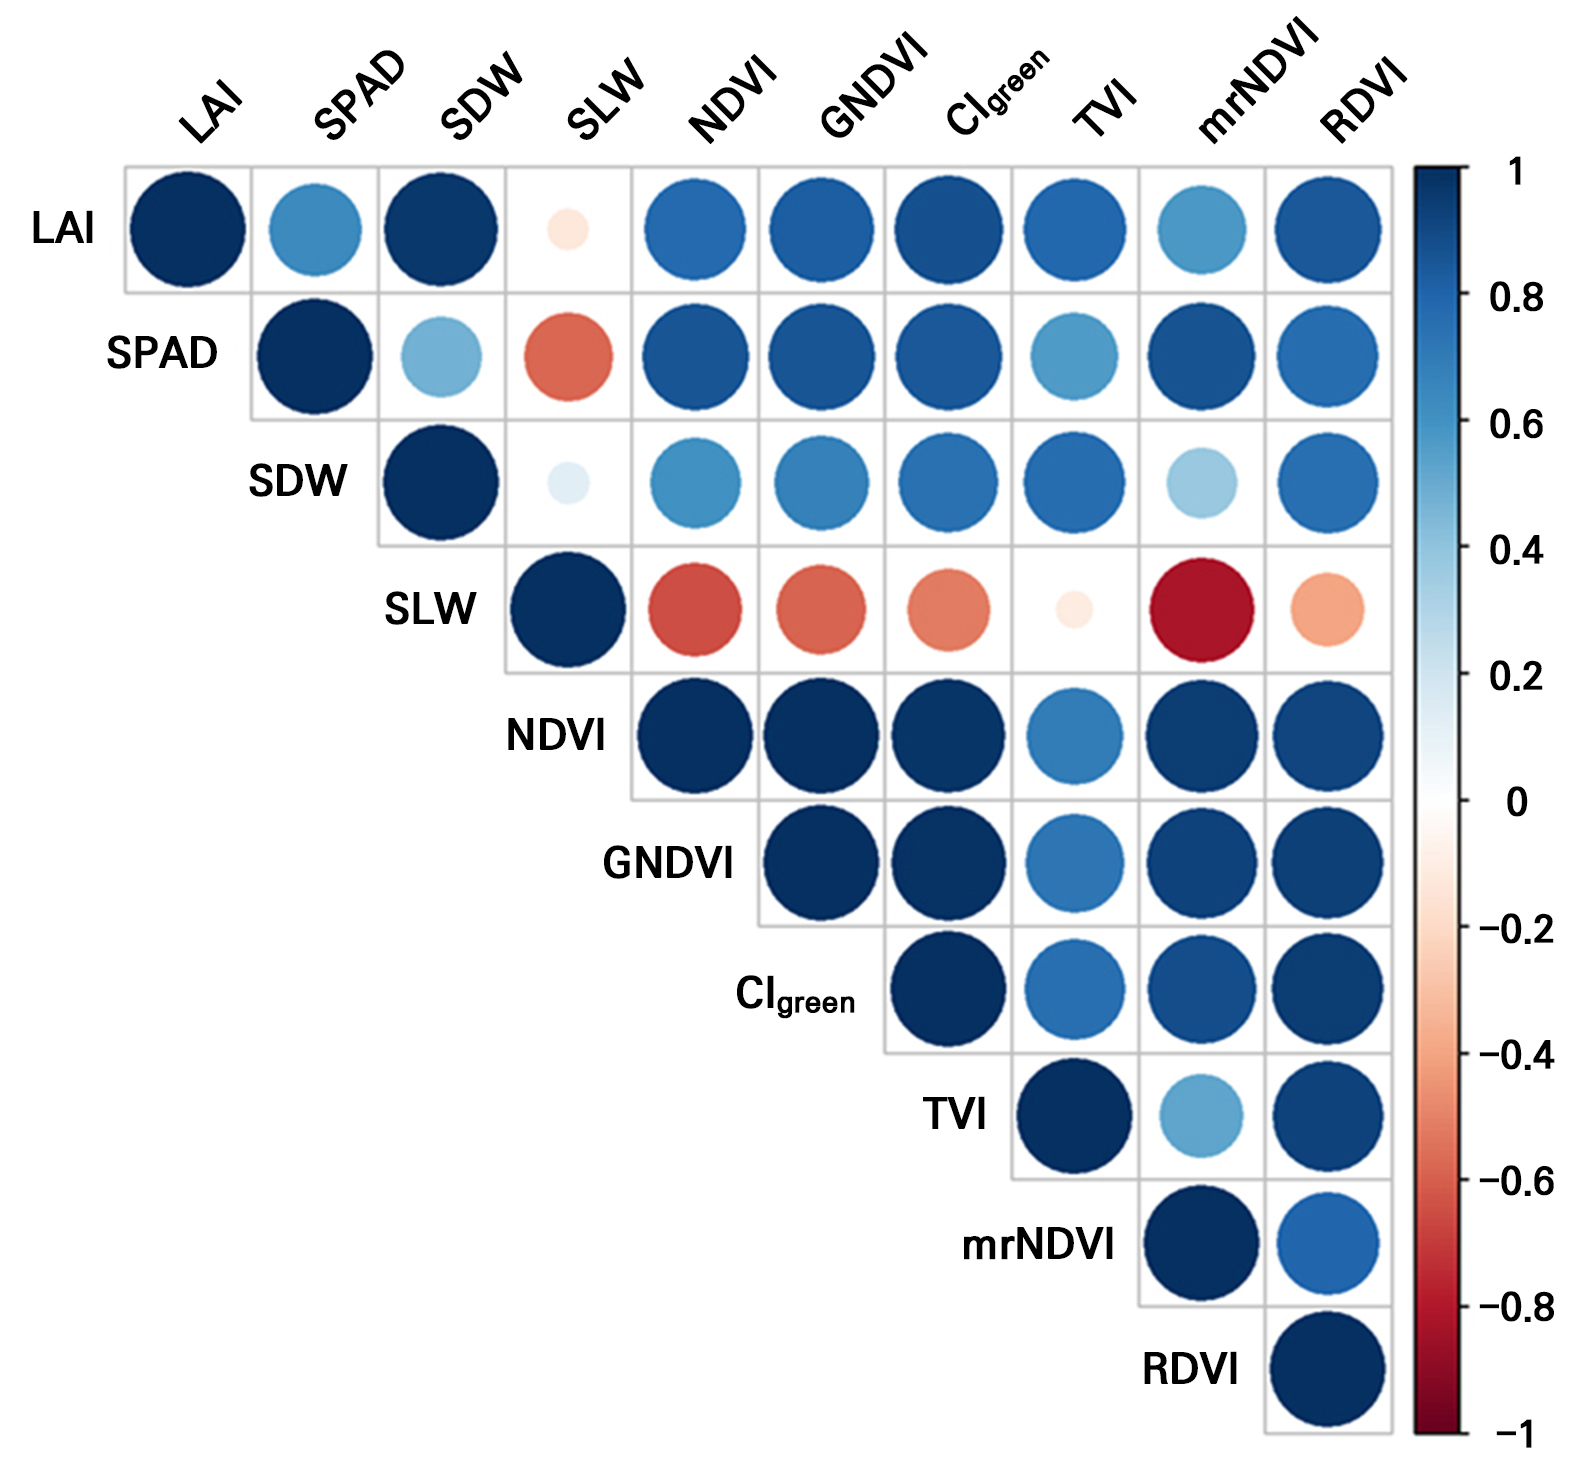
Fig. 6.
Pearson correlation matrix showing the relationships between growth parameters and vegetation indices in kimchi cabbage ‘Odae’ seedlings based on data pooled across all measurement dates. Blue and red circles indicate positive and negative correlations, respectively. Circle size and color intensity are proportional to the absolute value of the Pearson correlation coefficient (|r|), with larger and darker circles indicating stronger correlations.
Conclusions
In this study, multispectral imaging was evaluated as a non-destructive approach for estimating leaf area and monitoring nitrogen deficiency in kimchi cabbage seedlings. Image-based leaf area predictions demonstrated high accuracy at both the individual seedling and plug tray levels, although the prediction accuracy at the plug tray level was slightly reduced by leaf overlap and by the upright leaf orientation in this case. Vegetation indices became effective for nitrogen deficiency assessments from 15 DAS onward, with NDVI, GNDVI, CIgreen, mrNDVI, and RDVI showing consistently strong performance. The relative performance of the vegetation indices varied with the developmental stage, indicating that an appropriate index selection can improve the assessment accuracy. These findings demonstrate the potential of multispectral imaging for the high-throughput monitoring of nitrogen deficiency during commercial seedling production.
