

Introduction
Materials and Methods
Experimental Design
Plant Material and Growth Conditions
Elemental Analysis
Micropropagation
Phenotypic Plasticity
Statistical Analyses
Results and Discussion
Introduction
Amaranthus is a large taxonomic group with an estimated 60–70 diverse species worldwide that have been extensively reviewed (Achigan-Dako et al., 2014; Venskutonis and Kraujalis, 2013 to name a few). They are often referred to as belonging to the African leafy vegetable group, which is a general term usually given to non-commercial vegetables with high micronutrient content; as such, they are purported to have the potential to alleviate problems related to malnutrition (Gerrano et al., 2015). Although some amaranths are cultivated, most are harvested in the wild for food and used for medical purposes (Achigan-Dako et al., 2014). They can be categorised according to their use, namely, grain amaranths, such as A. caudatus; vegetable amaranths, such as A. tricolor; and weed amaranths, such as A. dubius (Das, 2012). Even though the latter is classified as a weed, this species is used as a vegetable to supplement the diets of many rural populations in South Africa (Gerrano et al., 2015). A. dubius is reported to contain high levels of Ca, Fe, K, Al, Mn, and Mg (Odhav et al., 2007; Yang and Keding, 2009; Molina et al., 2011; Muriuki et al., 2014). Studies in which micronutrient analyses of A. dubius were conducted in Africa document the ranges for Ca and Fe as 22.3–3014.7 mg 100 g-1 dry mass (DM) and 3.4–96.2 mg 100 g-1 DM, respectively (Odhav et al., 2007; Yang and Keding, 2009; Molina et al., 2011; Akinwunmi and Omotayo, 2016). This variation could be attributed to the tetraploid (n = 32) genome of A. dubius (Gerrano et al., 2015); such variability has also been reported in other polyploid amaranths (Ranade et al., 1997; Lymanskaya, 2012; Štefúnová et al., 2015). Therefore, there is evidence for a strategy that screens for high micronutrient-yielding genotypes and multiplying them in vitro to produce sexual breeding populations for community gardens. Towards this end, the objectives of this study were to screen a small population of A. dubius for the Ca and Fe content, to select and clonally propagate high and low Fe- and Ca-producing genotypes from the screened population, and to test the resulting clonal progeny ex vitro for their Fe and Ca content.
Materials and Methods
Experimental Design
The experimental design is illustrated in Fig. 1, and the details are provided in the sections that follow.
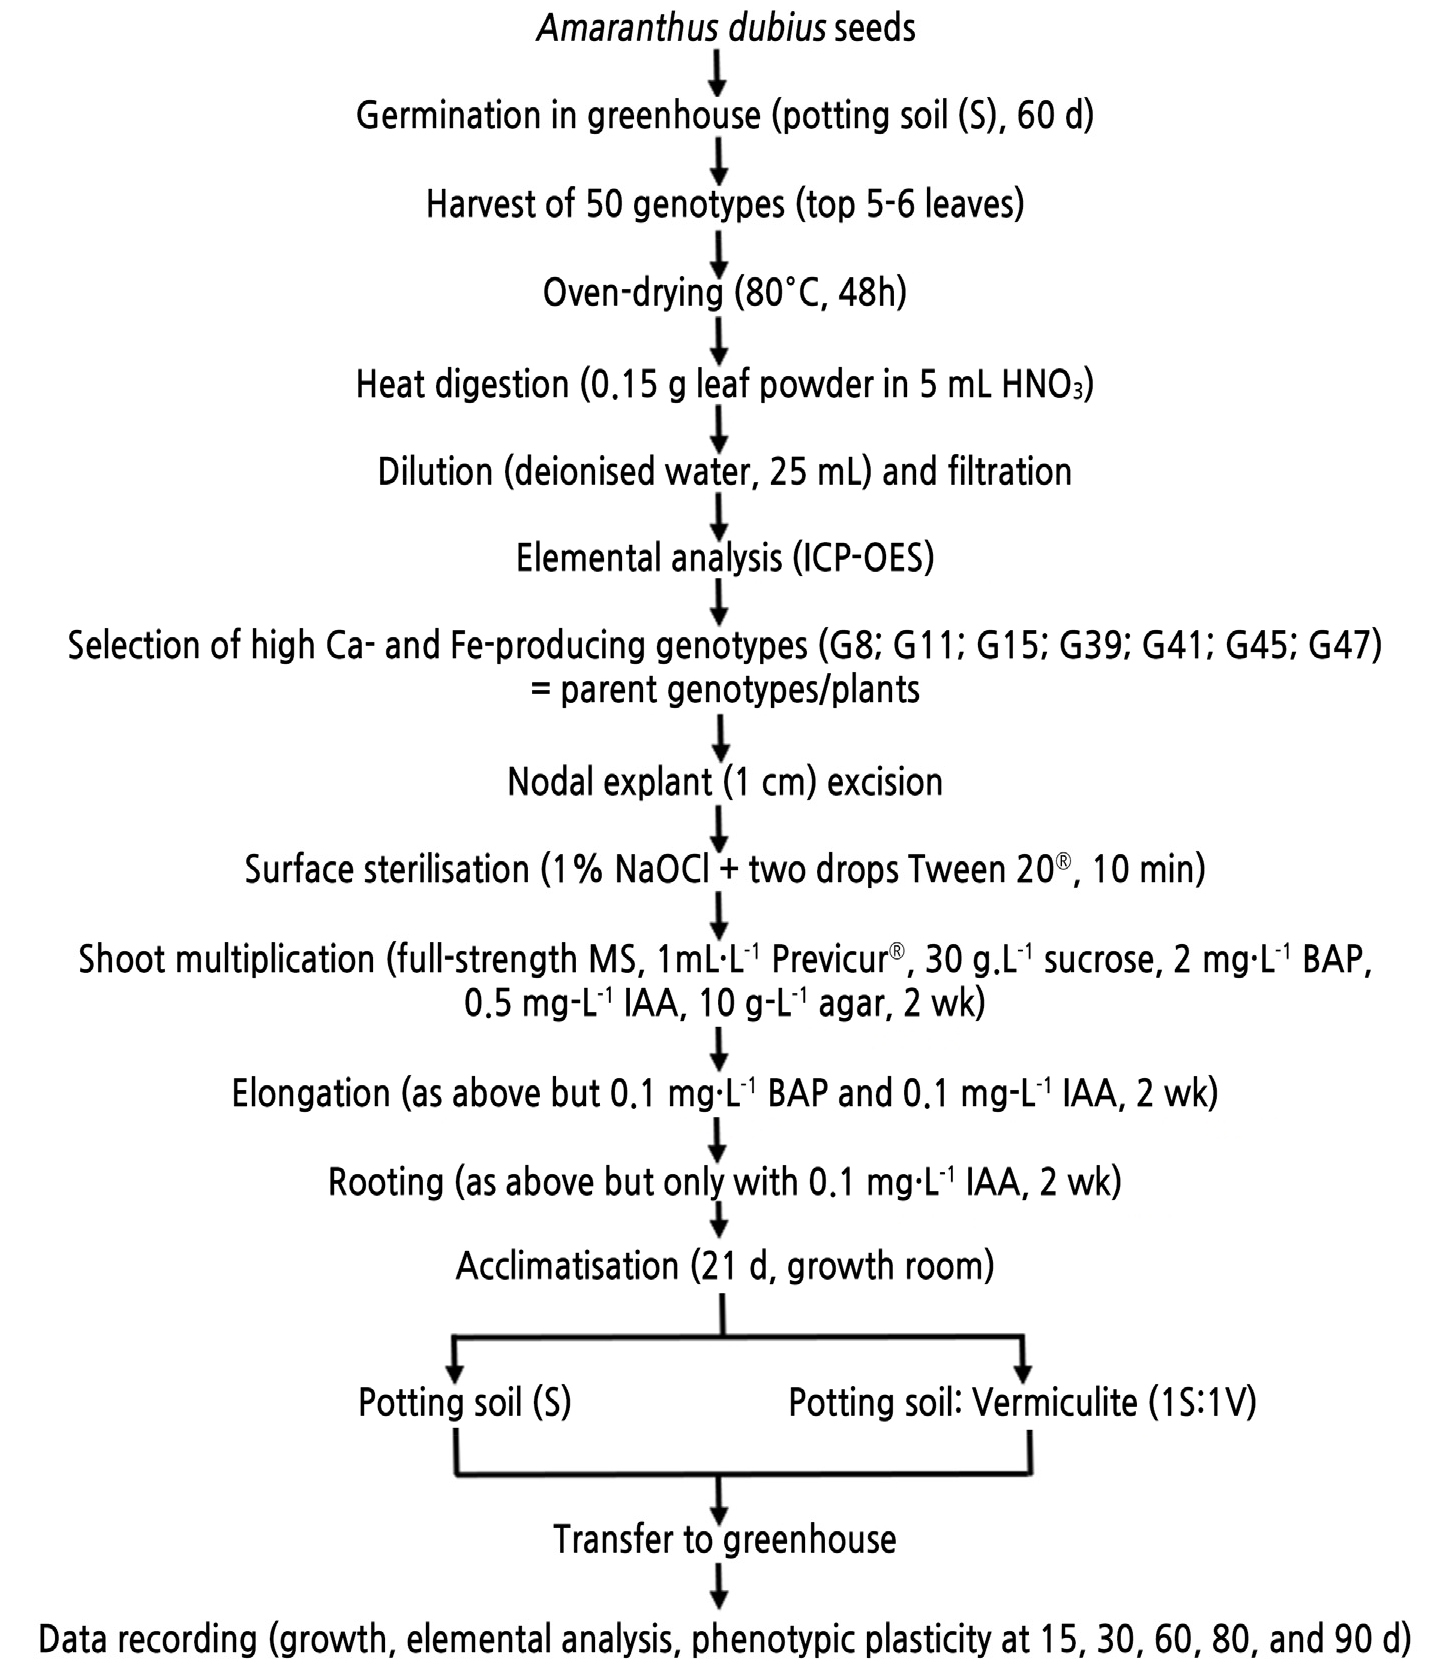
Fig. 1.
Experimental design for the study on the effects of genotype, physiological age, and substrate on the leaf Ca and Fe content in clones of Amaranthus dubius. d = days, G = genotype, HNO3 = nitric acid, ICP-OES = inductively coupled plasma-optical emission spectrometry, NaOCl = sodium hypochlorite, MS = Murashige & Skoog basal salt medium, BAP = 6-benzylaminopurine, IAA = indole-3-acetic acid, wk = weeks.
Plant Material and Growth Conditions
Seeds of Amaranthus dubius were randomly collected from a plant population at Randles Nursery, Durban, South Africa (29°49' S, 30°58' E), germinated and grown in potting soil for 60 days in a greenhouse (29°52' S, 30°59'E; 25°C day (d)/18°C night; 84–94% relative humidity). An overhead irrigation system was used to water the plants for 3 min three times daily (20 mL·min-1). The plants were treated with fungicides bi-weekly: 2 g·L-1 Dithane (Efeckto, South Africa) and 1 mL·L-1 Supremo (Grovida, South Africa) applied as a foliar spray and 1 mL·L-1 Chronos (Makhteshin-Agan, South Africa) and 1.25 mL·L-1 Orius (Makhteshin-Agan, South Africa) applied to the soil. Fertilisers (1 mL·L-1 Trelmix (Hubers, South Africa) and 2.5 g·L-1 Multifeed® (Nulandis®, South Africa) were also applied as foliar sprays every alternate week.
Elemental Analysis
After 60 days of growth in a greenhouse, the top 5–6 leaves of 50 seedling plants (genotypes) (30 cm height and ± 25–30 leaves) were oven dried at 80°C for 48 h. Then, 0.15 g leaf material of each genotype was heat digested in 5 mL of nitric acid (HNO3) for 3 min, increased to 25 mL with deionised water, and filtered (0.22 µm, Pall Corporation, USA). Ca and Fe contents were determined using inductively coupled plasma-optical emission spectrometry (ICP-OES) (Perkin Elmer 5300, Germany), in the ranges of 0.1–5 and 1–150 ppm for Fe and Ca, respectively. The extent of the Ca and Fe levels amongst the 50 tested genotypes was 246.3 ± 1.1–765.3 ± 6.1 and 5.3 ± 0.1–26.7 ± 0.1 mg 100 g-1 DM, respectively, in accordance with previous reports (Odhav et al., 2007; Yang and Keding, 2009; Molina et al., 2011; Akinwunmi and Omotayo, 2016). Seven genotypes, ranked as G47 > G45 > G11 > G41 = G8 > G39 > G15 for Ca levels and G47 = G45 > G39 = G41 > G8 > G15 > G11 for Fe levels were used as parent plants (parent genotypes) in the cloning experiments. Although the seven selected genotypes differed in their Ca and Fe contents, they displayed similar morphological traits.
Micropropagation
Nodal explants (1 cm) of the parent genotypes were sterilised (1% (v/v) NaOCl with two drops of Tween 20® for 10 min), trimmed, and cultured on a medium common to all stages: Murashige and Skoog basal salts with vitamins (Murashige and Skoog, 1962; Highveld Biological, South Africa), 1 ml·L-1 Previcur® (Propamocarb 600 g·L-1) (Bayer, South Africa), 10 g·L-1 agar (Sigma, South Africa), and 30 g·L-1 sucrose, pH 5.6–5.8. After 2 weeks on shoot multiplication medium (2 mg·L-1 6-benzylaminopurine [BAP] and 0.5 mg·L-1 indole-3-acetic acid [IAA]), shoots >2 cm were elongated (0.1 mg·L-1 BAP and 0.1 mg·L-1 IAA) individually in culture tubes and, 2 weeks later, they were transferred onto rooting medium (0.1 mg·L-1 IAA) for 2 weeks. All the cultures were kept in a growth room (24°C day/18°C night and 16-h fluorescent light at 200 µmol·M-2·S-1/8 h dark photoperiod). Plantlets (>3 cm in shoot length) were potted (1 plant/pot; 10-cm diameter, 8-cm height) in potting soil (S) or 1 soil:1 vermiculite (v/v) (S:V) with decreasing humidity for 21 days. Each plant was then transplanted into a larger pot (14.5-cm height, 17.5-cm diameter) and transferred to a greenhouse (27–39°C, 85–90% RH and 500–1,100 µmol·m-2·s-1) for 90 days. The pH of both substrate types (5.92 and 6.26 for S and S:V, respectively) was determined not to be significantly different (mean of three values for pH of leachate, t-test). Leaves were counted before harvesting for shoot biomass and chemical analyses (at different physiological ages) as for the parent plants.
Phenotypic Plasticity
The phenotypic plasticity index was calculated for each of the shoot growth parameters and micronutrient contents measured. The index was calculated as the difference between the minimum and the maximum mean values between S- and S:V-grown clones divided by the maximum mean value (Valladares et al., 2000). The index ranged from zero (no plasticity) to one (maximum plasticity). Mean phenotypic plasticity was calculated for each measured parameter and genotype by averaging the indices of plasticity obtained.
Statistical Analyses
The experiments were conducted in a randomised block design. All values are presented as mean of three replicates per genotype. Data were analysed using the Genstat statistical package 17th edition (VSN International, Hernal Hempstead, UK). Prior to analysis, data were tested for normality using D’Agostino-Pearson test. One-way ANOVA was used to test for differences amongst and within genotypes for each measured parameter. Three-way ANOVA was used to test for interactions amongst the genotype, physiological age, and substrate. Means for analyses of variance were separated using a Tukey post-hoc test. A paired t-test was used to test for differences between substrates. All differences were considered significant at the 0.05 level.
Results and Discussion
To minimise somaclonal variation, and as no such protocol has been published, preliminary studies were undertaken to establish a protocol for direct organogenesis from nodal segments of A. dubius. That reported here produced an average of only two plants/explant which, although a low yield, was deemed adequate for this study. Although the parent genotypes were grown only in potting soil, the two substrates used for the ex vitro clones were chosen to investigate the effect of a relatively low nutrient supply [a common limiting factor in the production of traditional vegetables in rural communities (Matenge et al., 2011)] on the leaf biomass (the consumed part of the plant) and on their Ca and Fe content. Comparisons were also made between the parent genotypes and their clones to determine how many days of growth in S or S:V it took for the clones to accumulate similar Ca and Fe contents to those of their respective parents (which were determined 60 days after germination) (Tables 1 and 2).
Table 1.
Comparison of Ca levels between 60-day-old parent plants of A. dubius and their clones, and the rankings of the cloned genotypes at 15, 30, 60, 80, and 90 days (d) of ex vitro growth on soil (S) and soil:vermiculite (S:V)
|
Genotype (G) | Substrate |
Parent plant (mg 100 g-1) |
Clones (mg 100 g-1) | |||||||||
| 60 d | 15 d | 30 d | 60 d | 80 d | 90 d | |||||||
| 8 | S | 534.9 ± 1.0 BC,c | 302.7 ± 157.9 C | 562.3 ± 153.1B C | 649.9 ± 139.8 B | 780.2 ± 15.0 AB | 999.6 ± 34.0 A | |||||
| S:V | - | 525.8 ± 7.3 c | 562.4 ± 24.8 bc | 796.5 ± 69.3 b | 1148.1 ± 113.5 a* | 1204.0 ± 94.1 a | ||||||
| 11 | S | 604.1 ± 1.5 A,a | 383.5 ± 91.1 A | 430.0 ± 5.3 A | 486.1 ± 123.5 A | 512.4 ± 0.9 A | 651.7 ± 155.6 A | |||||
| S:V | - | 689.4 ± 89.2 a | 838.3 ± 68.0 a,* | 876.2 ± 163.5 a* | 888.2 ± 58.3 a* | 912.2 ± 154.3 a | ||||||
| 15 | S | 402.0 ± 1.4 B,b | 369.7 ± 14.0 B | 427.3 ± 88.8 B | 435.1 ± 13.4 B | 486.3 ± 12.4 B | 723.0 ± 62.1 A | |||||
| S:V | - | 598.4 ± 100.1 ab | 658.2 ± 25.5 ab | 812.1 ± 146.7 ab | 993.4 ± 161.7 a | 1017.7 ± 154.5 a | ||||||
| 39 | S | 453.5 ± 1.5 B,c | 484.3 ± 227.7 AB | 752.7 ± 52.0 AB | 800.9 ± 118.6 AB | 961.1 ± 157.2 AB | 1077.2 ± 34.8 A | |||||
| S:V | - | 423.7 ± 5.7 c | 631.1 ± 54.0 b | 740.3 ± 12.2 b | 765.5 ± 57.4 b | 1152.9 ± 35.4 a | ||||||
| 41 | S | 535.8 ± 3.8 A,b | 467.6 ± 126.5 A | 571.6 ± 160.2 A | 626.4 ± 36.0 A | 628.4 ± 156.6 A | 896.5 ± 145.4 A | |||||
| S:V | - | 410.5 ± 54.8 b | 475.4 ± 64.0 b | 769.4 ± 153.9 ab | 826.1 ± 19.0 ab | 1176.5 ± 130.9 a | ||||||
| 45 | S | 641.6 ± 1.0 B,a | 641.6 ± 43.3 B | 516.4 ± 115.5 B | 793.7 ± 3.8 B | 812.9 ± 10.4 B | 1127.8 ± 94.8 A | |||||
| S:V | - | 552.5 ± 140.0 a | 570.9 ± 73.1 a | 600.2 ± 46.8 a | 723.1 ± 386.6 a | 943.3 ± 129.3 a | ||||||
| 47 | S | 765.3 ± 6.1 A,a | 342.4 ± 154.2 A | 370.6 ± 59.2 A | 412.7 ± 65.1 A | 533.7 ± 2.0 A | 656.6 ± 229.8 A | |||||
| S:V | - | 106.9 ± 34.6 b | 432.4 ± 97.4 ab | 554.0 ± 284.9 ab | 590.4 ± 38.7 ab | 679.5 ± 145.0 ab | ||||||
| Interaction | Rankings | |||||||||||
| Parameters | F-value | Age (days) | S | S:V | ||||||||
| Genotype × Substrate | 6.4** | 15 | 8 = 11 = 15 = 39 = 41 = 45 = 47 | 8 = 11 = 15 = 45 ≥ 39 = 41 ≥ 47 | ||||||||
| Genotype × Physiological Age | 0.9 NS | 30 | 8 = 11 = 15 = 39 = 41 = 45 = 47 | 11 ≥ 8 = 15 = 39 = 45 ≥ 41 = 47 | ||||||||
| Substrate × Physiological Age | 0.7 NS | 60 | 39 = 45 ≥ 8 = 11 = 41 ≥ 15 = 47 | 8 = 11 = 15 = 39 = 41 = 45 = 47 | ||||||||
| Genotype × Substrate × Physiological Age | 0.6 NS | 80 | 39 ≥ 8 = 41 = 45 ≥11 = 15 = 47 | 8 = 11 = 15 = 39 = 41 = 45 = 47 | ||||||||
| 90 | 8 = 11 = 15 = 39 = 41 = 45 = 47 | 8 = 11 = 15 = 39 = 41 = 45 = 47 | ||||||||||
|
Parents (60 d on soil) | 47 > 45 > 11 > 41 = 8 > 39 > 15 | |||||||||||
Parent plants were only grown in S. Dissimilar letters denote statistical differences between parent plants and their clones grown on S (A-C) and their clones grown on 1S:1V (a-b) with increasing physiological age (one-way ANOVA, Tukey’s post hoc test, p < 0.05, n = 3, mean ± SE). * = significant differences between substrates for each clone at each physiological age (paired t-test, p < 0.05, n = 3, mean ± SE). NS = No significance or ** = significance for each interaction amongst genotype, physiological age, and substrate (three-way ANOVA, p < 0.05, n = 3).
Table 2.
Comparison of Fe levels between 60-day-old parent plants of A. dubius and their clones, and the rankings of the cloned genotypes at 15, 30, 60, 80, and 90 days (d) of ex vitro growth on soil (S) and soil:vermiculite (S:V)
|
Genotype (G) | Substrate |
Parent plant (mg 100 g-1) |
Clones (mg 100 g-1) | |||||||||
| 60 d | 15 d | 30 d | 60 d | 80 d | 90 d | |||||||
| 8 | S | 9.22 ± 0.10 BC,bc | 12.0 ± 0.6 A | 10.98 ± 0.6 AB | 8.4 ± 0.2 C | 6.2 ± 0.2 D | 4.4 ± 0.5 D | |||||
| S:V | - | 13.4 ± 0.4 a | 9.4 ± 0.1 b | 7.8 ± 0.6 cd | 6.2 ± 0.3 de | 5.5 ± 0.2 e | ||||||
| 11 | S | 5.18 ± 0.06 D,c | 16.0 ± 0.0 A | 9.0 ± 0.1 B | 6.1 ± 0.0 C* | 4.0 ± 0.0 E | 3.1 ± 0.0 F | |||||
| S:V | - | 13.0 ± 0.0 a | 10.0 ± 0.6 b | 5.7 ± 0.1 c | 5.0 ± 0.0 c* | 4.6 ± 0.1 c* | ||||||
| 15 | S | 8.40 ± 0.06 B,b | 9.8 ± 0.2 A | 7.6 ± 0.3 BC | 6.5 ± 0.2 CD* | 5.6 ± 0.4 D | 2.9 ± 0.1 E | |||||
| S:V | - | 12.4 ± 0.6 a* | 8.4 ± 0.3 b | 5.5 ± 0.3 c | 5.5 ± 0.2 c | 5.3 ± 0.2 c* | ||||||
| 39 | S | 9.64 ± 0.04 B,abc | 13.1 ± 1.5 A | 10.4 ± 0.2 AB | 9.0 ± 0.3 B | 8.3 ± 0.2 B | 8.2 ± 0.3 B* | |||||
| S:V | - | 12.4 ± 1.7 a | 12.9 ± 1.0 a | 8.4 ± 0.4 bc | 7.1 ± 0.6 c | 6.1 ± 0.2 c | ||||||
| 41 | S | 9.62 ± 0.06 A,ab | 9.6 ± 1.0 A | 8.5 ± 0.9 A | 7.7 ± 1.8 A | 5.8 ± 1.4 A | 5.3 ± 0.4 A | |||||
| S:V | - | 11.7 ± 1.6 a | 10.0 ± 0.5 ab | 7.4 ± 0.6 bc | 6.5 ± 0.6 bc | 5.5 ± 0.6 c | ||||||
| 45 | S | 10.60 ± 0.07 B,b | 15.8 ± 0.5 A | 11.91 ± 0.54 B | 8.0 ± 0.1 C | 6.1 ± 0.5 C* | 5.9 ± 0.6 C* | |||||
| S:V | - | 15.2 ± 0.6 a | 10.6 ± 0.3 b | 7.7 ± 0.6 c | 4.2 ± 0.4 d | 2.5 ± 0.1 d | ||||||
| 47 | S | 10.76 ± 0.11 AB,a | 13.2 ± 0.3 A* | 10.8 ± 0.6 AB | 10.2 ± 0.8 B | 9.7 ± 0.8 B | 6.0 ± 0.4 C | |||||
| S:V | - | 10.2 ± 0.6 ab | 9.2 ± 0.6 abc | 8.7 ± 0.6 bc | 8.6 ± 0.1 bc | 7.2 ± 0.2 c* | ||||||
| Interaction | Rankings | |||||||||||
| Parameters | F-value | Age (days) | S | S:V | ||||||||
| Genotype × Substrate | 5.7** | 15 | 11 = 45 ≥ 39 = 47 ≥ 8 = 15 = 41 | 45 ≥ 8 = 11 = 15 = 39 = 41 ≥ 47 | ||||||||
| Genotype × Physiological Age | 8.0** | 30 | 45 ≥ 47 = 8 ≥ 39 = 11 ≥ 41 = 15 | 39 ≥ 45 ≥ 8 = 11 = 15 = 41 = 47 | ||||||||
| Substrate × Physiological Age | 1.2 NS | 60 | 47 ≥ 41 = 39 ≥ 8 ≥ 45 ≥ 15 ≥ 11 | 39 = 47 ≥ 8 = 41 = 45 ≥ 11 = 15 | ||||||||
| Genotype × Substrate × Physiological Age | 3.2 NS | 80 | 39 = 47 ≥ 8 = 45 ≥ 15 = 41 ≥ 11 | 47 ≥ 39 ≥ 8 = 15 = 41 ≥ 11> 45 | ||||||||
| 90 | 39 ≥ 41 = 45 = 47 ≥ 8 ≥ 11 = 15 | 47 ≥ 39 ≥ 8 = 41 ≥ 15 ≥ 11 ≥ 45 | ||||||||||
|
Parents (60 d on S) | 47 = 45 > 39 = 41 > 8 > 15 > 11 | |||||||||||
Parent plants were only grown in S. Dissimilar letters denote statistical differences between parent plants and their clones grown on S (A-C) and their clones grown on S:V (a-b) with increasing physiological age (one-way ANOVA, Tukey’s post hoc test, p < 0.05, n = 3, mean ± SE). * = significant differences between substrates for each clone at each physiological age (paired t-test, p < 0.05, n = 3, mean ± SE). NS = No significance or ** = significance for each interaction amongst genotype, physiological age, and substrate (Three-way ANOVA, p < 0.05, n = 3).
The only observed significant difference in the effect of the substrates on the number of leaves was in the G8 clones, which produced significantly the most leaves in the low nutrient substrate (results not shown). There was no effect of the tested substrates on the shoot fresh (1.3 ± 0.6–3.1 ± 0.8 and 1.3 ± 0.7–3.0 ± 0.3 g in S and S:V, respectively) and dry masses (0.3 ± 0.2–0.6 ± 0.0 g and 0.3 ± 0.1–0.8 ± 0.1 g in S and S:V, respectively) of the clones of all seven genotypes (results not shown). However, the results demonstrate a low phenotypic plasticity as represented by the mean indices for overall shoot growth (MPI = 0.26) and for each shoot parameter (MPI = 0.19, 0.29, and 0.29 for the number of leaves, shoot fresh mass, and dry mass, respectively, Table 3) and for shoot growth of the clones of each genotype (MPISG = 0.16 to 0.43, Table 3). This indicates that leaf biomass is not negatively affected by low nutrient soils, characteristic of those in rural communities who cannot afford to apply fertilisers. However, other environmental stresses that may affect leaf biomass in A. dubius as reported for A. tricolor, A. cruentus,and A. blitum under water stress (Liu and Stützel, 2004) and for A. tricolor under varying light intensities (Singh et al., 2009) still need to be investigated for A. dubius.
In this study, the genotype, physiological age, and substrate type had varying effects on the leaf Ca and Fe levels (determined using ICP-OES) of the clones of A. dubius obtained by micropropagation. Clonal variability (reflected as rankings, Table 1) was observed as significant differences in leaf Ca amongst the clones of each of the parent genotypes at days 60 and 80 on S and days 15 and 30 on S:V. Translocation of Ca occurs mainly in the xylem with water and is therefore dependent on transpiration (Clarkson 1984). High humidity, which causes reduced transpiration, in the greenhouse could have affected Ca mobility in certain genotypes leading to variability in their Ca concentrations. By day 90, the clones of all parents had similar Ca levels to each other regardless of the substrate (Table 1). They also produced similar Ca levels to their parents by day 15 on both substrates, except for G47. As physiological age increased up to day 90, Ca levels increased significantly in G8, G15, and G45 on S and in G8, G39, and G41on S:V (Table 1). Due to the scarcity of studies on A. dubius and on micropropagated clones, comparisons can only be made with related species and common vegetables. Generally, Ca accumulates with advancing maturity of plant organs because of its immobile nature (Chapin, 1980; Noodén, 1988; Khader and Rama, 2003); for example, the leaf Ca content increased from day 33 to 61 in two accessions of Cicer arietinum (chickpea) leaves (Ibrikci et al., 2003) grown in a greenhouse. However, in field-grown A. cruentus (a close relative of A. dubius), Moussa et al. (2020) reported a decrease in leaf Ca content with increasing harvest time (up to 8 weeks after transplanting). In terms of consumption, leaf age has an effect on palatability and digestibility, which are reportedly lower in older leaves than young ones; more mature leaves may also contain anti-nutrients (e.g. oxalate and phytate), which decrease mineral nutrient bio-availability to humans and animals (Ross and Graham, 1999).
Table 3.
Phenotypic plasticity index (PPI) for shoot growth and Ca and Fe content at different physiological ages for the cloned genotypes of A. dubius parent plants
| Parameter | PPI | MPI | |||||||
| G8 | G11 | G15 | G39 | G41 | G45 | G47 | |||
| Shoot growth | |||||||||
| no. of leaves | 0.41 | 0.17 | 0.12 | 0.06 | 0.24 | 0.04 | 0.27 | 0.19 | |
| shoot fresh weight | 0.28 | 0.32 | 0.08 | 0.26 | 0.50 | 0.21 | 0.38 | 0.29 | |
| shoot dry weight | 0.33 | 0.31 | 0.15 | 0.18 | 0.54 | 0.24 | 0.32 | 0.29 | |
| MPISG | 0.34 | 0.26 | 0.12 | 0.17 | 0.43 | 0.16 | 0.32 | ||
| Physiological Age | |||||||||
| Ca | 15 d | 0.13 | 0.12 | 0.42 | 0.38 | 0.69 | 0.44 | 0.14 | 0.33 |
| 30 d | 0.16 | 0.17 | 0.00 | 0.35 | 0.14 | 0.49 | 0.10 | 0.20 | |
| 60 d | 0.08 | 0.19 | 0.18 | 0.46 | 0.26 | 0.45 | 0.24 | 0.26 | |
| 80 d | 0.20 | 0.24 | 0.32 | 0.51 | 0.10 | 0.42 | 0.11 | 0.27 | |
| 90 d | 0.07 | 0.24 | 0.17 | 0.29 | 0.03 | 0.29 | 0.16 | 0.18 | |
| MPIPAC | 0.13 | 0.19 | 0.22 | 0.40 | 0.24 | 0.42 | 0.15 | ||
| Fe | 15 d | 0.06 | 0.18 | 0.11 | 0.21 | 0.22 | 0.19 | 0.03 | 0.14 |
| 30 d | 0.20 | 0.14 | 0.15 | 0.10 | 0.15 | 0.10 | 0.11 | 0.14 | |
| 60 d | 0.07 | 0.04 | 0.07 | 0.16 | 0.15 | 0.07 | 0.03 | 0.08 | |
| 80 d | 0.14 | 0.12 | 0.00 | 0.03 | 0.11 | 0.18 | 0.31 | 0.13 | |
| 90 d | 0.25 | 0.05 | 0.21 | 0.45 | 0.17 | 0.32 | 0.58 | 0.29 | |
| MPIPAF | 0.14 | 0.11 | 0.11 | 0.19 | 0.16 | 0.17 | 0.21 | ||
| MPIG | 0.20 | 0.20 | 0.15 | 0.25 | 0.28 | 0.25 | 0.23 | ||
| Summary of plasticity | |||||||||
| Shoot growth (MPISG) | G41 > G8 > G47 > G11 > G39 > G45 > G15 | 0.26 | |||||||
| Ca content (MPIPAC) | G45 > G39 > G41 > G15 > G11 > G47 > G8 | 0.25 | |||||||
| Fe content (MPIPAF) | G47 > G39 > G45 > G41 > G8 > G11 = G15 | 0.16 | |||||||
| Overall (MPIG) | G41 > G39 = G45 > G47 > G8 = G11 > G15 | 0.22 | |||||||
G = genotype, MPI = mean plasticity index across genotypes for each shoot growth parameter or physiological age, MPISG = mean plasticity index for shoot growth for each genotype, MPIPAC = mean plasticity index for Ca content at each physiological for each genotype, MPIPAF = mean plasticity index for Fe content at each physiological for each genotype, MPIG = mean plasticity index for each genotype. Bold font indicates parameters that significantly differed (p < 0.05) between soil and soil:vermiculite substrates within each genotype.
The leaf Ca content over time was influenced by the substrate type in the clones of only two parent genotypes, for example, at day 80, G8 clones exhibited significantly more leaf Ca on S:V (1148.1 ± 113.5 mg 100 g-1 DM) than on S (780.2 ± 14.0 mg 100 g-1 DM), while the levels of Ca in the G11 clones were significantly greater on days 30, 60, and 80 (838.3 ± 68.0, 876.2 ± 163.5, and 888.2 ± 58.3, respectively) on S:V than those in the plants growing on S (430.0 ± 5.3, 486.1 ± 123.5, and 512.4 ± 0.9, respectively). Variability in genotype Ca content between substrates could be attributed to root cation exchange capacity in that certain cations, e.g. K, Mg, Na, NH4+, and H+, and even trace elements may directly or indirectly depress Ca uptake and distribution (Wallace and Mueller, 1980). In A. hybridus, Mziray et al. (2001) found that leaf Ca content did not differ amongst plants from populations grown in different field locations fed with the same concentration of chicken manure (4 kg·M-2). In three cultivars of Cichorium endivia (endive) grown under hydroponic conditions, the leaf Ca content was higher when on an organic (coconut fibre, nutrient-rich) rather than an inorganic (rockwool) substrate (Kowalczyk et al., 2015). Similarly, in this study, two genotypes (G8 and G11) produced more Ca on S:V (nutrient-poor) than on S (nutrient-rich) but only at certain ages. However, all clonal genotypes demonstrated low levels of phenotypic plasticity (MPIPAC = 0.13–0.40, Table 3) for Ca content in the tested (albeit small) sample. The MPIs for Ca content were the highest and lowest at days 15 (0.33) and 90 (0.18), respectively. As for shoot growth, there is an indication that the Ca content is not negatively affected by low nutrient soils more so at specific physiological ages. In Lactuca sativa var. capitata (lettuce) and Apium graveolens var. dulce (celery), increased nitrogen supply increased Ca content but decreased it in Brassica oleracea var. acephala (curly kale) (Pitura and Michalojć, 2015).
Variability amongst the clones of the selected parent genotypes was more pronounced for Fe than for Ca levels, at all tested days and for both tested substrates (reflected as rankings, Table 2). On S, all clones produced more Fe than their respective parents by day 15. On S:V, the same was true for G8, G11, G15, and G45, whereas the clones of G39, G41, and G47 produced similar Fe levels to those of their parents by day 15 (Table 2). As physiological age increased from days 15 to 90, the Fe levels decreased significantly in the clones of all genotypes on both substrates with the exception of G41 on S (Table 2). Similar results were reported for chickpea (Ibrikci et al., 2003). In contrast, leaf Fe content of many different field- and glasshouse-gown Amaranthus species has been found to increase with age (A. blitum, Khader and Rama, 1998; A. blitum, A. hybridus, A. hybridus var. cruentus, A. hypochondriacus, A. tricolor, and A. thunbergia, Modi, 2007; A. cruentus, Moussa et al., 2020). Khader and Rama (1998) proposed that a decrease in Fe content with age may indicate redistribution for other organ development (e.g. flowers). In this study, five to six apical leaves were collected at each harvest, and as the plants grew bigger over time, it is possible that A. dubius is similar to chickpea in that a decreased delivery of Fe to the apical leaves may be caused by the apportioning of root-absorbed nutrients to the more mature leaves (Ibrikci et al., 2003).
In this study, only the clones of G8 and G41 were not influenced by the substrate in the production of leaf Fe. All other clonal genotypes exhibited some phenotypic variability in leaf Fe levels as affected by the substrate (S or S:V), although the mean plasticity indices were higher for Ca (0.25) than for Fe (0.16) (Table 3). By day 90, G11, G15, and G47 produced significantly more Fe on the nutrient-poor substrate (4.6 ± 0.1, 5.3 ± 0.2, and 7.2 ± 0.2, respectively) than on the nutrient-rich one (3.1 ± 0.0, 2.9 ± 0.1, and 6.0 ± 0.4, respectively), while the opposite was true for G39 and G45 (8.2 ± 0.3 and 5.9 ± 0.6 on S and 6.1 ± 0.2 and 2.5 ± 0.1 on S:V, respectively). Despite the fact that Fe is one of the most abundant micronutrients in the earth’s crust, its accessibility to plant roots is very low as it relies on the soil redox potential and pH to convert insoluble Fe into a soluble form (Morrissey and Guerinot, 2009). According to Frossard et al. (2000), the development of a rooting system able to excrete protons along the root surfaces is essential in converting insoluble Fe3+ into soluble Fe2+ for its bioavailability in plants. In addition, the presence of ferritin and frataxin, proteins that sequester Fe in the cellular structures of the plant, also influences the available Fe in each plant (Morrissey and Guerinot, 2009). Mean phenotypic plasticity indices for Fe content were low and ranged from 0.11 to 0.21 for the clonal genotypes, and the MPIs for Fe content were the highest and lowest at days 90 (0.29) and 60 (0.08), respectively (Table 3). This study has indicated that the Fe levels are not negatively affected by low nutrient soils. Genotypes and their interactions with fertiliser are known to influence plant responsiveness to nutrient availability (Sossa-Vihotogbé et al., 2013; Fonge et al., 2016); other substrate minerals may have an impact on Fe uptake as reported for Vigna radiata (mung bean) (Liu et al. 2000) and Brassica napus (rapeseed) (Mendoza-Cózatl et al., 2008). In Amaranthus, the evidence to date is that the process of Fe acquisition in leafy vegetables differs amongst species. For example, Mziray et al. (2001) found that leaf Fe content did not differ amongst A. hybridus plants from different field populations and fed with the same concentration of chicken manure (4 kg·M-2), and Moussa et al. (2020) showed that leaf Fe content in A. cruentus was not affected by different urea micro-doses in the field. In lettuce and celery, increasing N doses in a greenhouse caused leaf Fe content to decrease, while it increased and then decreased in curly kale (Pitura and Michalojć, 2015).
It must be stressed that, in this study and all the cited ones, the Ca and Fe contents were determined on raw leaves, but A. dubius is ordinarily consumed after cooking. However, there are some reports that leaf Ca content is not affected by microwaving (A. dubius, A. blitum, A. polygonoides, A. spinosus, and other leafy vegetables, Amalraj and Pius, 2015). In contrast, leaf Ca and Fe content in A. hybridus reportedly decreased by boiling (Mziray et al., 2001).
In this study, there may have been unknown effects caused by the micropropagation stages, which may have affected the growth and physiology of the clones. Nonetheless, this study has shown that even within a small population of A. dubius seedlings, genotypic variability was evident for leaf number and Ca and Fe contents, and low levels of phenotypic plasticity were obtained for all tested parameters, e.g. shoot growth (0.26) > Ca content (0.25) > Fe content (0.16) (Table 3). The overall levels of plasticity for the clones of the tested genotypes were as follows: G41 (0.28) > G39 = G45 (0.25) > G47 (0.23) > G8 = G11 (0.20) > G15 (0.15), but these levels differed for each measured parameter (Table 3) with a final MPI of 0.22 for all tested parameters and genotypes. Although the study had its limitations and the detected overall levels of plasticity were low, this strategy may be potentially useful in the selection of specific genotypes, not only high yielding Ca and Fe, but also other traits of interest for subsequent ‘fixing’ of such genotypes or their incorporation into breeding programmes. Such approaches are being pursued as they may prove critical in exploring the use of A. dubius (and other African leafy vegetables) as a potential crop species for food security in parts of Africa; such approaches may prove invaluable under a deteriorating climate and environmental degradation especially in instances where access to nutritious soil is lacking.
