

Introduction
Materials and Methods
Plant Materials
Amino Acid and Protein Contents
Total Protease Activity
Sodium Dodecyl Sulfate Polyacrylamide Gel Electrophoresis (SDS-PAGE) Protein Profiles
Statistical Analysis
Results and Discussion
Fruit Fresh Weight During Fruit Development and Ripening
Amino Acid Content During Fruit Development and Ripening
Protein Content and Protease Activity During Fruit Development and Ripening
Protein Patterns During Fruit Development and Ripening
Conclusions
Introduction
The Asian pear or Korean pear (Pyrus pyrifolia Nakai) is characterized by its sweetness and juiciness. It is composed of 85–88% water, 10–13% carbohydrates, 0.3% proteins, and 0.2% lipids (Hwang et al., 2006). This fruit also contains high amounts of minerals such as Na, K, Mg, and P and constitutes one of the most popular and abundantly produced fruits in Korea. Pear fruit harvest times vary considerably among cultivars, despite the similar bloom times. The early season cultivars, such as ‘Wonhwang’, ‘Whangkeumbae’, and ‘Hanareum,’ which are harvested from late July until early September, are prone to fast ripening and softening (Yoo et al., 2002). Contrastingly, mid- or late-season cultivars, such as ‘Niitaka’, ‘Whasan,’ and ‘Manpungbae, which are harvested from mid-September to early October, have good fruit storability and slow softening (Pasquariello et al., 2013).
Pear fruit development exhibits a single sigmoidal pattern related to the increase in fruit diameter, fruit length, and fruit fresh weight. This fruit growth pattern may be divided into three major physiological stages: a rapid cell division phase and a long period of cell expansion and fruit maturation, followed by the ripening period (Jackson, 2003). Thus, cell number and cell size are determinant factors for the final size of the product, in conjunction with environmental factors. Understanding the mechanisms that regulate the final fruit size is a key step to allow the modeling of fruit growth, which may further predict fruit yield and quality.
Numerous studies have reported that the fruit growth pattern is closely associated with physiological changes. For example, the carbohydrate content is low at the initial phase of fruit development, but the sugar content increases during fruit maturation and ripening owing to starch hydrolysis (Oikawa et al., 2015). It has been reported that the activity of both cytosolic (neutral) and vacuolar (acid) invertases, which hydrolyze sucrose into glucose and fructose, increases considerably during the early stage of fruit development, resulting in the promotion of cell expansion (Klann et al., 1996; Ruan et al., 2010; Lombardo et al., 2011). Some authors found that the total phenol and flavonoid content decreased in pear (Cho et al., 2014) and apple (Malus domestica) (Zhang et al., 2010) as the fruit matured but increased in tomato (Solanum lycopersicum) (Tohge and Fernie, 2015). In addition, drastic hormonal changes occur during fruit development. Seymour et al. (2013) reported that the levels of free indole-3-acetic acid and gibberellic acid declined before the onset of ripening, whereas the abscisic acid and ethylene levels increased. Additionally, cytokinin was shown to be increased at fruit set and to stimulate cell division during the early stage of fruit development (Matsuo et al., 2012).
Regarding the dynamics of nitrogen-containing compounds, most amino acids in Navel orange (Citrus × sinensis) were found to be decreased after the cell division period but gradually increased toward maturation in Valencia orange (Citrus sinensis ‘Valencia’) (Sadka et al., 2019), with some differences depending on the specific cultivar. Similarly, Nam et al. (2016) reported that the flesh protein content at harvest time varied among the different Korean pear cultivars, being higher in ‘Niitaka’ and ‘Hanareum’ compared with ‘Chuwhang’ and ‘Wonhwang’. These authors also observed that the protein content was closely associated with the protease activity. Although some comparative studies focusing on the protein content at the ripening stage have been published, changes in fruit protein levels linked to fruit growth curves have rarely been reported.
Although fruit size is known to be larger in late-maturing cultivars than in early-maturing cultivars, the link between the genotypic differences in fruit size and the protein profile has been poorly documented. Our goal was to investigate protein and amino acid metabolism during pear fruit development and ripening, considering the fruit growth periods, to reveal possible relationships between these processes and the final fruit size.
Materials and Methods
Plant Materials
Asian pear (Pyrus pyrifolia Nakai) cultivars with different maturity periods were grown in orchards in Korea utilizing Information and Communication Technology (ICT)-based equipment, which consist of sensors to monitor soil and air temperature and moisture. Irrigation and fertilization for pear cultivation were conducted according to the standard cultivation method for pear trees of Rural Development Administration in Korea. The early-maturing cultivars ‘Whangkeumbae’ and ‘Wonhwang’ were cultivated in Naju province, Korea (34°58'19.5"N, 126°46'01.9"E) and the late-maturing cultivar ‘Niitaka’ was also grown in Naju province (34°58'34.1"N, 126°42'12.7"E). These cultivars differ in their fruit skin color at harvest maturity: the cultivar ‘Whangkeumbae’ forms yellowish-green pears; the other two cultivars produce yellowish-brown fruit. The full-bloom date was April 8 for ‘Niitaka’, April 10 for ‘Whangkeumbae’, and April 11 for ‘Wonhwang’ in 2018. The pear fruit were sampled at 15 day-intervals during the period between 57 days after full bloom (DAFB) and 147 or 177 DAFB, for the early-maturing cultivars and the late-maturing cultivar, respectively (based on the full bloom date of the ‘Niitaka’ cultivar). On each sampling date, three trees were selected to obtain three replicated samples comprising at least five fruit each. The sampled fruit were immediately weighed. After removing the core and peel, the fruit was cut into small pieces, frozen in liquid nitrogen, and stored in a deep freezer (–80°C) until use.
Amino Acid and Protein Contents
The amino acid contents were measured as described by Sun et al. (2006b), based on the ninhydrin colorimetric method. Approximately 200 mg of fresh well-ground sample was extracted by 100 mM sodium phosphate buffer (pH 7.0). After centrifugation at 12,000 × g for 10 min at 4°C, the supernatant was mixed with ninhydrin solution, boiled for 10 min, and then cooled on ice. Then, 50% ethanol was added to the reaction mixture and the absorbance was determined at 570 nm. The protein content was determined using Bradford’s reagent (Sigma), with bovine serum albumin (BSA) as the standard protein.
Total Protease Activity
The total proteolytic activity in the flesh of the pears was determined according to the method described by Sun et al. (2006a). Well-ground dried samples (300 mg) were extracted with 100 mM sodium phosphate buffer (pH 6.5) and centrifuged at 12,000 × g for 10 min at 4°C. The supernatant was mixed with 0.5% casein as a substrate and then incubated at 37°C for 4 h or 0 h for the sample blank. The reaction was terminated by the addition of trichloroacetic acid (TCA), then centrifuged at 12,000 × g for 5 min. After centrifugation, the supernatant was mixed with a 3x dilution of Folin- Ciocalteu’s reagent. The reaction was incubated at 37°C for 30 min. The absorbance was recorded at 660 nm, and calculated based on a standard curve prepared with tyrosine. One unit of protease activity was defined as the amount of enzyme required to release 1 nmol of tyrosine per min from casein.
Sodium Dodecyl Sulfate Polyacrylamide Gel Electrophoresis (SDS-PAGE) Protein Profiles
To investigate the protein profile in pears from different cultivars, SDS-PAGE was performed according to the method described by Lee et al. (2016). Approximately three µg of total proteins obtained from the pear flesh samples were loaded in each lane of a 12.5% polyacrylamide gel, electrophoresed, and stained with silver nitrate. The Precision Plus Protein Dual Color Standard (Bio-Rad) was used as a molecular weight marker.
Statistical Analysis
The experiment was performed in a completely randomized design with three replicates per cultivar at each sampling time point. Duncan’s multiple range test was used to compare means. Data were analyzed using the SAS 9.4 (SAS Institute Inc., Cary, NC, USA). Differences at p ≤ 0.05 were considered significant.
Results and Discussion
Fruit Fresh Weight During Fruit Development and Ripening
To identify the developmental stages of the pear fruit belonging to the different maturity cultivars, the fruit fresh weight was periodically determined in the early-maturing cultivars ‘Wonhwang’ and ‘Whangkeumbae’ from 57 to 147 DAFB and in the late-maturing cultivar ‘Niitaka’ from 57 to 177 DAFB (Fig. 1). All cultivars exhibited a single sigmoid growth pattern for fruit development. The largest fruit size, revealed by the highest fruit weight, was observed in the late-maturing cultivar ‘Niitaka’ at the last sampling time, followed by ‘Wonhwang’ and ‘Whangkeumbae’. This result is in agreement with previous data published by Zhang et al. (2006), who observed a positive relationship between the final fruit size and the length of the maturation period. In this regard, Zhang et al. (2005) reported that the formation of larger fruit in late-maturing cultivars is associated with a longer cell division period, which leads to higher cell numbers. In the present study, the increase in the fruit fresh weight started at 57, 72, and 87 DAFB in the ‘Whangkeumbae’, ‘Wonhwang’, and ‘Niitaka’ cultivars, respectively, indicating that the period of cell division was shorter in the early-maturing cultivars than in the late-maturing cultivar. Therefore, the larger fruit size in the late-maturing cultivar may be the consequence of the longer cell division and maturation periods.
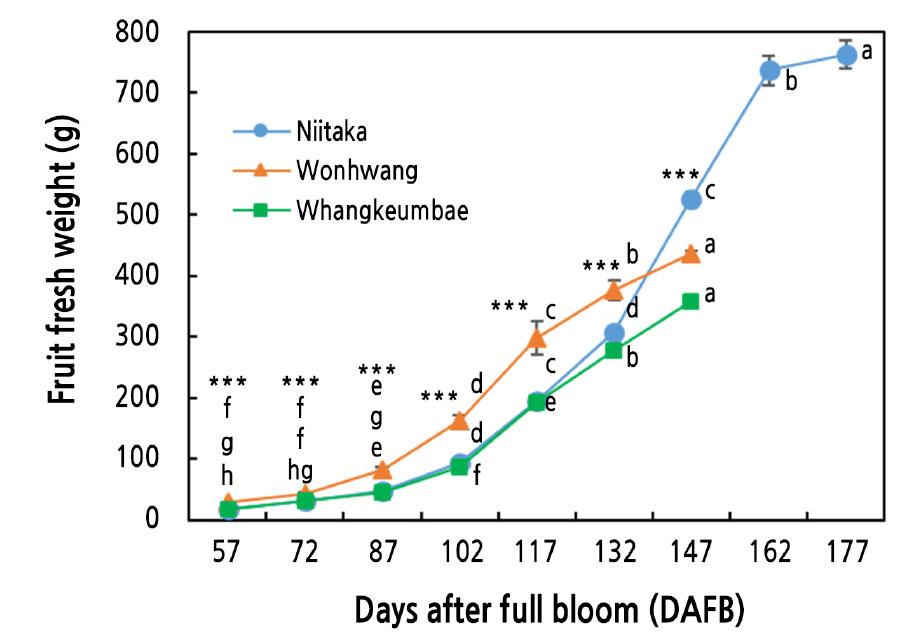
Fig. 1.
Fruit fresh weight in three Asian pear cultivars during fruit development and ripening. Values are presented as means ± SD of 15 fruit. Values marked with different letters are significantly different between stages of fruit development in each cultivar (p ≤ 0.05). Asterisks denote a statistical difference between cultivars at each sampling time (* p ≤ 0.05, ** p ≤ 0.01, *** p ≤ 0.001).
Amino Acid Content During Fruit Development and Ripening
The ‘Niitaka’ fruit exhibited the highest amino acid content at most sampling times followed by the ‘Wonhwang’ and ‘Whangkeumbae’ fruit (Fig. 2). The amino acid content in the late-maturing cultivar ‘Niitaka’ remarkably increased during the early stage of fruit development, peaked at 87 DAFB, and then gradually decreased until 177 DAFB. The amino acid content also rapidly decreased in the ‘Wonhwang’ pears between 87 and 102 DAFB and then continued to decrease at a lower rate, without significant changes. Similar results were found for peach (Prunus persica) (Lombardo et al., 2011) and apple (Zhang et al., 2010); the transient increase in the amino acid contents during the early stage of fruit development in those species was mainly attributed to the increased levels of γ-aminobutyric acid (GABA), proline, and phenylalanine. GABA involvement in the regulation of cellular pH has been reported previously (Takayama and Ezura, 2015). Likewise, it has been reported that proline promotes the expression of cyclin genes, which are related to cell division and enlargement (Wang et al., 2014a). Additionally, Lombardo et al. (2011) proposed that phenylalanine accumulated in the early stage of fruit development is used for phenylpropanoid synthesis, resulting in lignin deposition. Moreover, it was proposed that amino acid content decreases during the late stage of fruit development, and ripening may be associated with a reduced substrate flow from glycolysis (Li et al., 2016) or the use of these amino acids as energy sources (Yin et al., 2010; Lombardo et al., 2011). Our results suggest that, in Asian pear, an increased level of amino acids during the early stage of fruit development may be necessary to promote fruit development.
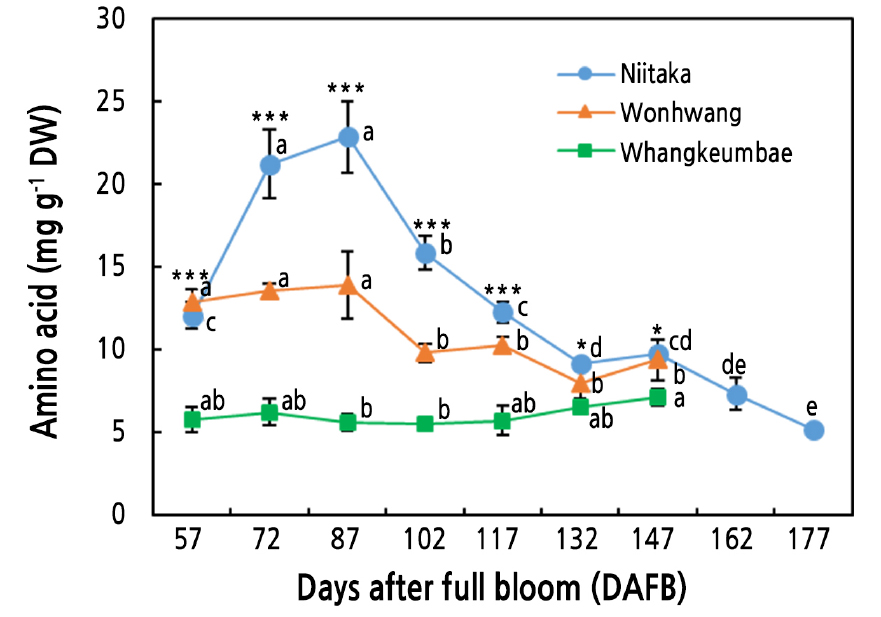
Fig. 2.
Amino acid content in three Asian pear cultivars during fruit development and ripening. Values are presented as means ± SD for n = 3. Values marked with different letters are significantly different between stages of fruit development in each cultivar (p ≤ 0.05). Asterisks denote a statistical difference between cultivars at each sampling time (* p ≤ 0.05, ** p ≤ 0.01, *** p ≤ 0.001).
Protein Content and Protease Activity During Fruit Development and Ripenin
The three Asian pear cultivars showed a sustained decrease in the fruit total protein content as the fruit matured (Fig. 3A). However, the protein content in the ‘Niitaka’ pears was higher than that in ‘Wonhwang’ and ‘Whangkeumbae’ pears. The protein content in the late-maturing cultivar ‘Niitaka’ sharply decreased up to 117 DAFB, then maintained at the same level until the last sampling date (177 DAFB). Similarly, in the ‘Wonhwang’ and ‘Whangkeumbae’ pears, the protein content decreased up to 87 DAFB and then remained stable until the last sampling date (147 DAFB). This finding is in line with previous results reported by Lombardo et al. (2011) in peach showing reductions in the protein content throughout fruit development, accompanied by increasing levels of polyphenols, which are reported as precursors for lignin biosynthesis. Additionally, this finding is consistent with previous reports documenting increases in certain enzyme activities involved in cell wall flexibility and cell expansion such as xyloglucan transglucosylase/hydrolases (XTHs) and leucine-rich repeat extensins (LRXs) (Lombardo et al., 2011; Bashline et al., 2014). Likewise, Rodriguez et al. (2019) reported that protein decreases at the early stage of fruit development might be caused by decreased protein synthesis. Our results indicate that immature pear fruit store high levels of proteins, which are mainly used for cell division and cell enlargement.
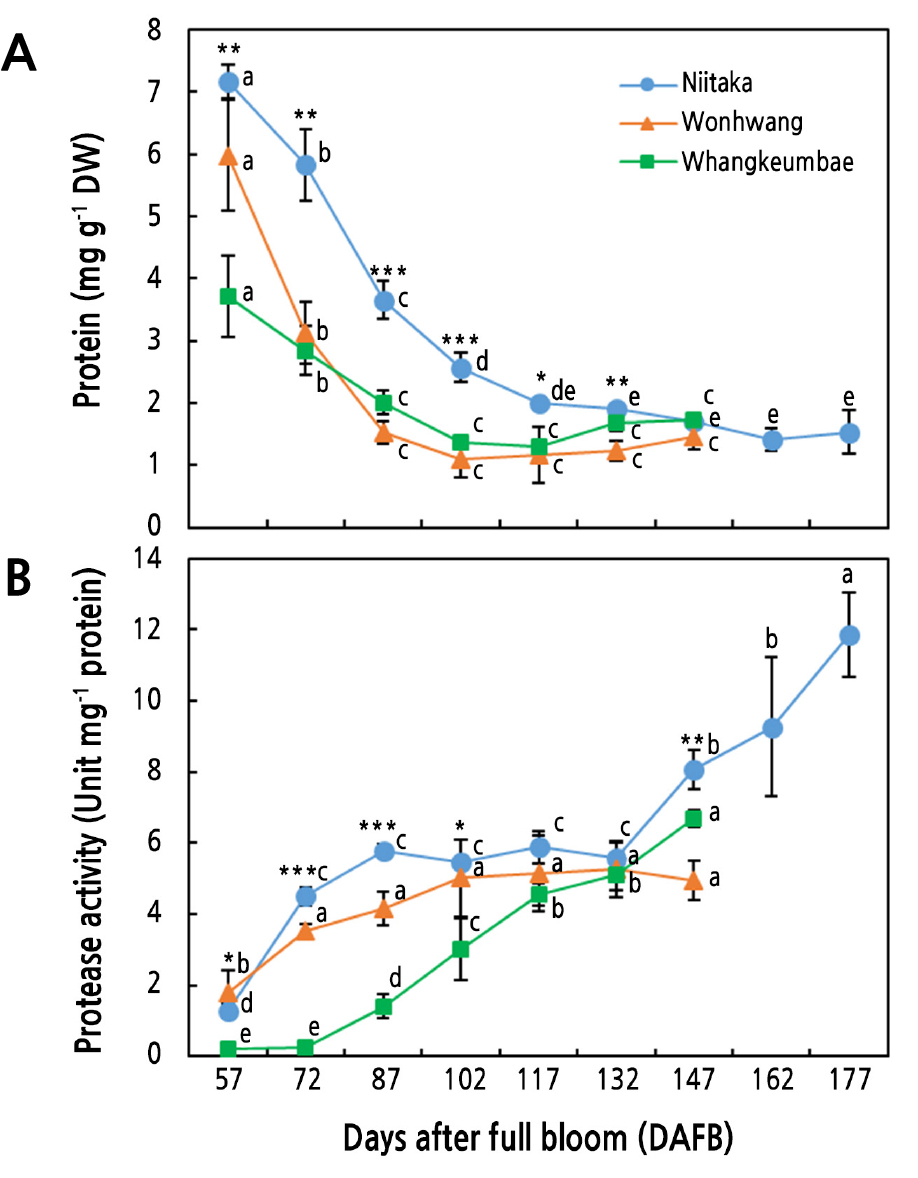
Fig. 3.
Protein content (A) and protease activity (B) in three Asian pear cultivars during fruit development and ripening. Values are presented as means ± SD for n = 3. Values marked with different letters are significantly different between stages of fruit development in each cultivar (p ≤ 0.05). Asterisks denote a statistical difference between cultivars at each sampling time (* p ≤ 0.05, ** p ≤ 0.01, *** p ≤ 0.001).
Protein decreases during fruit development and ripening coincided with protease activity increases in all pear cultivars (Fig. 3B). Protease activity in the ‘Niitaka’ pears was increased by 2.2-fold from 57 DAFB to 72 DAFB and this level was maintained to 132 DAFB. Afterword, protease activity was significantly increased by 177 DAFB. In the ‘Wonhwang’ pears, protease activity was rapidly increased by 1.5-fold at 72 DAFB with respect to 57 DAFB, and then slightly increased but not significant until 147 DAFB. The protease activity in the ‘Whangkeumbae’ pears gradually increased from 72 DAFB until the end of the sampling period. This pattern of protease activity enhancement during the early stage of fruit development has been previously described and is considered to be related to an increased demand for amino acids, which are mainly used for cell division and expansion (Lombardo et al., 2011; Lee et al., 2016). In addition, the rise in protease activity in this stage of fruit development has been associated with increased acid invertase activity, which induces the accumulation of hexoses inside vacuoles to increase fruit growth (Lombardo et al., 2011; Wongmetha et al., 2012). In contrast, proteases are considered to be involved in the softening of the cell wall structure and the activation of vacuole hydrolytic enzymes at the late stage of fruit development (Yamada et al., 2005; Wang et al., 2014b). Additionally, proteases have been reported to regulate the expression levels of the ethylene synthesis-related gene 1-aminocyclopropane- 1-carboxylic acid synthase (Matarasso et al., 2005).
Protein Patterns During Fruit Development and Ripening
Protein patterns in the fruit flesh of Asian pears were assessed by SDS-PAGE (Fig. 4). At least 8 protein bands with molecular weights ranging between 16 and 83 kDa were detected by silver staining. Based on their expression profiles, proteins were divided into three groups: up- and down-regulated proteins throughout fruit development and ripening, and highly expressed proteins at the middle stage of fruit development and ripening. It may be noted that protein bands corresponding to 35 and 53 kDa decayed in intensity from 87 DAFB, whereas the protein band associated with a molecular weight of 26 kDa strongly increased from 102 DAFB in the three pear cultivars. Additionally, three protein bands of 16, 17, and 18 kDa were remarkably expressed at the middle stage of fruit development. The protein corresponding to 50 kDa was differentially expressed in these pear cultivars: it was up-regulated in ‘Whangkeumbae’ and down-regulated in ‘Wonhwang’ as the fruit matured, whereas it was highly expressed at the middle stage in the ‘Niitaka’ pears.
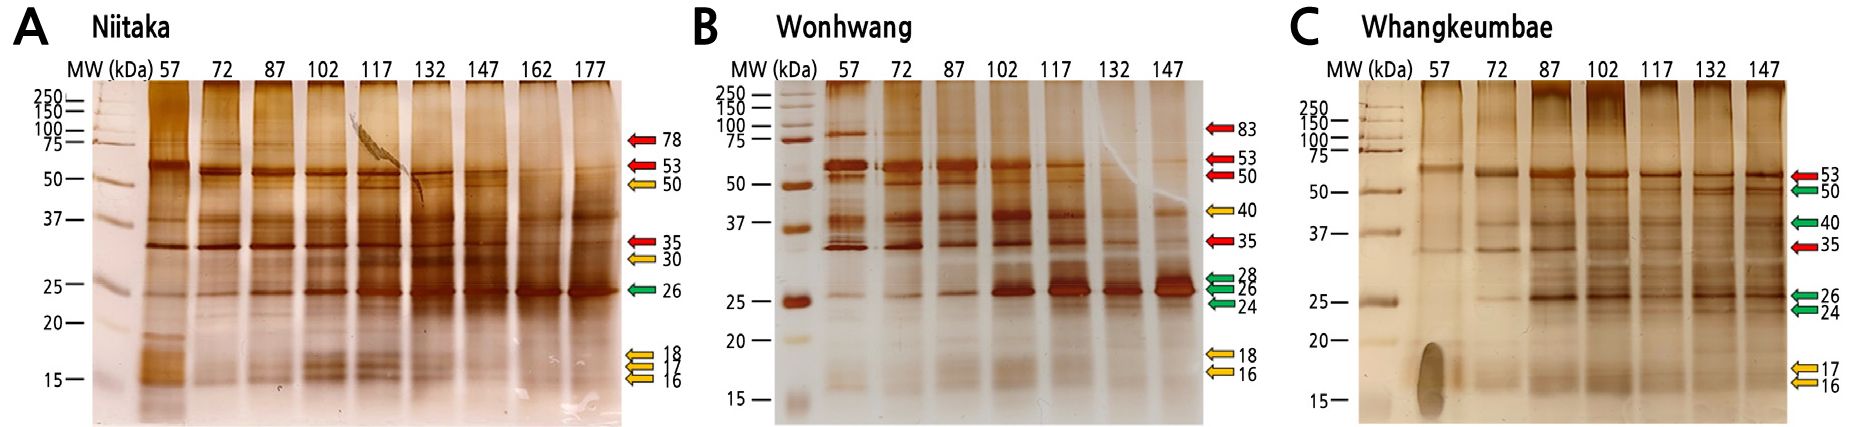
Fig. 4.
SDS-PAGE profiles of soluble proteins in three Asian pear cultivars during fruit development and ripening. (A) Niitaka, (B) Wonhwang, (C) Whangkeumbae. Equal amounts of soluble proteins (3 µg) obtained from pear flesh were subjected to SDS-PAGE and stained with silver nitrate; a molecular weight marker was included (left). Green and red arrows (right side) indicate up-regulated and down-regulated proteins during fruit development and ripening, respectively. Yellow arrows indicate highly expressed proteins at the middle stage of fruit development and ripening.
It was reported that down-regulated proteins during fruit development and ripening are mostly involved in cell division and comprise cyclin-dependent kinases, flavonoid biosynthesis-related genes, and cytokinin biosynthesis-related genes (Zhang et al., 2010; Matsuo et al., 2012; Xie et al., 2013). Up-regulated proteins are mostly involved in sugar accumulation and cell wall modification. Invertases and sucrose synthesis-related enzymes were reported to activate sugar accumulation once starch breakdown is carried out by enzymes such as α- or β-amylases. (Li et al., 2016; Ahn et al., 2019), allowing the sweetening of the ripe fruit. Additionally, the increased expression of cell wall loosing- or expansion-related enzymes such as pectin esterases and expansin was observed in apple (Li et al., 2016) and pear (Xie et al., 2013), coinciding with a loss in fruit firmness.
Conclusions
In this study, three Asian pear cultivars having different harvest maturity periods were analyzed for their protein and amino acid content during fruit development and ripening as well as for their protease activity and protein profile. We found that the final fruit weight was significantly higher in the late-maturing cultivar ‘Niitaka’ than in the early-maturing cultivars ‘Wonhwang’ and ‘Whangkeumbae’. During the early stage of fruit development, all pear cultivars showed a reduction in the protein content associated with an increased protease activity; in the late-maturing cultivar ‘Niitaka’, this enhanced protease activity led to increased amino acid content. Amino acids derived from protein degradation could be reutilized in metabolic processes associated with cell division and expansion, necessary to allow an increase in the fruit size (Malladi and Hirst, 2010; Lombardo et al., 2011; Li et al., 2016). Therefore, our results suggest that the final fruit size may be closely related to an active protein breakdown at the early stage of fruit development. Although protein patterns varied throughout the fruit developmental stages, it does not provide information regarding protein function in connection with fruit development and ripening. Further proteomic profiling during fruit development and ripening is needed to refine Asian pear growth modeling based on metabolic changes.
