

Introduction
Materials and Methods
Chemicals
Plant Material
Extraction of Targeted Bioactive Compounds from Strawberries
HPLC Conditions and Identification of Targeted Bioactive Compounds
Multivariate and Statistical Analysis
Results and Discussion
Phytochemical Detection During Strawberry Fruit Ripening
Variation due to Extraction Solvent
Ripening-Related Variation in Metabolites Among Four Cultivars
Extraction Efficiency Varied by Compound but was Optimal with 50% EtOH Overall
Distribution of Phenolic Compound Classes in Strawberry Cultivars and Breeding Lines
Anthocyanin Levels
Flavonol and Flavanol Levels
Ellagic Acid Levels
Cinnamic Acid Levels
Cinchonine Levels
The Influence of Breeding Lines on Total Phenolic Content
서 언
Strawberry, a member of the Rosaceae family that belongs to the genus Fragaria , is very popular due to its attractive fruits with unique taste, spectacular aroma, and smooth red texture. Strawberries are produced intensively in Europe and North America in open fields as well as in greenhouses in China and South Korea (Giampieri et al., 2012). The nutritional quality of strawberry fruits correlates with the remarkable abundance of phenolic compounds, including anthocyanin, flavonoids, and nutrients such as folate, vitamin C, sugars, and minerals (Forbes-Hernandez et al., 2016; Giampieri et al., 2012). Accumulation of these metabolites in strawberry fruits relates to multiple environmental and genetic factors (Carbone et al., 2000). Strawberry fruits rich in phenolic compounds can impart health benefits to humans (Giampieri et al., 2014). The characteristic phenolic compounds in strawberries are anthocyanins, which are responsible for the red flesh color, flavonols, flavanols, and derivatives of hydroxycinnamic and ellagic acid. Strawberries are the main dietary source of ellagic acid-containing compounds, such as ellagic acid and ellagitannins, which account for 51% of their total phenolic content (Häkkinen et al., 2000). The remarkable polyphenolic and antioxidant contents of strawberries (Meyers et al., 2003) improve the immune system (Somasagara et al., 2012) and reduce obesity-related disorders and the risk of heart disease (Afrin et al., 2016). Moreover, it has been shown that strawberry fruit extracts exhibit antioxidative and anticancer activities both and in vivo (Amatori et al., 2016). Consumption of strawberries has several other health benefits, such as improved eye condition, enhanced brain function, and relief from high blood pressure, arthritis, and various cardiovascular diseases (Afrin et al., 2016).
To date, several studies have been conducted to explain the relationship between fruit quality and strawberry variety (Wang and Lin, 2000), developmental stage (Wang and Lin, 2000; Winardiantika et al., 2015), degree of maturity (Kim et al., 2013; Perkins-Veazie, 2010), and extraction solvent (Tomás-Barberán and Clifford, 2000). Recently, fruit metabolomic data have been reported for tomato (Osorio et al., 2011), peach (Lombardo et al., 2011), strawberry (Zhang et al., 2011), blueberry (Chung et al., 2016; Kim et al., 2015), and grape (Zamboni et al., 2010). These comprehensive studies reveal dynamic variation in many metabolite levels, including amino acids, sugars, organic acids, and phenylpropanoids, during fruit development. Aharoni et al. (2002) identified changes in fruit metabolites during four consecutive stages (green, white, turning, and red) of strawberry fruit development using a Fourier transform ion cyclotron mass spectrometry. However, systemic quantitative metabolite profiling in different cultivars, breeding lines, and extraction solvents has not been conducted to date, even though such a study would facilitate selection of the best cultivar/breeding lines for human consumption.
Therefore, this study aimed to (i) select the best solvent for the extraction of bioactive compounds from strawberry fruits, (ii) investigate the changes in targeted bioactive compounds that contribute to the development of fruit and nutritional quality in various strawberry cultivars and breeding lines, and (iii) analyze the changes in these targeted compounds during different ripening stages. After comparing extraction solvents, we extracted targeted bioactive compounds with the most efficient solvent, 50% ethyl alcohol (EtOH). We then evaluated the qualitative and quantitative changes in the targeted bioactive compounds across strawberry genotypes and developmental stages using high-performance liquid chromatography (HPLC) and multivariate analysis. Thus, we identified genotypes with high phenolic content through a novel chemometric analysis
Materials and Methods
Chemicals
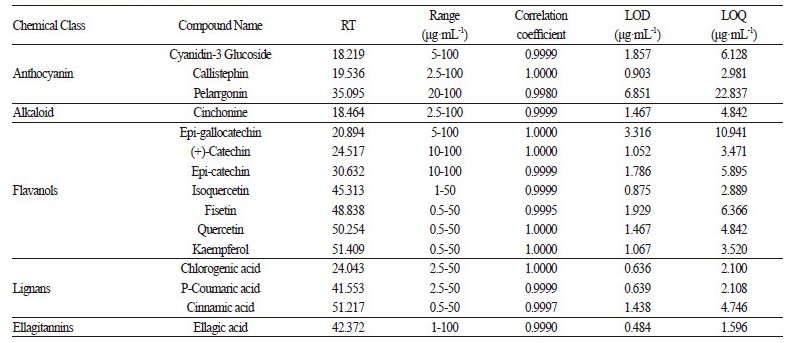
All standards used for HPLC in this study (Table 1) were purchased from either Sigma-Aldrich (St. Louis, MO, USA) or Fluka (St. Louis, MO, USA) except for cyanidin-3-glucoside, which was purchased from Biopurify Phytochemicals Ltd. (Chengdu, Sichuan, China).
Plant Material
Six strawberry cultivars and 28 breeding lines were used in this study. The six cultivars were ‘Arang’, ‘Hongsil’, ‘Maehyang’, ‘Okmae’, ‘Seolhyang’, and ‘Ssanta’, while the 28 breeding lines were numbered in sequence from SB07 to SB39 excluding SB24, SB25, SB28, SB29, and SB38. Strawberry seedlings were planted in September in a glass house compartment at the Gyeongsangnam-do Agricultural Research and Extension Service (35°N, 128°E) in South Korea.
The cultivation type was soil culture using a fertigation system in a glass house. Strawberry seedlings (crown diameter: approximately 10 mm) were transplanted onto a soil bed of 20 cm height and 10 cm width with a 17 cm space between the plants. Ventilation temperature was maintained at 26°C in day and 8°C in night. Plants were watered sufficiently using a complete nutrient solution with a conductivity level of 1.0 mS·cm-1 containing the following elements (in me∙L-1): NO3-N, 16; NH4-N, 1.34; P, 4; K, 8; Ca, 8; 4, S, 4. Fully ripened fruits were harvested in January from of all of the cultivars and breeding lines in biological triplicates. Developing fruits of five different ripening stages ([green, (G); turning red, (TR); half red, (HR); full red, (FR); and over ripened (OR)] were only harvested from ‘Arang’, ‘Hongsil’, ‘Maehyang’, and ‘Seolhyang’. Harvested fruits were immediately lyophilized in a freeze dryer after removal of calyces. The lyophilized samples were stored in vinyl bags at −20°C until analysis.
Extraction of Targeted Bioactive Compounds from Strawberries
Targeted bioactive compounds were extracted from the strawberry fruits in 95% EtOH, 50% EtOH, and water. The extraction procedure for the fruits of all cultivars and breeding lines was the same. For the extraction of bioactive compounds, one g of dried fruit was ground to a fine powder in liquid nitrogen, after which 10 mL 95% EtOH, 50% EtOH, or water were added. After sonication (UW2070; Bandelin Electronics, Berlin, Germany) for 1 h, samples were vortexed and centrifuged at 3,000 rpm for 10 min to collect the supernatant. To the pellet, 10 mL solvent was again added, and the above steps were repeated two more times. The obtained supernatants were then pooled together and adjusted to 30 mL using extraction solvent. Next, 5 mL aliquots of supernatant were taken and filtered through a 0.45 μm polyvinylidene fluoride membrane syringe filter (Agilent Co., Palo Alto, CA, USA) and used for HPLC analysis. Each measurement had three replications with three separate extractions from three different fruit samples.
HPLC Conditions and Identification of Targeted Bioactive Compounds
Bioactive compounds were separated and identified by an HPLC system equipped with an ultraviolet detector (Agilent 1100 series; Agilent Technologies, Santa Clara, CA, USA). Separation of the samples was achieved using a 5 μm Luna C18 (2) column (250 mm × 4.6 mm ID; Phenomenex, Torrance, CA, USA). The injection volume was 10 μL, and bioactive compounds were detected at 254 nm. The regression equation including the coefficient of determination (r2), range of calibration (n = 6), Limit of Detection (LOD), and Limit of Quantitation (LOQ) is described in Table 1. The mobile phase, which was composed of 0.025% formic acid in distilled water (solvent A) and 100% acetonitrile (solvent B), was applied at 0.5 mL·min-1 and a column oven temperature of 30°C. The UV absorption spectra of the standards and the samples were recorded in the range of 254 - 320 nm (slit width = 4 mm). Stock solutions of standards were prepared in methanol or 50% methanol in the range of 0.5 - 100 μg·mL-1 . Samples and standard solutions as well as the mobile phase were degassed and filtered through a 0.45 μm membrane filter (Millipore). Chromatographic operations were conducted in triplicate at 30°C. Identification and quantification of the compounds was conducted by comparison of their retention times and UV absorption spectra with those of standards.
Multivariate and Statistical Analysis
All analyses were performed at least in triplicate. For each ripening stage, a minimum of three fruits from each plant and three plants from each cultivar were used. All data were subjected to a variety of chemometric and multivariate analyses, including principal component analysis (PCA) and hierarchical clustering analysis (HCL), to identify true differences between samples. To demonstrate the relationship between different ripening stages and cultivars, PCA was conducted using the ClustVis web tool (Metsalu and Vilo, 2017). PCA scores plots were constructed by applying unit variance scaling to rows. For analysis, unit variance scaling was applied to rows, and singular value decomposition (SVD) with imputation was used to calculate the principal components. Prediction ellipses were reported with 0.95 probability. The characteristics of the strawberry bioactive compounds were evaluated using MetaboAnalyst (http://www.metaboanalyst.ca/; Xia et al., 2015) to distinguish between different solvent extractions and cultivars. Phytochemical levels were visualized with heat maps prepared using Multi Experiment Viewer (MeV; Howe et al., 2010), and different cultivars were grouped based on hierarchical clustering. Significant differences in bioactive compounds between cultivars/breeding lines were determined using one-way ANOVA followed by Dunnett's multiple comparison and mentioned in respective figure legend.
Results and Discussion
Phytochemical Detection During Strawberry Fruit Ripening
We used a targeted metabolomics approach to investigate the levels of 14 bioactive compounds in different strawberry cultivars/breeding lines (Table 1). To extract bioactive compounds, we used EtOH (Fig. 1A) because it is non-toxic, which enables EtOH-extracted bioactive compounds to be orally administered to humans after successful trails, and it is also suitable for use in food industry and consumer products. We compared EtOH-extracted bioactive compounds with water-extracted bioactive compounds to test the efficacy of both solvents. We then evaluated the qualitative and quantitative changes in the targeted bioactive compounds of different strawberry cultivars by HPLC analysis.
We initially extracted the targeted metabolites from four cultivars ‘Seolhyang’, ‘Maehyang’, ‘Arang’, and ‘Hongsil’ during five stages of strawberry fruit ripening in the three solvents (Fig. 1B). We successfully identified all of the 14 targeted bioactive compounds in strawberry except for cyanidin-3-glucoside, chlorogenic acid, and p-coumaric acid, which were not detected in any of the three solvents during the ripening stages (Fig. 1C and Suppl. Tables 2s-4s). The 11 identified metabolites included anthocyanins (callistephin and pelargonidin), alkaloids (cinchonine), flavonols (fisetin, quercetin, kaempferol, and isoquercetin), flavanols [(+)-catechin and epi-gallocatechin], ellagitannins (ellagic acid) and lignan family compounds (Suppl. Tables 2s-4s).
Variation due to Extraction Solvent
Comparison of the extracted metabolites in the three solvents revealed major quantitative and qualitative differences. Venn diagram analysis of the four cultivars during the fruit ripening stages showed eight common compounds in all three solvents with one unique metabolite in each extraction (Fig. 2A). Kaempferol was only extracted in 95% EtOH from cultivar ‘Maehyang’, while epi-gallocatechin was detected in the 50% EtOH extract of all cultivars except for ‘Seolhyang’ during the G and TR stages (Fig. 2B). Pelargonidin was only identified in water extracts of ripened fruits of ‘Seolhyang’ and ‘Hongsil’ (Fig. 1C). Isoquercetin and cinnamic acid were not detected in G fruits and only accumulated during ripening stages, indicating that these compounds might contribute to fruit quality and flavor in ripened fruits. Extracts with 50% EtOH showed a higher level of compounds during almost all ripening stages compared to the 95% EtOH and water extracts, suggesting 50% EtOH was a better solvent for the extraction of these targeted bioactive compounds from strawberry fruits.
Fig. 1.
Targeted bioactive compound extraction and abundance from different ripening stages of strawberry fruits. (A) Flow chart showing the extraction protocol for HPLC analysis. (B) Five different ripening stages of strawberry fruit. (C) Heat maps showing the relative levels of bioactive compounds (log10 scale) found in fruits of four cultivars during their ripening stages. Extractions with (1) 95% EtOH, (2) 50% EtOH and (3) water are shown in separate heat maps.
PCA efficiently extracted variability among the bioactive compounds in different solvents, ripening stages, and cultivars (Fig. 2C). The X and Y axes showed principal components 1 and 2, which explained 27.9% and 22.6% of the variance, respectively. In PCA, water- and 95% EtOH-extracted compounds overlapped each other, suggesting no major differences in extracted compounds between these two solvents. However, compounds isolated in 50% EtOH clearly separated from the other two extraction solvents, further indicating the superiority of the 50% EtOH for extraction of bioactive compounds (Fig. 2C). This could be because of the less polar nature of 95% EtOH and the highly polar nature of water. In both cases, only a few bioactive compounds with respective polarities could be extracted. However, 50% EtOH, with its moderate polarity, was able to efficiently extract bioactive compounds with a wide range of polarities.
Ripening-Related Variation in Metabolites Among Four Cultivars
PCA analyses showed major changes in the metabolite profiles of developing fruits of four cultivars. The overlap of different groups from the G to OR stage clearly indicated the transition of strawberry fruit from the young, green-colored stage to the over-ripened dark red-colored stage (Fig. 2D). Similar results were also obtained when PCA of samples obtained during different ripening stages in different extraction solvents was conducted (Suppl. Fig. 1s). Interestingly, the metabolite profile of G fruits was clearly separated in the score plots of 95% and 50% EtOH (Suppl. Fig. 2sA and 2sB), while an overlap was observed in the metabolite profiles of the ripening stages, indicating incessant accumulation of specific compounds during ripening of strawberry fruits. Callistephin, isoquercetin, and cinnamic acid increasingly accumulated during ripening (Fig. 1C), while cinchonine, ellagic acid, and quercetin showed almost no variation during the ripening process, suggesting these are basic constituents of the fruits. The four different cultivars used in this study showed no significant variation in the heat maps (Fig. 1C) and PCA score plots (Suppl. Fig. 2s). Radar plots constructed to show the concentrations of individual classes of compounds extracted in 50% EtOH ( Suppl. Table 2s) showed higher concentrations of all metabolites during the G stage (Fig. 3A-3D) except for cinnamic acid, which was exclusively found in FR and OR fruits. The sharp decline in the metabolite concentration observed during the TR stage could have been caused by the sudden increase in the fruit mass during this stage. Anthocyanins and cinchonine levels gradually increased from the TR stage to the OR stage, but there were no significant changes in the levels of flavonols and ellagic acid. The opposite trend was observed for flavanols, which were reduced by almost two fold from their initial levels in the G stage. The total anthocyanin concentration was 1.8-3 fold higher in the FR berries compared to the HR berries, which is in accordance with the results of previous studies (Pineli et al., 2011; Tulipani et al., 2011). In the case of different cultivars, the total anthocyanin concentration was highest in ‘Seolhyang’ and lowest in ‘Maehyang’. The anthocyanin profile differed in the four cultivars, but only minor changes were observed during ripening for berries of each cultivar. The concentration of total flavonols differed with cultivar, but the changes during ripening were ambiguous (Suppl. Table 2s). The flavanol concentration decreased in ‘Seolhyang’ (Fig. 3A),‘Arang’ (Fig. 3C), and ‘Hongsil’ (Fig. 3D) during ripening but remained unaffected in Maehyang (Fig. 3B). Cinnamic acid appeared only after the FR stage, and its concentrations increased with ripening. Moreover, the levels of cinnamic acid varied among cultivars. These results are consistent with previous findings in four strawberry cultivars (Olsson et al., 2004).
Fig. 2.
Variation in bioactive compounds during ripening stages and extraction condition of strawberry fruits. (A) Venn diagram showing distribution of shared and (B) common/unique bioactive compounds identified among different extraction conditions. PCA score plots showing grouping of bioactive compounds based on (C) extraction solvent and (D) ripening stage. Ellipses and shapes show clustering of the samples.
Extraction Efficiency Varied by Compound but was Optimal with 50% EtOH Overall
Our preliminary results showed that 50% EtOH was the best solvent for compound extraction from four different strawberry cultivars. This observation was further tested using the six cultivars and 28 breeding lines of strawberry (Table 1, Suppl. Table 4s and 5s). As expected, PCA (Fig. 4A) revealed a clear separation of groups for different extractions, indicating the significant effect (p < 0.05) of extraction solvent on phytochemical content. This was even more clearly articulated in the PCA loadings plot (Fig. 4B). This plot showed the influence of extraction solvent on cultivars, which contributed to the separation of different groups observed in the scores plot. Different clusters of cultivars observed in the loadings plot indicated the best solvent for the efficient extraction of phytochemicals. For example, 95% EtOH showed better extraction of compounds in ‘Seolhyang’, ‘Ssanta’, SB08, SB10, SB12, and SB21 (Fig. 4B), as these were clustered together in HCL. This was likely due to their similar targeted phytochemical content. This information could be helpful in the selection of appropriate solvents for the extraction of specific bioactive compounds from different strawberry cultivars. Further, heat maps showed the distribution of targeted bioactive compounds in different strawberry cultivars and breeding lines extracted in 95% EtOH, 50% EtOH, and water (Fig. 4C). Bioactive compound profiles have been previously reported for different cultivars (Tulipani et al., 2008), extraction procedures (Lopes-da-Silva et al., 2007), and solvents (Aaby et al., 2012). Tomás-Barberán and Clifford (2000) reported that although all the common analytical techniques for measuring ellagic acid have good accuracy and reproducibility, free ellagic acid is fairly insoluble in water, so it is easy to underestimate its content depending on the solvent used for the extraction (Tomás- Barberán and Clifford, 2000). In this experiment, the suitable extraction solvent was different depending on the polarity of the bioactive compounds in strawberry.
A comparison of metabolite profiles extracted in different solvents showed 50% EtOH as a better solvent system in the case of most of the cultivars and breeding lines, which was demonstrated in the PCA loadings plot (Fig. 4B) and heat maps [Fig. 4C(2)]. In support of these findings, the PCA score plot of the compounds identified in 50% EtOH extract (Suppl. Fig. 3sB) showed a close cluster with 76.8% total variance.
Distribution of Phenolic Compound Classes in Strawberry Cultivars and Breeding Lines
Polyphenols influence strawberry quality by contributing to both sensorial and organoleptic attributes such as color, flavor, and astringency. The main phenolic class in strawberries is anthocyanins (pelargonidin and callistephin), which are responsible for the red color, flavonols (fisetin, quercetin, kaempferol, and isoquercetin), flavanols [(+)-catechin and epi-gallocatechin], ellagitannins, and ellagic acid derivatives (Aaby et al., 2007, 2012; Kim et al., 2013).
The targeted metabolites profile of compounds in 50% EtOH extracts of 34 strawberry cultivars/breeding lines was further analyzed for total phenolic content (Table 1 and Fig. 5), which was calculated as the sum of individual compound classes and varied from 0.9 to 3.1 mg· g-1 of dry weight. One-way ANOVA showed significant differences among mean phenolic compound levels at p < 0.05. Breeding line SB08 showed significantly higher levels of phenolic compounds while SB11 showed the highest amount of alkaloids (cinchonine, 6.5 mg· g-1 of dry weight) and the second highest amount of phenolic compounds (2.9 mg· g-1 of dry weight). With the exception of SB35 and SB33, which showed the lowest amount of phenolic compounds, the cultivars contained similar levels of phenolic compounds ranging from 1.5 to 2.6 mg·g-1 of dry weight (Fig. 5). We used Dunnett's multiple competition test to compare cultivar and breeding line average phenolic compound levels with the overall average phenolic concentration (2.1 mg· g-1 of the dry weight). We found that SB08, SB11, ‘Arang’, SB09, SB10, and SB21 had significantly higher (p < 0.0001) levels of phenolic compounds, and seven breeding lines had significantly lower levels (Fig. 5). The remaining 21 cultivars or breeding lines had relatively comparable levels of phenolic compounds, including ‘Okmae’ and SB14 with relatively high (p <0.01 and p < 0.001, respectively) and SB37 and SB39 with relatively low (p < 0.001) concentrations compared to the overall average. Anthocyanins were the most abundant class of phenolic compounds in the majority of strawberry cultivars and contributed an average of 35% of the total phenolic content. The next most abundant groups were flavanols, cinnamic acid, and flavonols, which contributed approximately 30%, 20%, and 18% of the total phenolic content, respectively. The ellagic acid levels were similar in all strawberry cultivars and breeding lines and contributed approximately 10% of the total phenolic content.
Anthocyanin Levels
There were significant differences in anthocyanin content among cultivars and breeding lines. Four breeding lines, SB07, SB35, SB13, and SB19, showed very low concentrations of total anthocyanin (156, 240, 268, and 279 μg· g-1of dry weight, respectively; Table 1 and Fig. 5). Breeding line SB11 showed the highest anthocyanin concentration (1517 μg· g-1 of dry weight), followed by SB08, SB10, and SB14 (850 μg· g-1 of dry weight). The anthocyanin contents in other samples ranged from 300 to 700 μg· g-1 of dry weight with an average of 400 μg· g-1 of dry weight, which is similar to the concentrations reported previously in various strawberry cultivars (Aaby et al., 2012; Amatori et al., 2016). Among the six cultivars studied, Hongsi and Seolhyan contained the highest amount of anthocyanin (765 and 772 μg· g-1 of dry weight, respectively). Anthocyanin contents reported previously for ‘Maehyang’, ‘Seolhyang’, ‘Keumhyang’, two Japanese cultivars (‘Akihim’ and ‘Red Pear’ Kim et al., 2013), ‘Senga Sengana’ (Aaby et al., 2007), and ‘Patty’ (Tulipani et al., 2008) were lower than those calculated in the present study, possibly because of different extraction procedures. Prior to this study, the highest concentration of anthocyanin was reported in breeding line BL 2006-221 (Fredericks et al., 2013) at approximately 1,000 μg· g-1 of dry weight, which is comparable with the present study.
Fig. 3.
Distribution of phytochemical classes among strawberry cultivars and fruit ripening stages. Radar plots of four cultivars, (A) ‘Seolhyang’, (B) ‘Maehyang’, (C) ‘Arang’, and (D) ‘Hongsil’, with varied targeted compounds. Values across the axis represent the concentration (μg·g-1) of dry weight) of anthocyanins, flavonols, flavanols, cinnamic acid, ellagic acid, and cinchonine as shown in lines of respective colors.
Flavonol and Flavanol Levels
The content of total flavonols (i.e., the sum of fisetin, quercetin, isoquercetin, and kaempferol), in the strawberry samples varied from 200 to 650 μg· g-1 of dry weight with an average of 340 μg· g-1 of dry weight (Table 2). These values were higher than those reported previously for strawberry cultivars (Aaby et al., 2007; Buendía et al., 2010). Isoquercetin, fisetin, quercetin, and kaempferol were present at average levels of 208, 118, 11, and 3 μg· g-1 of dry weight, respectively. The concentration of total flavanols (i.e., ( +) - catechin) in the strawberry samples varied from 400 to 1,200 μg· g-1 of dry weight with an average of 600 μg· g-1 of dry weight. These values were much higher than the previously reported 50 μg· g-1 of dry weight Aaby et al., 2007, 2012. This could be because of our new extraction method with EtOH as the extraction solvent, which seems to be quite efficient at extracting the aforementioned phenolic compounds.
Ellagic Acid Levels
Ellagitannins are a complex family of hydrolyzable tannins found only in dicotyledonous angiosperms (Okuda et al., 2009). Ellagitannins are present at relatively high concentrations in some berries, such as raspberries, blackberries, strawberries, boysenberries, cloudberries, rose hips, and sea buckthorn (Gasperotti et al., 2010; Kähkönen et al., 2012). Recent studies reveal that ellagitannins and ellagic acid can be effectively used as treatments for breast cancer, prostate cancer, and cardiovascular and neurodegenerative disorders (Giampieri et al., 2012). In the present study, we found ellagic acid concentrations in the range of 150 to 370 μg· g-1 of dry weight with an average of 200 μg· g-1 of dry weight. These observed levels of ellagic acid in strawberry cultivars and breeding lines were approximately three- to five-fold higher than previously reported (Williner et al., 2003).
Fig. 4.
Multivariate analysis of strawberry cultivars and breeding lines to evaluate differences among extraction solvents. (A) PCA score plots showing separation of clusters by extraction solvents. (B) PCA loading plots showing the contribution of 34 cultivars and breeding lines in the separation observed in the score plots under the influence of solvents. (C) Heat maps showing the distribution of targeted bioactive compounds among different cultivars and breeding lines of strawberry. Varied levels of compounds identified in (1) 95% EtOH, (2) 50% EtOH, and (3) water extracts. Thirty-four strawberry cultivars clustered based on the levels and distribution of targeted bioactive compounds.
Cinnamic Acid Levels
Cinnamic acids are formed in the biosynthetic pathway leading to phenyl-propanoids, coumarins, lignans, isoflavonoids, flavonoids, stilbenes, aurones, anthocyanins, spermidines, and tannins (Vogt, 2010). These secondary compounds play key physiological roles in plant growth, development, reproduction, and disease resistance (Ververidis et al., 2007). Cinnamic acids are also readily available in coffee beans, tea, mate, cocoa, apples, pears, berries, citrus fruits, grapes, brassica vegetables, spinach, beetroots, artichokes, potatoes, tomatoes, celery, faba beans, and cereals. Cinnamic acid, which is an aromatic compound known for its honey-like odor, has been identified in many strawberry cultivars (Aaby et al., 2007). This compound is specific to ripened fruits and imparts a special sweet flavor. Cinnamic acid levels showed large disparities among studied cultivars and breeding lines, ranging from 170 to 680 μg· g-1 of dry weight with an average of 330 μg· g-1 of dry weight.
Cinchonine Levels
Cinchonine is an alkaloid found in the leaves of Olea europaea, Cinchona bark, and some other fruits. Cinchonine has been effectively used as an antimalarial drug (Tracy and Webster, 1996) and has inhibitory effects on human platelet aggregation (Shah et al., 1998). A recent study showed that cinchonine prevents high-fat-diet-induced obesity (Jung et al., 2012). However, there have been no previous reports of the presence of cinchonine in strawberry. Here, we reported the presence of cinchonine, a high-value, medicinally-important alkaloid, in strawberry fruits for the first time using EtOH as the extraction solvent. The concentration of cinchonine in the studied cultivars and breeding lines ranged from 785 to 6,520 μg· g-1 of dry weight with the highest concentration in the breeding line SB11 and the lowest in SB07. Levels of cinchonine varied in the remaining samples, and the overall average was 2,300 μg· g-1 of dry weight.
Fig. 5.
Concentration of targeted bioactive compounds in different strawberry cultivars and breeding lines. The results are the summation of individual compounds within each compound group analyzed by HPLC: anthocyanins (callistephin and pelargonidin); flavonols (fisetin, quercetin, kaempferol, and isoquercetin); flavanols (catechin and epi-gallocatechin); ellagitannins (ellagic acid); lignans (cinnamic acid), and alkaloids (cinchonine). The cultivars and breeding lines were arranged in increasing order of their phenolic content. The alkaloid, cinchonine, was shown in a line graph along with phenolic contents shown in a bar graph. One way ANOVA followed by Dunnett's multiple comparisons test between strawberry cultivars/ breeding lines suggested significant interaction at p <0.0001. ****p< 0.0001, ***p <0.001, **p < 0.01. NS represents no significant difference with that of average phenolic levels.
The Influence of Breeding Lines on Total Phenolic Content
Environmental and genetic factors greatly influence the quantity and composition of bioactive compounds present in strawberry (Tulipani et al., 2011; Valentinuzzi et al., 2015; Weber et al., 2017). Cultivar and culture system also significantly influence the nutritional and organopleptic quality of strawberry (Akhatou et al., 2014). Many breeding programs are designed to improve strawberry taste and disease resistance characteristics (Diamanti et al., 2012; Vicente et al., 2009). High levels of specific bioactive compounds in strawberry are achieved through cultivar selection (Fredericks et al., 2013). Three major components of fruit organoleptic quality are flavor, sweetness, and acidity (Liu et al., 2016). We examined six cultivars and 28 breeding lines for their content of targeted bioactive compounds to study the influence of breeding on enrichment of strawberry fruit flavors and taste (Figs. 4C and 5). The comparative analysis of phytochemical composition in different strawberry breeding lines helped us to screen them in a systematic manner. Overall, six breeding lines, SB21, SB10, SB09, ‘Arang’, SB11, and SB08, contained more than 2.5 mg · g-1 of targeted bioactive compounds of dry weight, which was very promising when compared to commercially successful varieties (Aaby et al., 2007, 2012; Mazur et al., 2014; Marhuenda et al., 2016).
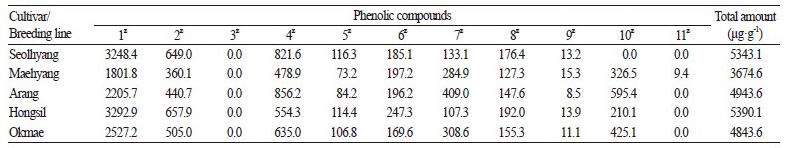
Table 2. Continued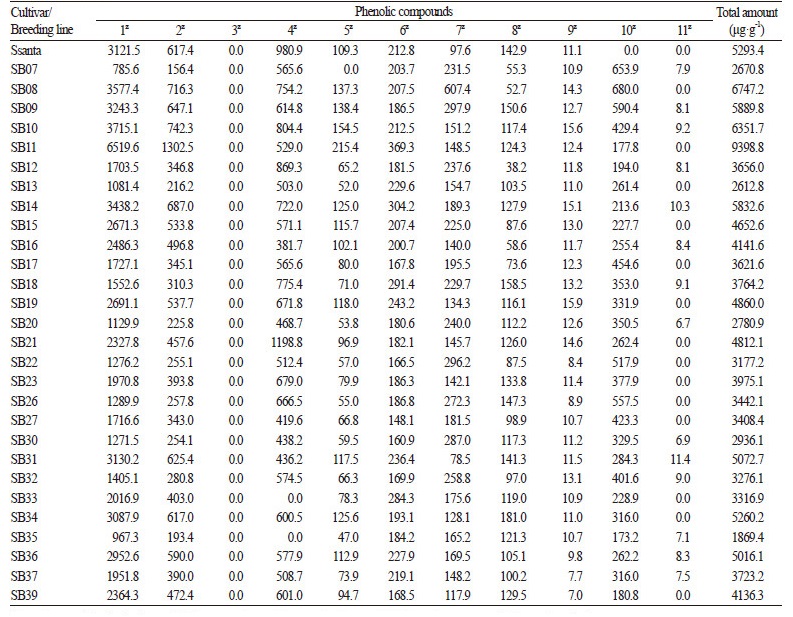 |
zSamples were identified and quantified by comparison of the retention time and UV absorption spectra with those of standards |
This study provides a simple and viable platform for the systematic investigation of different strawberry cultivars and breeding lines for their fruit quality and chemotypic relationship. We demonstrated that 50% EtOH is an efficient solvent for the extraction of targeted bioactive compounds from different strawberry cultivars and breeding lines. We evaluated variation in the targeted bioactive compounds from six strawberry cultivars and 28 breeding lines. Further, we demonstrated the developmental variation in bioactive compound content in fruits of four strawberry cultivars, which provided valuable insight into specific variation during ripening of strawberries. Taken together, we characterized strawberry cultivars and breeding lines for their discrete bioactive compounds and their variation in the process of ripening. The results presented herein will facilitate selection of the best cultivars/breeding lines for further study and human consumption.
