

Introduction
Materials and Methods
Plant Materials and Cultivation Conditions
Sample Preparation and Analysis of GSLs
Authentic Standards and Chemicals
Results and Discussion
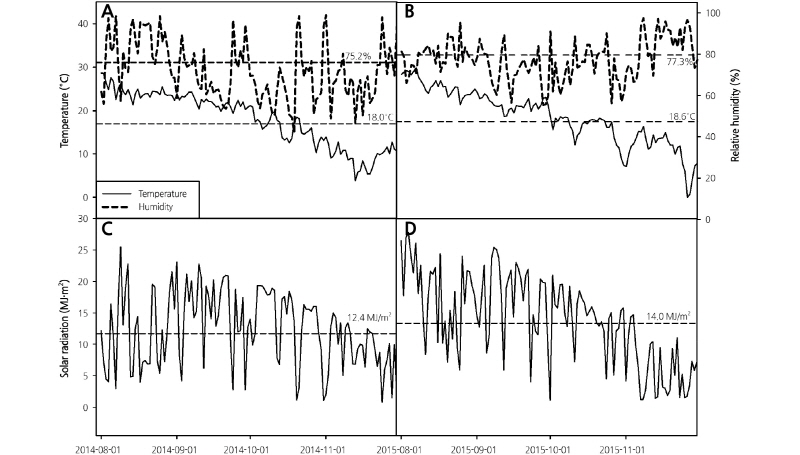
Climatic Conditions of the Cultivation Field
Yearly Variations in GSL Profiles and Content
Introduction
Glucosinolates (GSLs) are sulfur-containing secondary metabolites naturally found in Brassica vegetables, which include the thioglycoside group (Ciska et al., 2000). GSLs possess anticancer, antibacterial, antimutagenic, and antioxidative properties (Nakamura et al., 2001; Ippoushi et al., 2007).
They are responsible for the hot and pungent flavor of the plants that contain them (Fahey et al., 2001), and can also be used as pesticides and to control diseases. GSLs are generally not active by themselves, but rather show their unique activity when degraded and metabolized (Fenwick et al., 1983; Getahan and Chung, 1999). More than 200 GSLs have been reported from different Brassica crops (Halkier and Gershenzon, 2006). They are classified as aliphatic GSLs derived from methionine, aromatic GSLs derived from phenylalanine, and indolyic GSLs derived from tryptophan (Fahey et al., 2001; Clarke, 2010), depending on the type of amino acid used as a precursor. Each GSL is hydrolyzed by an enzyme called myrosinase to form isothiocyanates, thiocynates, or nitriles depending on the nature of the GSL. Each hydrolysis product exhibits various biological activities, which can benefit the health of animals and humans. Sulforaphane (1-isothiocyanato-4- methylsulphinyl-butane), a degradation product of glucoraphanin, has been identified as the most potent substance present in Brassica vegetables (Sarikamis et al., 2006). It is also known that indole-3-carbinol (I3C) and 3,3'-diindolylemethane (DIM), which are degradation products of glucobrassicin, show various anticancer activities (Bonnesen et al., 2001; Nachshon-Kedmi et al., 2004). In addition, Brassica vegetables have high antioxidative properties due to the presence of considerable amounts of various flavonoids and polyphenols, and they are gaining attention as functional foods (Cheigh and Park, 1994).
Among the green Brassica vegetables cultivated globally, broccoli (Brassica oleracea var. italica) is one of the most commonly consumed. It is highly nutritious and contains a wide range of health-promoting phytochemicals such as GSLs, vitamins, phenols, flavonoids, selenium, glutathione, and carotenoids (Sok et al., 2003; Wang et al., 2012; Bhandari and Kwak, 2015). Broccoli shows different beneficial health properties, such as anti-obesity and cholesterol-lowering effects (Lee et al., 2009), anti-inflammatory effects (Jang and Ha, 2012), anti-oxidative effects (Kim et al., 2001), and inhibition of the development of prostate (Joseph et al., 2004) and lung cancer (Spitz et al., 2000).
Environmental variation in the GSL content of Brassica vegetables, such as turnip (Ciska et al., 2000), radish (Ciska et al., 2000), rapeseed (Rosa et al., 1996), mustard (Sarwar and Kirkegaard, 1998), Chinese cabbage (Cartea et al., 2008), and broccoli (Wang et al., 2012; Jo et al., 2016) has been extensively reported, although most studies have focused on consumer health rather than plant properties (Bjorkman et al., 2011). Bjorkman et al. (2011) found that the total GSL content was elevated under moderate temperatures, high light intensities, long days, and dry conditions in spring. The authors also showed that the total GSL content was decreased under low temperatures, low light intensities, shorter days in winter. However, Rosa and Rodrigues (2001) reported that the individual and total GSL content of broccoli was higher in winter than in spring. Furthermore, Schonhof et al. (2007a) reported that the alkyl glucosinolate levels in broccoli inflorescences increased by about five to eight times at low temperatures between 7-13°C.
Several studies have been performed to understand the differences in GSL profiles and content in broccoli, including the effects of genotypic differences (Wang et al., 2012; Jo et al., 2016), developmental stages of different tissues (Perez-Balibrea et al., 2011; Lopez-Cervantes et al., 2013; Bhandari et al., 2015), growing seasons (Vallejo et al., 2003; Bhandari and Kwak, 2014), fertilization (Fabek et al., 2012), temperature (Pek et al., 2012), postharvest storage (Fernandez-Leon et al., 2013), and controlled environments (Charron and Sams, 2004). However, most studies have been limited to the effects of environmental factors on total GSL content and GSL profiles of genetic resources. Furthermore, a large global market has formed for broccoli due to the efficacy of GSLs, such that many agricultural companies are interested in cultivating high-functioning broccoli. For example, the high-functioning broccoli variety Beneforte, also known as Super Broccoli, which possesses a higher level of GSLs, was bred in the UK by Mithen (2013). However, there are limited studies on the variation of individual and total GSL content in breeding lines for high-functioning broccoli breeding, even when grown under stable environmental conditions. Therefore, this study was conducted to select superior breeding materials for the commercial cultivation of GSL-rich broccoli. To investigate the effect of yearly changes on the environmental condition on the GSL content of broccoli breeding lines, nine commercially available varieties, 16 F1 hybrids, and 17 inbred lines were grown in an open field for two years and analyzed.
Material and Methods
Plant Materials and Cultivation Conditions
Nine commercial varieties (SK3-085, Very Dome, Ace Dome, Woosu, Neahanwoosu, Yeomsu, Kanghan, Engmu, and Super Grace), 16 F1 hybrids, and 17 inbred lines of broccoli were used in this study. Seeds were obtained from different companies. The SK3-085, Woosu, Neahanwoosu, and Yeomsu seeds were obtained from Sakata Co. (Yokohama, Japan); Very Dome and Ace Dome seeds were obtained from Takii Co. (Kyoto, Japan); Kanghan and Engmu seeds were obtained from Koregon Co. (Seoul, Korea) as domestic cultivar of China; and Super Grace seeds were obtained from Taewoo Co. (Seoul, Korea). The seeds of the F1 hybrids and inbred lines were kindly provided by the Breeding Research Institute, Koregon Co., Ltd (Gimje, Korea). The seeds were sown on July 15, 2014 and July 21, 2015, and the seedlings were transplanted into the experimental field at 30 days after sowing in both years. The seedlings were grown in a greenhouse located at the Koregon Breeding Research Institute, Gimje (35°40.9’N 126°11.8’E). The climatic factors in both years were also recorded (Fig. 1). Irrigation was applied as necessary. All broccoli genotypes were harvested at their commercial stages. The inflorescences of five broccoli plants for each line were collected, sequentially freeze-dried, ground into a fine powder, and stored at -20°C for GSL analysis.
Sample Preparation and Analysis of GSLs
Samples for GSL analyses were prepared according to the method described by Lee et al. (2013). The freeze-dried powder sample (100 mg) and 70% methanol (1 mL) were added to a 2 mL tube, extracted at 70°C for 1 h and centrifuged at 10,000 × g for 20 min at 4°C. After centrifugation, the supernatant was transferred to a new tube, and the pellet was re-extracted using the same procedure. The whole supernatant was collected, and the desulfo-GSLs were prepared for quantitative determination. For this, the supernatant was loaded onto a mini Bio-spin chromatography column (Bio-Rad, Hercules, California) packed with 0.5 mL diethylaminoethyl (DEAE)-Sephadex A25 (Sigma-Aldrich, St. Louis, MO, USA) slurry, which was preactivated with 0.1 M sodium acetate (pH 4.0) (Sigma-Aldrich, St. Louis, MO, USA). The desulfation was performed using 200 µL purified aryl sulphatase (EC 3.1.6.1, type H-1 from Helix pomatia). The column was capped and left for 18 h at room temperature. The desulfo-GSLs were eluted three times with 0.5 mL of distilled water and filtered using a 0.2 µm PTFE syringe filter. A 10 µL sample was then analyzed using an Agilent 1200 High-Performance Liquid Chromatography (Agilent Technologies, Santa Clara, CA, USA) equipped with a photo diode array detector set at 229 nm, according to the method described by Bhandari et al. (2015). An Acquity UPLC BEH C18 column (1.7 µm, 2.1 × 100 mm; Waters Co., Milford, MA, USA) was used to separate the GSL peaks with a gradient elution of solvent A (100% distilled water) and solvent B (20% acetonitrile in water) at a flow rate of 0.2 mL·min-1. The gradient program was as follows: a linear step from 1-99% solvent B within 6 min, followed by a constant condition up to 14 min, and a rapid drop to 1% solvent B up to 15 min, and then isocratic conditioning of 1% solvent B up to 25 min. Pure commercial GLS standards were desulfated as in the sample preparation process, and used for the identification and quantification of individual GSL peaks, measuring the area and concentration of each peak separated by HPLC.
Authentic Standards and Chemicals
Eleven GSL standards, namely glucoiberin (IBE), progoitrin (PRO), epiprogoitrin (EPI), glucoraphanin (GRA), glucoraphenin (GRE), sinigrin (SIN), gluconapin (NAP), glucobrassicanapin (BCN), glucoerucin (ERU), glucobrassicin (BRA), and glucobarbarin (BAR) were obtained from Cfm Oskar Tropitzsch (Marktredwitz, Germany). Diethyl aminoethyl (DEAE)-Sephadex A25, and aryl sulfatase (EC 3.1.6.1, type H-1) from H. pomatia were purchased from Sigma-Aldrich (St. Louis, MO, USA). Acetonitrile (HPLC grade) and methanol (HPLC grade) were purchased from Avantor Performance Materials (Center Valley, PA, USA).
Results and Discussion
Climatic Conditions of the Cultivation Field
The climatic conditions of the cultivation field during the two years are presented in Fig. 1. The average temperature, relative humidity, and cumulative light intensity from August 1 to November 31, 2014, were 15.7°C, 72.0%, and 12.4 MJ·m-2, respectively. All three of these parameters were relatively lower in 2014 than in 2015; the average temperature, relative humidity and cumulative light intensity from September 1 to November 31, 2015, were 16.2°C, 76.7%, and 14.0 MJ·m-2, respectively (Fig. 1) (KMA, 2014, 2015). Additionally, the number of precipitation days during the cultivation period of broccoli in 2014 and 2015 was 25 and 36, respectively (data not shown). Therefore, the average relative humidity was likely higher in 2015. There were no significant differences in the average temperature and average relative humidity between 2014 and 2015, and the cumulative light intensity was higher in 2015 than in 2014 (KMA, 2014 & 2015).
Yearly Variations in GSL Profiles and Content
In total, eight desulfo-GSLs, namely IBE, PRO, EPI, SIN, GRA, ERU, NAP, and BRA were detected in the broccoli genotypes grown in 2014 and 2015 using 11 commercial standards. Among them, there were one indolyl GSL (BRA) and seven aliphatic GSLs. The GSL content and profiles were dependent on the genotype in both years and varied significantly in most cases. According to previous research, the concentrations and profiles of the GSLs not only depended on the genotypes but also on the plant part sampled and on the sampling method. Lee et al. (2012) identified six of the nine GSLs analyzed in broccoli, and Bhandari et al. (2015) reported seven GSLs in seeds, eight in sprouts, eight in shoots, and eight in roots, using 12 kinds of GSL standard materials. Thus, GSLs composition and content can vary depending on the growth stage and sample site. Similarly, genotype-dependent variation in GSL profiles and content were also observed by Wang et al. (2012) and Jo et al. (2016), who analyzed 148 and 39 broccoli genotypes, respectively. The individual GSL content found in the present study was within the range of these previous reports (Wang et al., 2012; Jo et al., 2016), which used a large number of genotypes for their studies. The major GSLs in both 2014 and 2015 were GRA, ERU, NAP, and BRA, which differed significantly between the growing years, but the pattern of GSL content among the genotypes showed a similar trend (Figs. 2 and 3). The differences in GLS content were caused by differences in several climatic factors such as temperature, rainfall, and humidity, as such variation was also reported in previous studies (Rosa et al., 1996; Charron and Shams, 2004; Cartea et al., 2008).
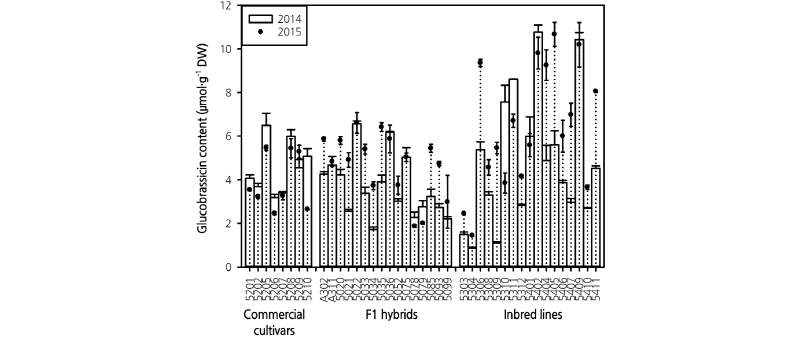
BRA, which belongs to the indole group and has robust anticancer properties (Nachshon-Kedmi et al., 2004), showed the highest levels among the GSLs tested in almost all broccoli genotypes in both 2014 (4.34 µmol·g-1 DW) and 2015 (5.24 µmol·g-1 DW). GRA showed the second highest levels in both 2014 and 2015 (Fig. 2). These results were similar to those of Jo et al. (2016) and Jeffery et al. (2003), who found BRA to be the most dominant GSL in different genotypes of broccoli. However, the current results differed from those of Rosa and Rodrigues (2001) and Lee et al. (2012), who found GRA to be the most dominant GSL. Such differential dominance of GSLs in broccoli heads might be due to variation in growing conditions and genotypes (Jeffery et al., 2003; Meyer and Adam, 2008; Wang et al., 2012; Bhandari and Kwak, 2014).
The content of BRA ranged from 0.86-10.76 µmol·g-1 DWand 1.43-10.67 µmol·g-1 DW in 2014 and 2015, respectively. Genotypes 5402 (10.76 µmol·g-1 DW) grown in 2014 and 5405 (10.67 µmol·g1 DW) grown in 2015 exhibited the highest BRA content compared to other genotypes. The maximum content was similar in both years, but the minimum content was 0.67 times higher in broccoli grown in 2015 than in 2014, Furthermore, the average content was also 0.20 times higher in 2015 than in 2014 (Fig. 2). This difference probably results from differences in light intensity; the average light intensity was higher in 2015 than in 2014, but the light intensity from October to November, the period when inflorescences are formed, was lower in 2015. The lower light intensity in 2015 was due to a higher number of precipitation days in 2015 than in 2014. Thus, the higher BRA content in 2015 might have been more significant in more genotypes if not for the increased precipitation in October (Fig. 1), as light intensity also affects the synthesis of BRA and other GSLs (Schonhof et al., 2007a). However, the difference in BRA content between the two years was significant/non-significant depending upon the genotype. In total, five F1 hybrids, A311, 5022, 5036, 5075, and 5078 and three inbred lines, 5401, 5402, and 5409 exhibited similar BRA content in both years.
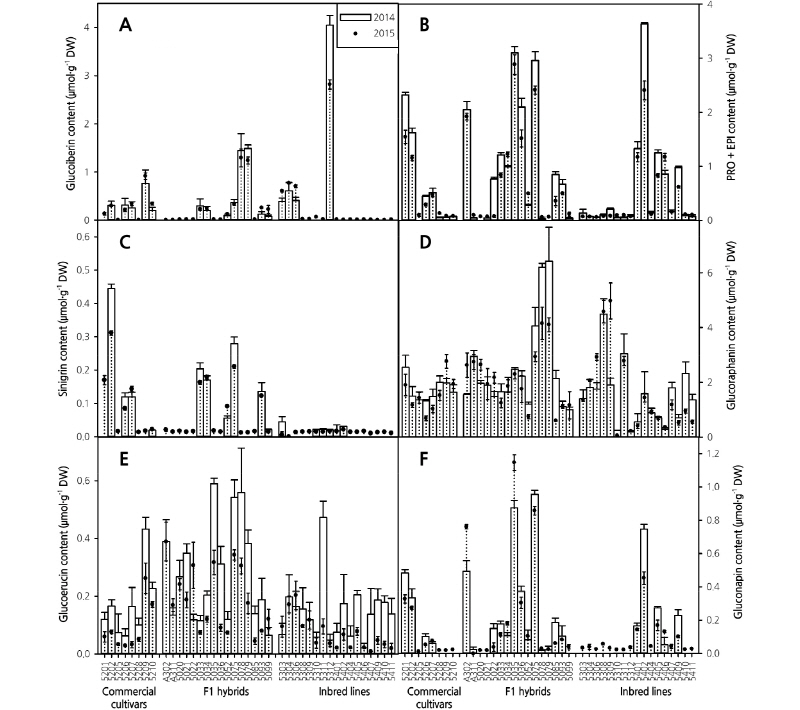
Among the seven aliphatic GSLs, GRA and ERU were most commonly found in both growing years in almost all cultivars (Fig. 3). Furthermore, the average content of GRA was the highest among the analyzed aliphatic-GSLs in both growing years (Fig. 3D). This result was similar to those reported by Jo et al. (2016), who found an average of 1.97 µmol·g-1 DW of GRA in 39 broccoli genotypes. Almost all genotypes showed a higher GRA content in 2014 than in 2015; this result might be due to the difference in temperature conditions between the two years. Steindal et al. (2013) indicated that GRA content is affected by temperature, and Schonhof et al. (2007a) found that GRA levels, including IBE in broccoli, were lower under higher temperature. In addition, studies have shown that higher concentrations of atmospheric CO2 increased the levels of GRA and IBE (Schonhof et al., 2007b). Therefore, it is possible that the levels of individual GSLs in the present study were also influenced by environmental factors, especially temperature, humidity, and rainfall. Thus, further testing of environmental factors is necessary to understand the actual effect of each environmental parameter on GSL content in broccoli genotypes.
The average GRA content was slightly lower in broccoli grown in 2015 than in 2014 in most genotypes. However, the F1 hybrids A311, 5021, 5035, 5093, and 5099 as well as inbred lines 5303, 5304, 5308, 5311, 5312, 5404, 5405, 5406, and 5409 showed similar GRA content in both years. In 2014, four genotypes, namely 5075, 5078, 5079, and 5308 (4.05-6.42 µmol·g-1 DW) exhibited relatively higher GRA content than the commercial cultivars and F1 hybrids. Similarly, genotypes 5078, 5079, 5308, and 5309 (4.10-4.97 µmol·g-1 DW) exhibited comparatively higher GRA content in 2014 (Fig. 3D). Overall, genotypes 5079 (6.42 µmol·g-1 DW) and 5309 (4.97 µmol·g-1 DW) showed the highest GRA content in 2014 and 2015, respectively. The level of GRA among different genotypes varied from 0.19-6.42 µmol·g-1 DW and 0.06-4.97 µmol·g-1 DW in 2014 and 2015, respectively.
ERU, the second most abundant aliphatic GSL, was also present in higher quantities in 2014 than in 2015 in most genotypes; its content varied from 0.02-0.58 µmol·g-1 DW and 0.01-0.39 µmol·g-1 DW in 2014 and 2015, respectively. The highest content of ERU was found in F1 hybrids 5035 and A302 in 2014 and 2015, respectively (Fig. 3E). The content of ERU was lower than that of GRA; these results are in agreement to those of Steindal et al. (2013). The genotypes A302, 5035, 5075, and 5078 exhibited higher ERU content than GRA content in both 2014 and 2015. The pattern of NAP content was genotype-dependent in both years. Eighteen genotypes did not contain any NAP in 2014, but contained a considerable amount in 2015 (Fig. 3F). F1 hybrid 5075 showed the highest GNP content in both 2014 (0.99 µmol·g -1 DW) and 2015 (0.88 µmol·g -1 DW). Among the other GSLs, the content of IBE was lower, and a similar trend was observed in both years. Only four inbred line genotypes, 5303, 5304, 5306, and 5312 contained IBE, and the highest content was observed in 5312 in both years (Fig. 3A). PRO and EPI were also detected in almost all genotypes in both years, and a relatively higher content was observed in 2014 compared to 2015 (Fig. 3B). Only three F1 hybrids (A302, 5305, and 5302) and one inbred line (5408) exhibited relatively higher content of PRO and EPI than the commercial cultivars. High PRO and EPI content in Brassica is not preferable from a consumer’s point of view, as these GSLs are responsible for a bitter taste (Fahey et al., 2001; Baik et al., 2003). Hence, genotypes that possess either low levels of PRO and EPI, or do not possess these GSLs at all, have a higher consumer demand. Furthermore, SIN was also detected at levels that were genotype-dependent in both growing years. The breakdown products of SIN are also bitter or astringent (Drewnowski and Gomez-Carneros, 2000). The genotypes in which SIN was detected in 2014 exhibited a lower level in 2015, while the other genotypes showed trace levels of SIN in 2015. Overall, most of the genotypes exhibited aliphatic GSLs at lower levels in 2015 compared to 2014. The higher aliphatic GSL content in some genotypes in 2014 was probably due to the lower average temperature in that year, as temperature plays an important role in the accumulation of phytochemicals in broccoli (Vallejo et al., 2003).
Total GSL content was also affected by the growing year, and the average level of GSL was slightly higher in broccoli grown in 2015 than in 2014 (2014: 7.66 µmol·g-1 DW; 2015; 8.18 µmol·g-1 DW) in most of the genotypes, but the difference was not significant (Fig. 4). The total GSL content was highest in genotype 5402 in both years (2014: 16.99 µmol·g-1 DW; 2015: 14.20 µmol·g-1 DW). Genotype 5309 (3.32 µmol·g1 DW) showed the lowest GSL content in 2014, but this value increased approximately 3.2 fold (10.69 µmol·g-1 DW) in 2015 (Fig. 4). After comparing individual GSL contents in 2014 and 2015, we selected the three genotypes with the highest GRA contents: 5078, 5079, and 5308 (2014: 6.19, 6.42, and 4.49 µmol·g-1 DW; 2015: 4.15, 4.10, and 4.58 µmol·g-1 DW, respectively), and the two genotypes with the highest BRA contents: 5402 and 5409 (2014: 10.76 and 10.43 µmol·g-1 DW; 2015: 9.80 and 10.19 µmol·g-1 DW, respectively). In addition, individual GSLs such as IBE, NAP, and ERU were found at low levels in broccoli, and our annual analysis showed that this is the case in a number of genotypes. Furthermore, genotypes that exhibited high GSL contents in both 2014 and 2015 were identified. Finally, the four genotypes 5078, 5079, 5308, and 5409, which had high levels of GRA and BRA, low levels of PRO and EPI, and stable content over the two years were selected. These selected lines may promising as functional broccoli breeding materials in the future (Table 1).
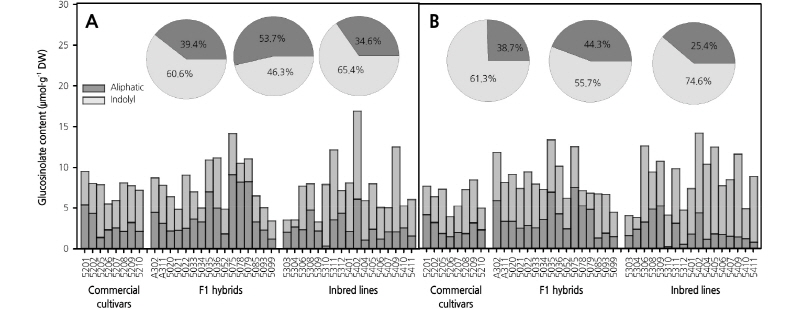
Table 1. Individual and total GSL contents in floral parts of selected breeding lines cultivated in 2014 and 2015
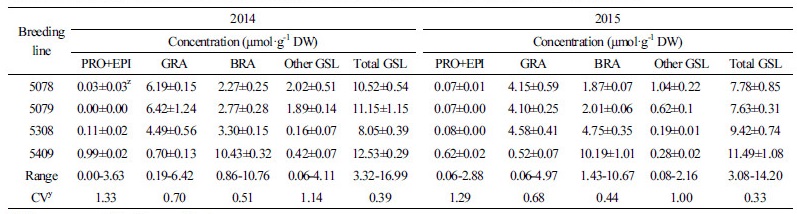 | |
zValues are mean ± SD of three replications. yCoefficient of variation. | |
In conclusion, this study summarizes the variation in individual GSLs as well as total GSL content among a number of broccoli breeding lines grown over two years. BRA was the most dominant GSL, followed by GRA, regardless of genotype or growing year. Only four genotypes, two F1 hybrids (5078 and 5079) and two inbred lines (5308 and 5409), exhibited either a high GRA or BRA content in both growing years with varied climatic conditions; these lines could be used as a genetic resource for commercialization in the future.
