

Introduction
Materials and Methods
Experimental Site
Plant Material
Analysis of Soluble Sugar
Measurement of Atmosphere and Soil Conditions in the Pear Orchard
Statistical Analysis
Results
Accumulation Pattern of Soluble Sugars
Measurement of Environmental Factors Over the Two Years
Difference in Meteorological Variables between the Two Years
Multiple Correlation Analysis
Discussion
Introduction
According to the Korea Meteorological Administration, the average temperature nationwide in summer 2018 was 25.4°C, the highest recorded since 1973. This anomalous heat wave was strongly affected by high atmospheric pressure from Tibet and the North Pacific anticyclone. However, in summer 2019, the extension of the North Pacific anticyclone to the Korean peninsula was delayed by frequent inflows of cold air from the northern Bering Sea, resulting in fewer heat waves than those in summer 2018.
The global changes in climate have largely been attributed to increased CO2 emissions and human activities (Masson- Delmotte et al., 2018). The global mean surface temperature has increased by approximately 1°C above the average in the pre-industrial era (1,850-1,900). Global warming is estimated to increase by 0.2°C per decade owing to ongoing anthropogenic emissions (greenhouse gases). Over the coming decades, climate change and increased CO2 levels are projected to impact the yield of all crops (Lobell and Gourdji, 2012; Sultan et al., 2019).
Extreme high temperatures owing to global warming caused a drastic reduction in the yield of pome fruit (Thomson et al., 2014; Darbyshire et al., 2015). Extreme high temperature, which occurs during summer seasons, can adversely affect the quality of pome fruit through sunburn damage (Schrader et al., 2003; McClymont et al., 2016), poor color development (Steyn et al., 2004; Thomson et al., 2018), and reduced carbon assimilation (Han et al., 2012). In addition, extreme heat may result in increased insect pests and disease incidence (Rosenzweig et al., 2001). In recent years, pear orchards have frequently experienced weather conditions that have compromised the quantity and quality of the fruit.
Many previous studies have focused on the relationship between the content of soluble sugars and the gene expression and enzyme activities involved in the sugar metabolism during the developmental stages of pear fruit (Moriguchi et al., 1992; Tanase and Yamaki, 2000; Yamada et al., 2007; Zhang et al., 2014; Jia et al., 2021; Lee et al., 2021). However, to date, there is little research on the impact of climate change on the accumulation patterns and composition of soluble sugars during the developmental stages of pear fruit through comparisons of annual meteorological variables.
In this study, we aimed to identify whether differences in fruit sugar composition are related to changes in atmospheric and soil conditions observed over the two years. We investigated the content of three major soluble sugars (glucose, fructose, and sucrose) and their accumulation patterns throughout the developmental stages of pear fruit and collected atmospheric and soil environmental data during the growing seasons of 2018 and 2019 through real-time sensor-based monitoring. Therefore, the results obtained may provide a better understanding of the impacts of climate change on the sugar composition of pear fruit.
Materials and Methods
Experimental Site
This study was conducted at a pear orchard (34°58'34.1"N 126°42'12.7"E; 25-30 m above sea level; 0.83 ha) utilizing Information and Communication Technology (ICT)-based equipment, located in Naju, Korea.
Plant Material
Pear (Pyrus pyrifolia) cv. Niitaka fruit were harvested throughout two successive seasons (2018 and 2019) from the pear orchard, which received standard horticultural management including fertilizer application, irrigation, and disease control. Between 10 and 15 fruit were randomly sampled from the same fruit-bearing position at 15-day intervals during the period of 42 to 177 days after full bloom (DAFB) in each year. The fruit collected at each sampling period were frozen in liquid nitrogen and then stored at -60°C until analyzed. Unless otherwise stated, all experiments were performed independently and in triplicate.
Analysis of Soluble Sugar
The stored samples were freeze-dried and then ground into a fine powder. Soluble sugars were extracted from 30 mg of the powdered samples with occasional shaking for 3 hours in 3 mL of distilled water. The extracts were centrifuged at 13,000 × g for 5 min. The supernatants were passed through a 0.45 µm membrane filter and then injected into the chromatographic system. Soluble sugars were analyzed using high-performance liquid chromatography equipped with a refractive index detector (2414, Waters, MA, USA) and a REZEX RPM (Phenomenex, CA, USA) column (300 × 7.8 mm).
Measurement of Atmosphere and Soil Conditions in the Pear Orchard
Meteorological data were recorded automatically on a data logger (Xspark, Nare Trend Inc., Korea) at 5-min intervals. Soil temperature and soil moisture were measured at a 15-cm depth using Hydra Probe II soil sensors (SDI-12, Stevens Water Monitoring System Inc., OR, USA). The daily mean values of temperature, atmospheric humidity, and solar insolation were calculated during the period of 80 to 180 DAFB in 2018 and 2019. The mean daily values were determined by calculating the average of all the 5-min interval values for each day. Daily mean temperature and humidity values for soil were calculated during the same period using similar metrics.
Statistical Analysis
To confirm whether there was a difference in the meteorological data over the two years, we compared the meteorological data measured prior to 147 DAFB, when the difference in the contents of fructose and sucrose occurred, at 15-day intervals. That is, t-1, t-2, t-3, t-4, and t-5 indicate 15, 30, 45, 60, or 75 days before 147 DAFB, respectively. For meteorological data at 15-day intervals, we used 15 observations per time interval, and each observation was assumed to be independent. Seven meteorological variables—air temperature, atmospheric humidity, accumulated temperature, diurnal temperature range, solar insolation, soil temperature, and soil humidity—were analyzed.
All analyses were performed using python (version 3.8.3). Pearson correlation analysis, Shapiro-Wilk test, T-test, and Wilcoxon signed-rank test were performed in the python packages “scipy” (version 1.6.1). Normality of the meteorological data for each time interval was assessed using the Shapiro–Wilk test of normality (α= 0.05) (Shapiro and Wilk, 1965). T-tests were conducted when the distribution of both groups satisfied normality (when the value of the Shapiro-Wilks test for both groups is greater than 0.05). However, if normality is not valid (when the value of the Shapiro-Wilks test is less than 0.05 in either or both groups), the Wilcoxon signed-rank tests were performed (Wilcoxon, 1945). The significance level was set to 0.05.
Results
Accumulation Pattern of Soluble Sugars
As illustrated in Fig. 1A, a steady increase in the content of total soluble sugars occurred during the period from 87 to 147 DAFB, and then remained at a high level until maturity. We noted a difference in the accumulation of total soluble sugars between the two years; their contents were higher in 2019 than in 2018 during the period from 87 to 132 DAFB. There was no significant difference in glucose accumulation between the two years. In both years, a negligible amount of glucose was detected during the period from 42 to 72 DAFB, but thereafter, the glucose content increased gradually until maturity (Fig. 1B). However, the accumulation pattern of fructose and sucrose during the two years differed from that of glucose; differences in fructose and sucrose contents were observed between the two years at the maturation stage of pear fruit. In both years, the fructose content steadily increased during the period from 87 to 147 DAFB and then remained at the highest level until maturity, with little fluctuation (Fig. 1C). A notable difference in the fructose content was observed in mature fruit harvested at 177 DAFB, with contents of 247.27 mg·g-1 DW and 355.3 mg·g-1 DW in 2018 and 2019, respectively. In 2018, no sucrose was detected during the period from 42 to 87 DAFB, but thereafter, the sucrose content increased gradually until 132 DAFB, followed by a rapid increase from 132 DAFB until maturity, accounting for about 36.13% of the total soluble sugars (Fig. 1D). The sucrose accumulation after 87 DAFB differed between the two years; the sucrose content at maturation in 2018 was about 1.8-fold higher than that observed in 2019.
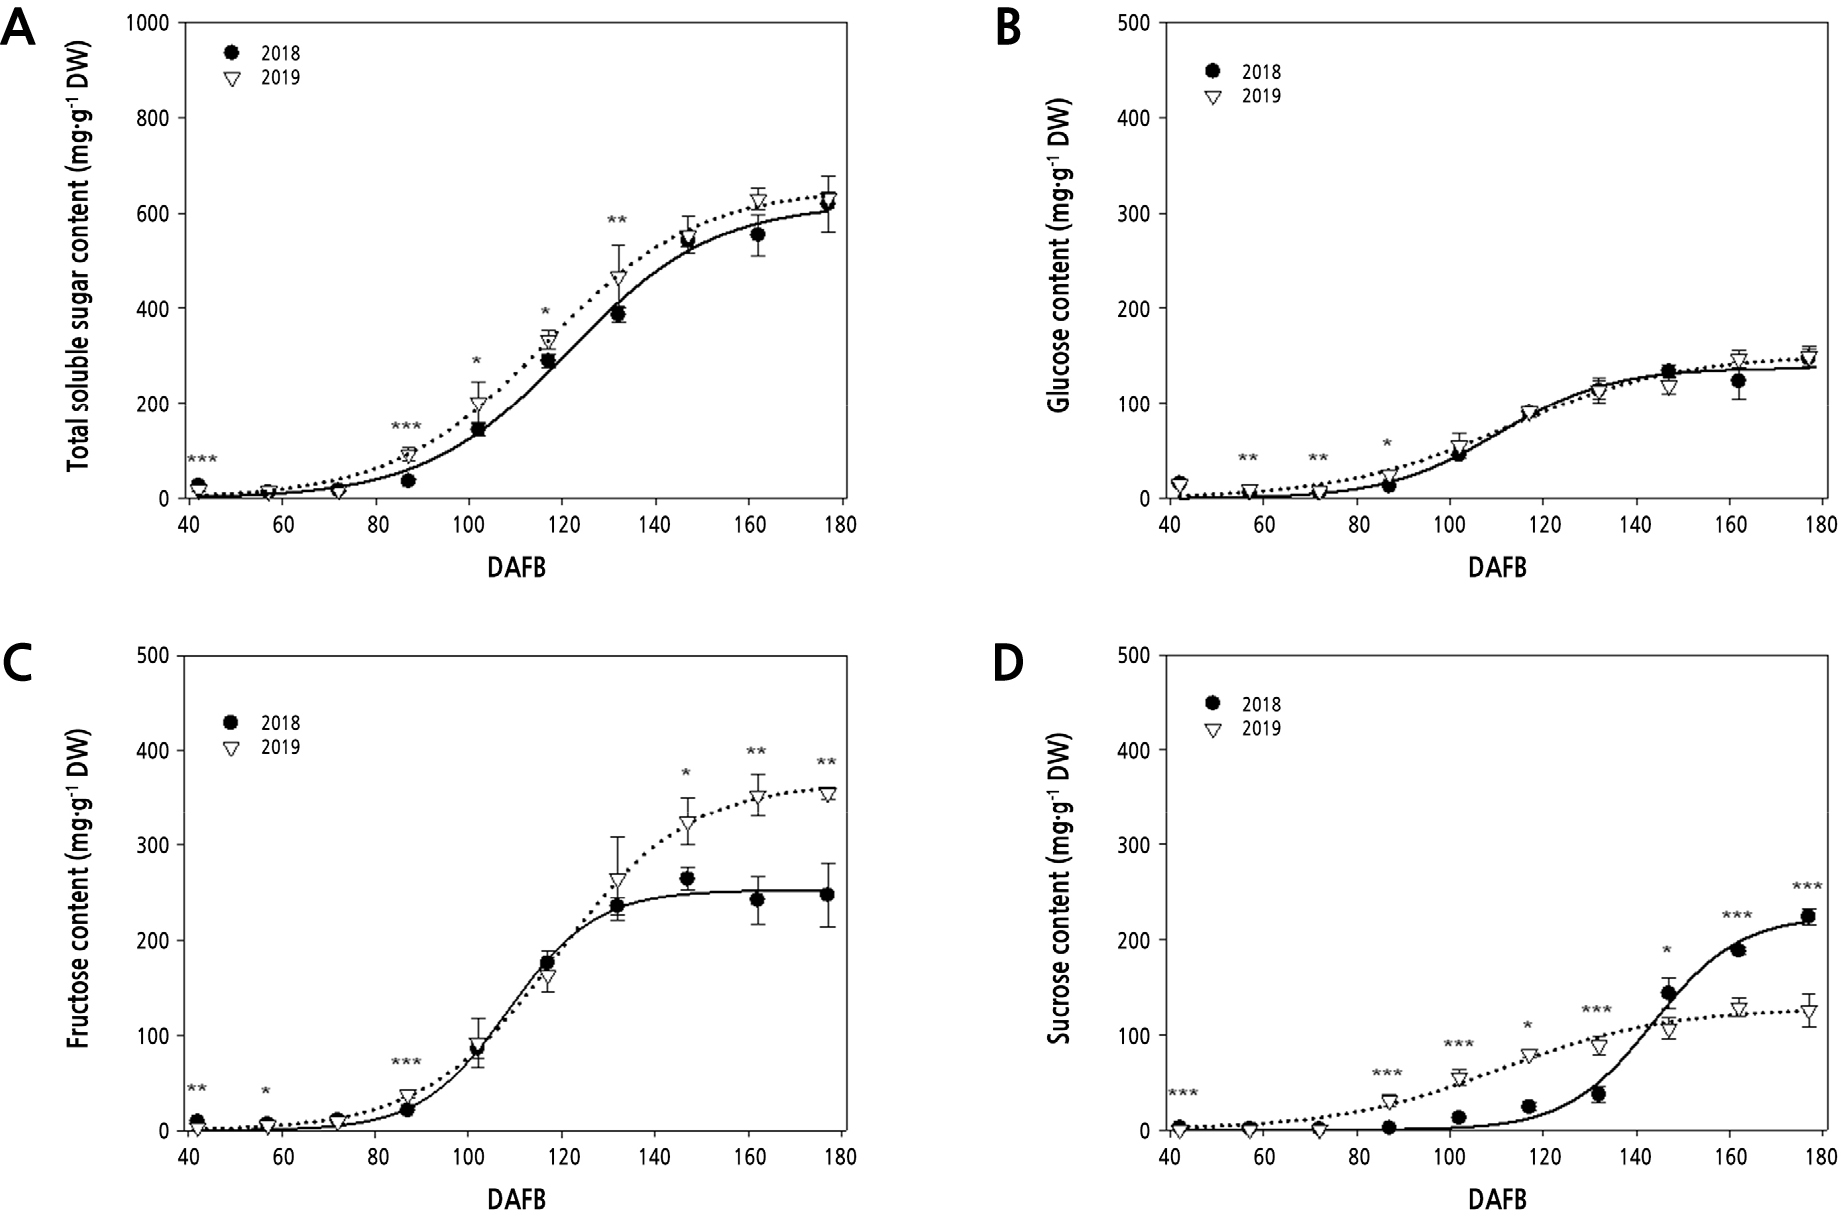
Fig. 1.
Changes in the soluble sugar content during pear fruit development. Measurements were taken at 15-day intervals during the period from 42 to 177 days after full bloom (DAFB) in 2018 (closed circles) and 2019 (open reversed triangles). The solid line represents a smooth trend line for the data points in 2018. The dotted line represents a smooth trend line for the data points in 2019. (A) Total soluble sugars. (B) Glucose. (C) Fructose. (D) Sucrose. Values represent the mean ± SD of three replicates. Asterisks indicate a significant difference at each sampling time. * p < 0.05, ** p < 0.01, *** p < 0.001.
Measurement of Environmental Factors Over the Two Years
Climate data were collected over the two years from multiple sensors installed in the pear orchard with an applied ICT-based platform. Similar patterns in both air temperature and humidity were observed for both years; however, average daily temperatures from late-June to mid-August (73-132 DAFB) varied, with a mean temperature 2°C higher in 2018 (26.3°C) than in 2019 (24.3°C) (Fig. 2A). The mean diurnal temperature range over the same period was 1.4°C higher in 2018 (7.8°C) than in 2019 (6.4°C). The mean air humidity values from late-June to mid-August were 82.2% and 89.7% in 2018 and 2019, respectively, with values ranging from 66.5 to 94.2% in 2018 and 77.7 to 96.0% in 2019 (Fig. 2C). The total accumulated temperature from late-June to mid-August was calculated as 1373.6°C in 2018 and 1277.5°C in 2019; the accumulated temperature in 2018 was 96.1°C greater than that in 2019 (Fig. 2B). In the comparison of average solar insolation from late-June to mid-August, the mean value was 0.7 kWh/m2 higher in 2018 (7.4 kWh/m2) than in 2019 (6.7 kWh/m2) (Fig. 2D).
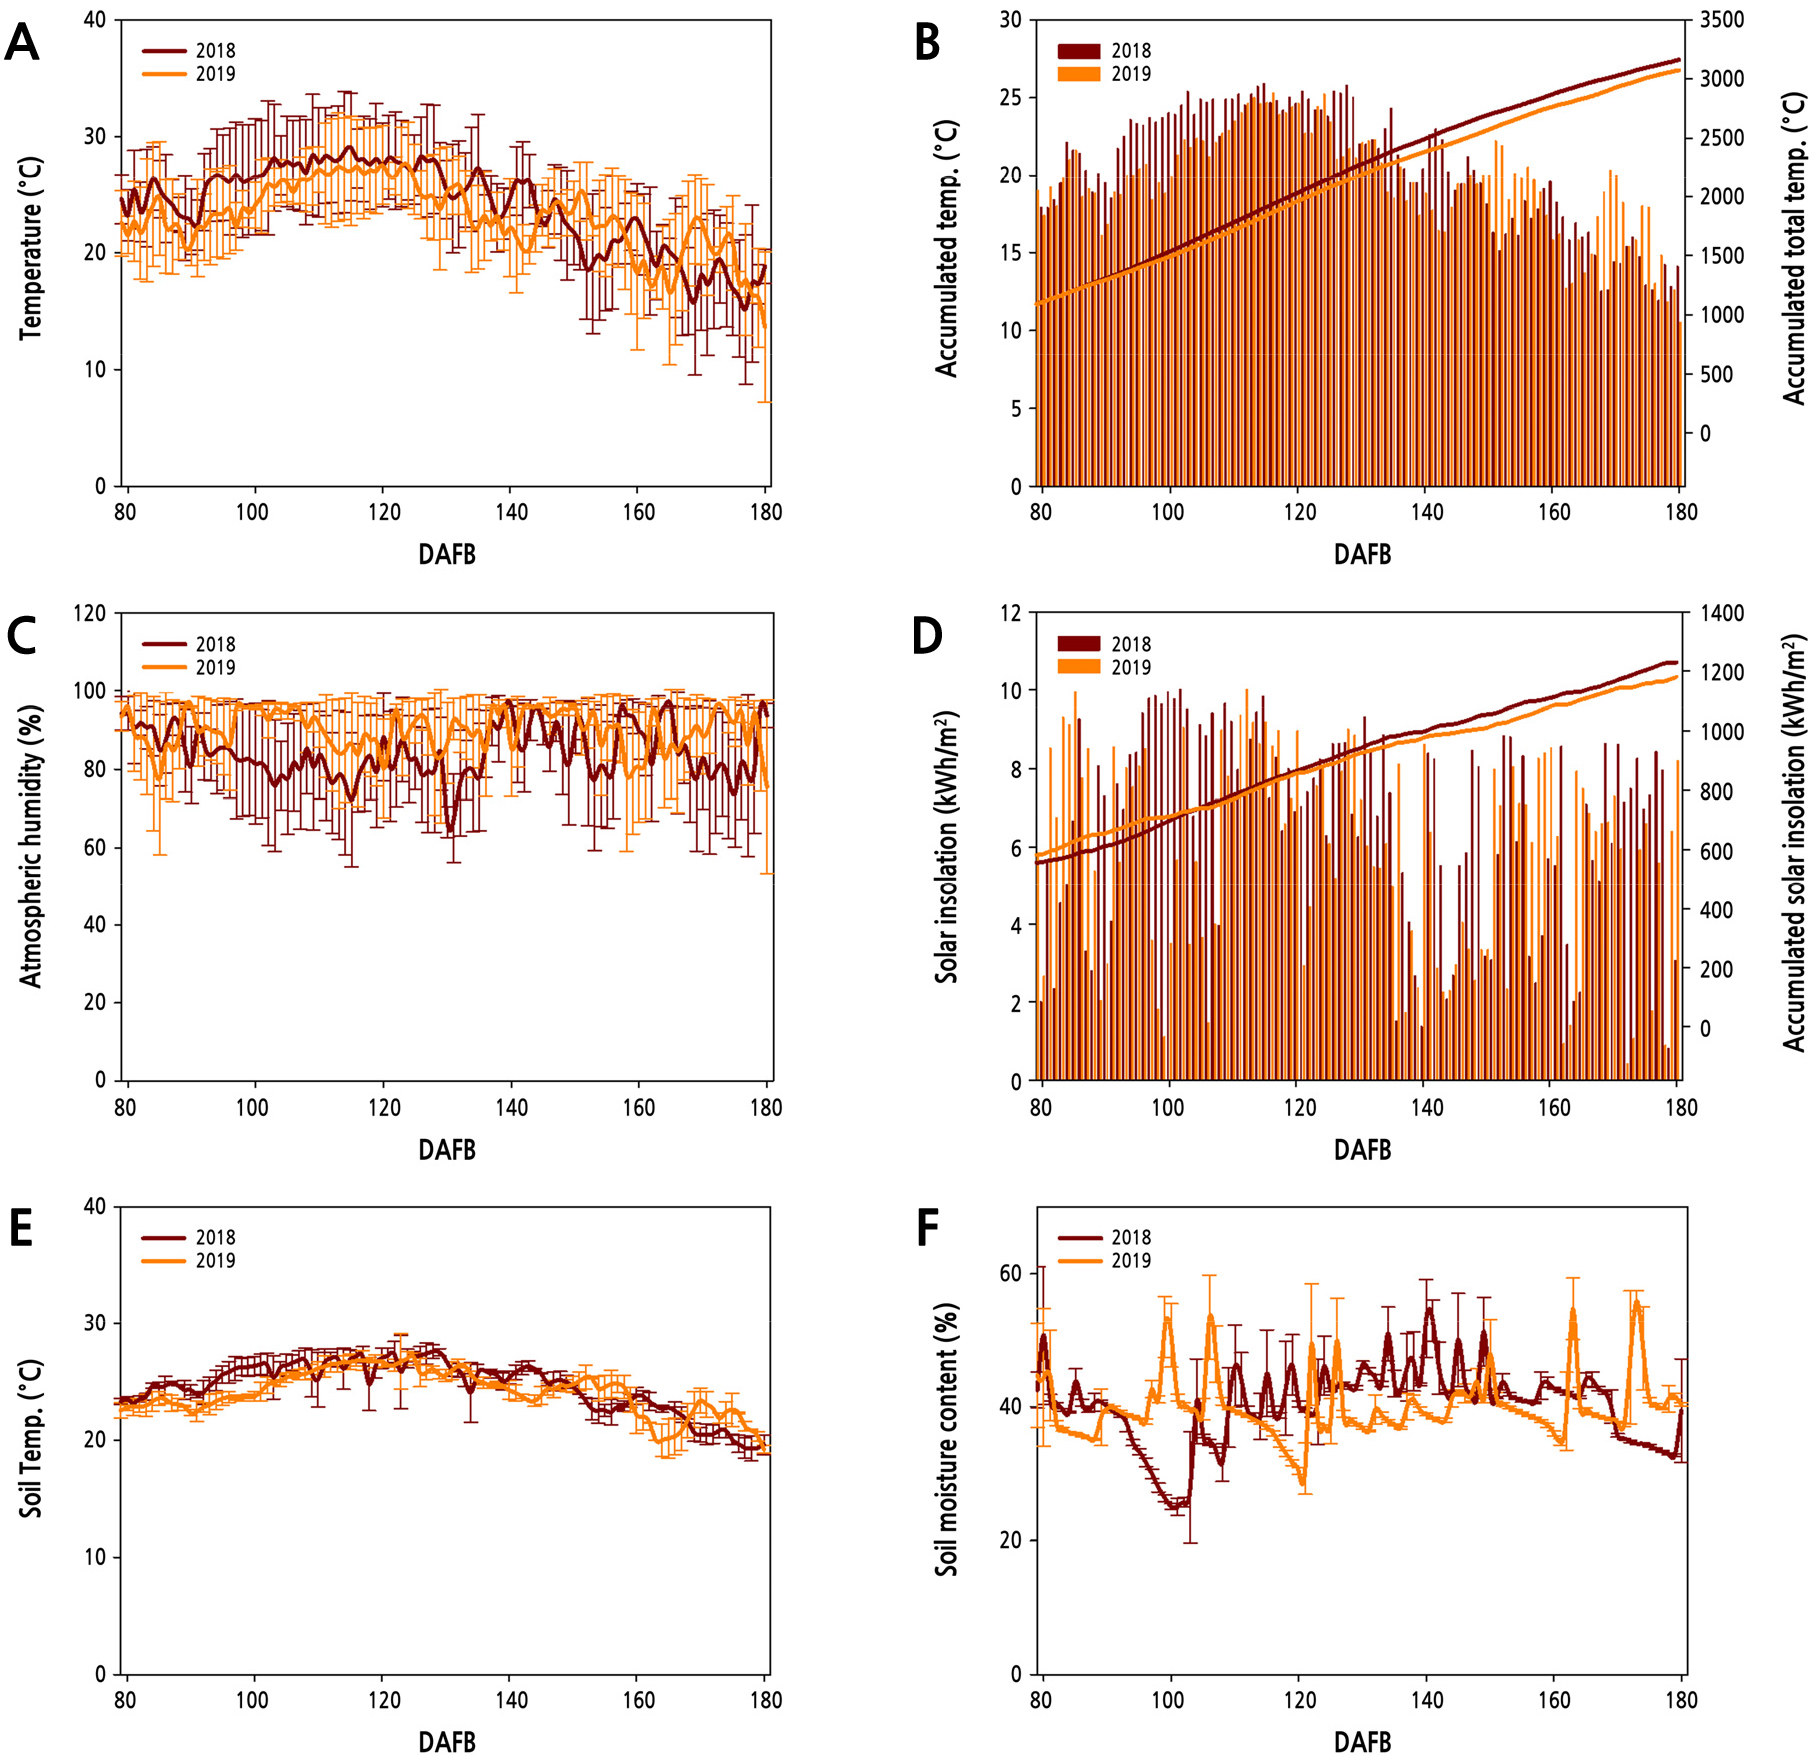
Fig. 2.
Seasonal patterns of (A) temperature, (B) accumulated temperature, (C) atmospheric humidity, (D) solar insolation, (E) soil temperature, and (F) soil moisture content from 2018 to 2019 at the study site. Each value represents a daily observation during the period from 80 to 180 days after full bloom (DAFB) in 2018 (solid maroon line) and 2019 (solid orange line). Values represent the mean ± SD.
No perceptible difference was observed in the seasonal patterns of soil temperatures between the two years. However, the average daily soil temperature from late-June to mid-August was 1.1°C higher in 2018 than in 2019 (Fig. 2E). In addition, the deviation of daily mean temperatures was about 0.2°C higher in 2018 than in 2019. Soil moisture was measured daily over the two years, and a greater fluctuation was observed in soil moisture than in soil temperature (Fig. 2F). However, the average daily soil moisture value over the same period was similar between the two years.
Difference in Meteorological Variables between the Two Years
Over the two years, we compared meteorological data measured prior to 147 DAFB at 15-day intervals (t-1-t-5) as depicted in Table 1 and visualized using a box plot (Fig. 3). For air temperature, all values were higher (p < 0.05) in 2018 than in 2019 from t-5 to t-1. There was no significant difference in atmospheric humidity between the two years at t-5, but the values of atmospheric humidity from t-4 to t-1 in 2019 were significantly higher (p < 0.05) than those in 2018. Further, the accumulated temperature values showed no difference between the two years at t-5, but those from t-4 to t-1 in 2018 were higher (p < 0.05) than those in 2019. For soil temperature, all values were higher (p < 0.05) in 2018 than in 2019. However, the values of other meteorological variables, such as diurnal temperature range, solar insolation, and soil moisture, were not biased to a particular year, showing no consistent pattern.
Table 1.
Comparison of meteorological variables for each time difference at 15-day intervals between 2018 and 2019
| Meteorological variables | Time interval | Mean ± SD (2018) | Mean ± SD (2019) | p value | comparison |
| Temperaturez | t-5 | 24.379 ± 1.026 | 22.304 ± 1.179 | < 0.001* | 18 > 19 |
| Temperaturey | t-4 | 25.219 ± 1.597 | 22.774 ± 1.168 | < 0.001* | 18 > 19 |
| Temperaturez | t-3 | 27.946 ± 0.530 | 26.515 ± 0.645 | < 0.001* | 18 > 19 |
| Temperaturey | t-2 | 27.391 ± 1.003 | 26.132 ± 1.176 | < 0.001* | 18 > 19 |
| Temperaturez | t-1 | 24.904 ± 1.406 | 22.543 ± 1.421 | < 0.001* | 18 > 19 |
| Atmospheric humidityz | t-5 | 85.036 ± 7.902 | 88.617 ± 5.374 | 0.172 | 18 = 19 |
| Atmospheric humidityy | t-4 | 85.047 ± 3.589 | 91.876 ± 3.905 | < 0.001* | 18 < 19 |
| Atmospheric humidityz | t-3 | 78.916 ± 3.132 | 90.436 ± 4.304 | < 0.001* | 18 < 19 |
| Atmospheric humidityy | t-2 | 80.302 ± 5.843 | 88.488 ± 4.006 | < 0.001* | 18 < 19 |
| Atmospheric humidityy | t-1 | 87.472 ± 6.422 | 92.164 ± 3.826 | < 0.001* | 18 < 19 |
| Accumulated tempz | t-5 | 18.513 ± 2.211 | 18.713 ± 1.554 | 0.784 | 18 = 19 |
| Accumulated tempy | t-4 | 22.020 ± 1.932 | 19.160 ± 1.332 | < 0.001* | 18 > 19 |
| Accumulated tempy | t-3 | 24.787 ± 0.776 | 23.287 ± 1.275 | < 0.001* | 18 > 19 |
| Accumulated tempy | t-2 | 24.440 ± 1.093 | 22.973 ± 1.353 | < 0.001* | 18 > 19 |
| Accumulated tempz | t-1 | 21.260 ± 1.567 | 18.807 ± 1.564 | < 0.001* | 18 > 19 |
| Diurnal temp rangez | t-5 | 7.915 ± 3.087 | 7.427 ± 2.458 | 0.647 | 18 = 19 |
| Diurnal temp rangez | t-4 | 7.267 ± 2.188 | 5.391 ± 2.609 | 0.049* | 18 > 19 |
| Diurnal temp rangey | t-3 | 8.556 ± 1.718 | 5.930 ± 2.582 | < 0.001* | 18 > 19 |
| Diurnal temp rangez | t-2 | 7.434 ± 1.553 | 6.459 ± 1.988 | 0.159 | 18 = 19 |
| Diurnal temp rangez | t-1 | 5.245 ± 2.586 | 5.450 ± 2.208 | 0.823 | 18 = 19 |
| Solar insolationy | t-5 | 5.989 ± 2.762 | 6.929 ± 2.730 | < 0.001* | 18 < 19 |
| Solar insolationy | t-4 | 7.680 ± 2.354 | 5.383 ± 2.620 | < 0.001* | 18 > 19 |
| Solar insolationy | t-3 | 8.475 ± 1.542 | 7.073 ± 2.617 | < 0.001* | 18 > 19 |
| Solar insolationz | t-2 | 7.634 ± 0.953 | 6.994 ± 1.744 | 0.238 | 18 = 19 |
| Solar insolationz | t-1 | 5.250 ± 2.616 | 4.491 ± 2.093 | 0.404 | 18 = 19 |
| Soil tempz | t-5 | 23.391 ± 0.729 | 22.565 ± 0.631 | 0.003* | 18 > 19 |
| Soil tempz | t-4 | 25.248 ± 0.886 | 23.270 ± 0.498 | < 0.001* | 18 > 19 |
| Soil tempz | t-3 | 26.420 ± 0.589 | 25.896 ± 0.661 | 0.035* | 18 > 19 |
| Soil tempy | t-2 | 26.836 ± 0.739 | 26.373 ± 0.509 | < 0.001* | 18 > 19 |
| Soil tempz | t-1 | 25.563 ± 0.568 | 24.631 ± 0.914 | 0.003* | 18 > 19 |
| Soil moisturez | t-5 | 38.980 ± 4.507 | 37.122 ± 6.370 | 0.381 | 18 = 19 |
| Soil moisturey | t-4 | 33.994 ± 5.754 | 40.581 ± 4.651 | < 0.001* | 18 < 19 |
| Soil moisturey | t-3 | 37.419 ± 5.737 | 40.383 ± 4.319 | < 0.001* | 18 < 19 |
| Soil moisturey | t-2 | 42.634 ± 2.537 | 37.309 ± 5.539 | < 0.001* | 18 > 19 |
| Soil moisturey | t-1 | 46.052 ± 3.753 | 39.281 ± 1.623 | < 0.001* | 18 > 19 |
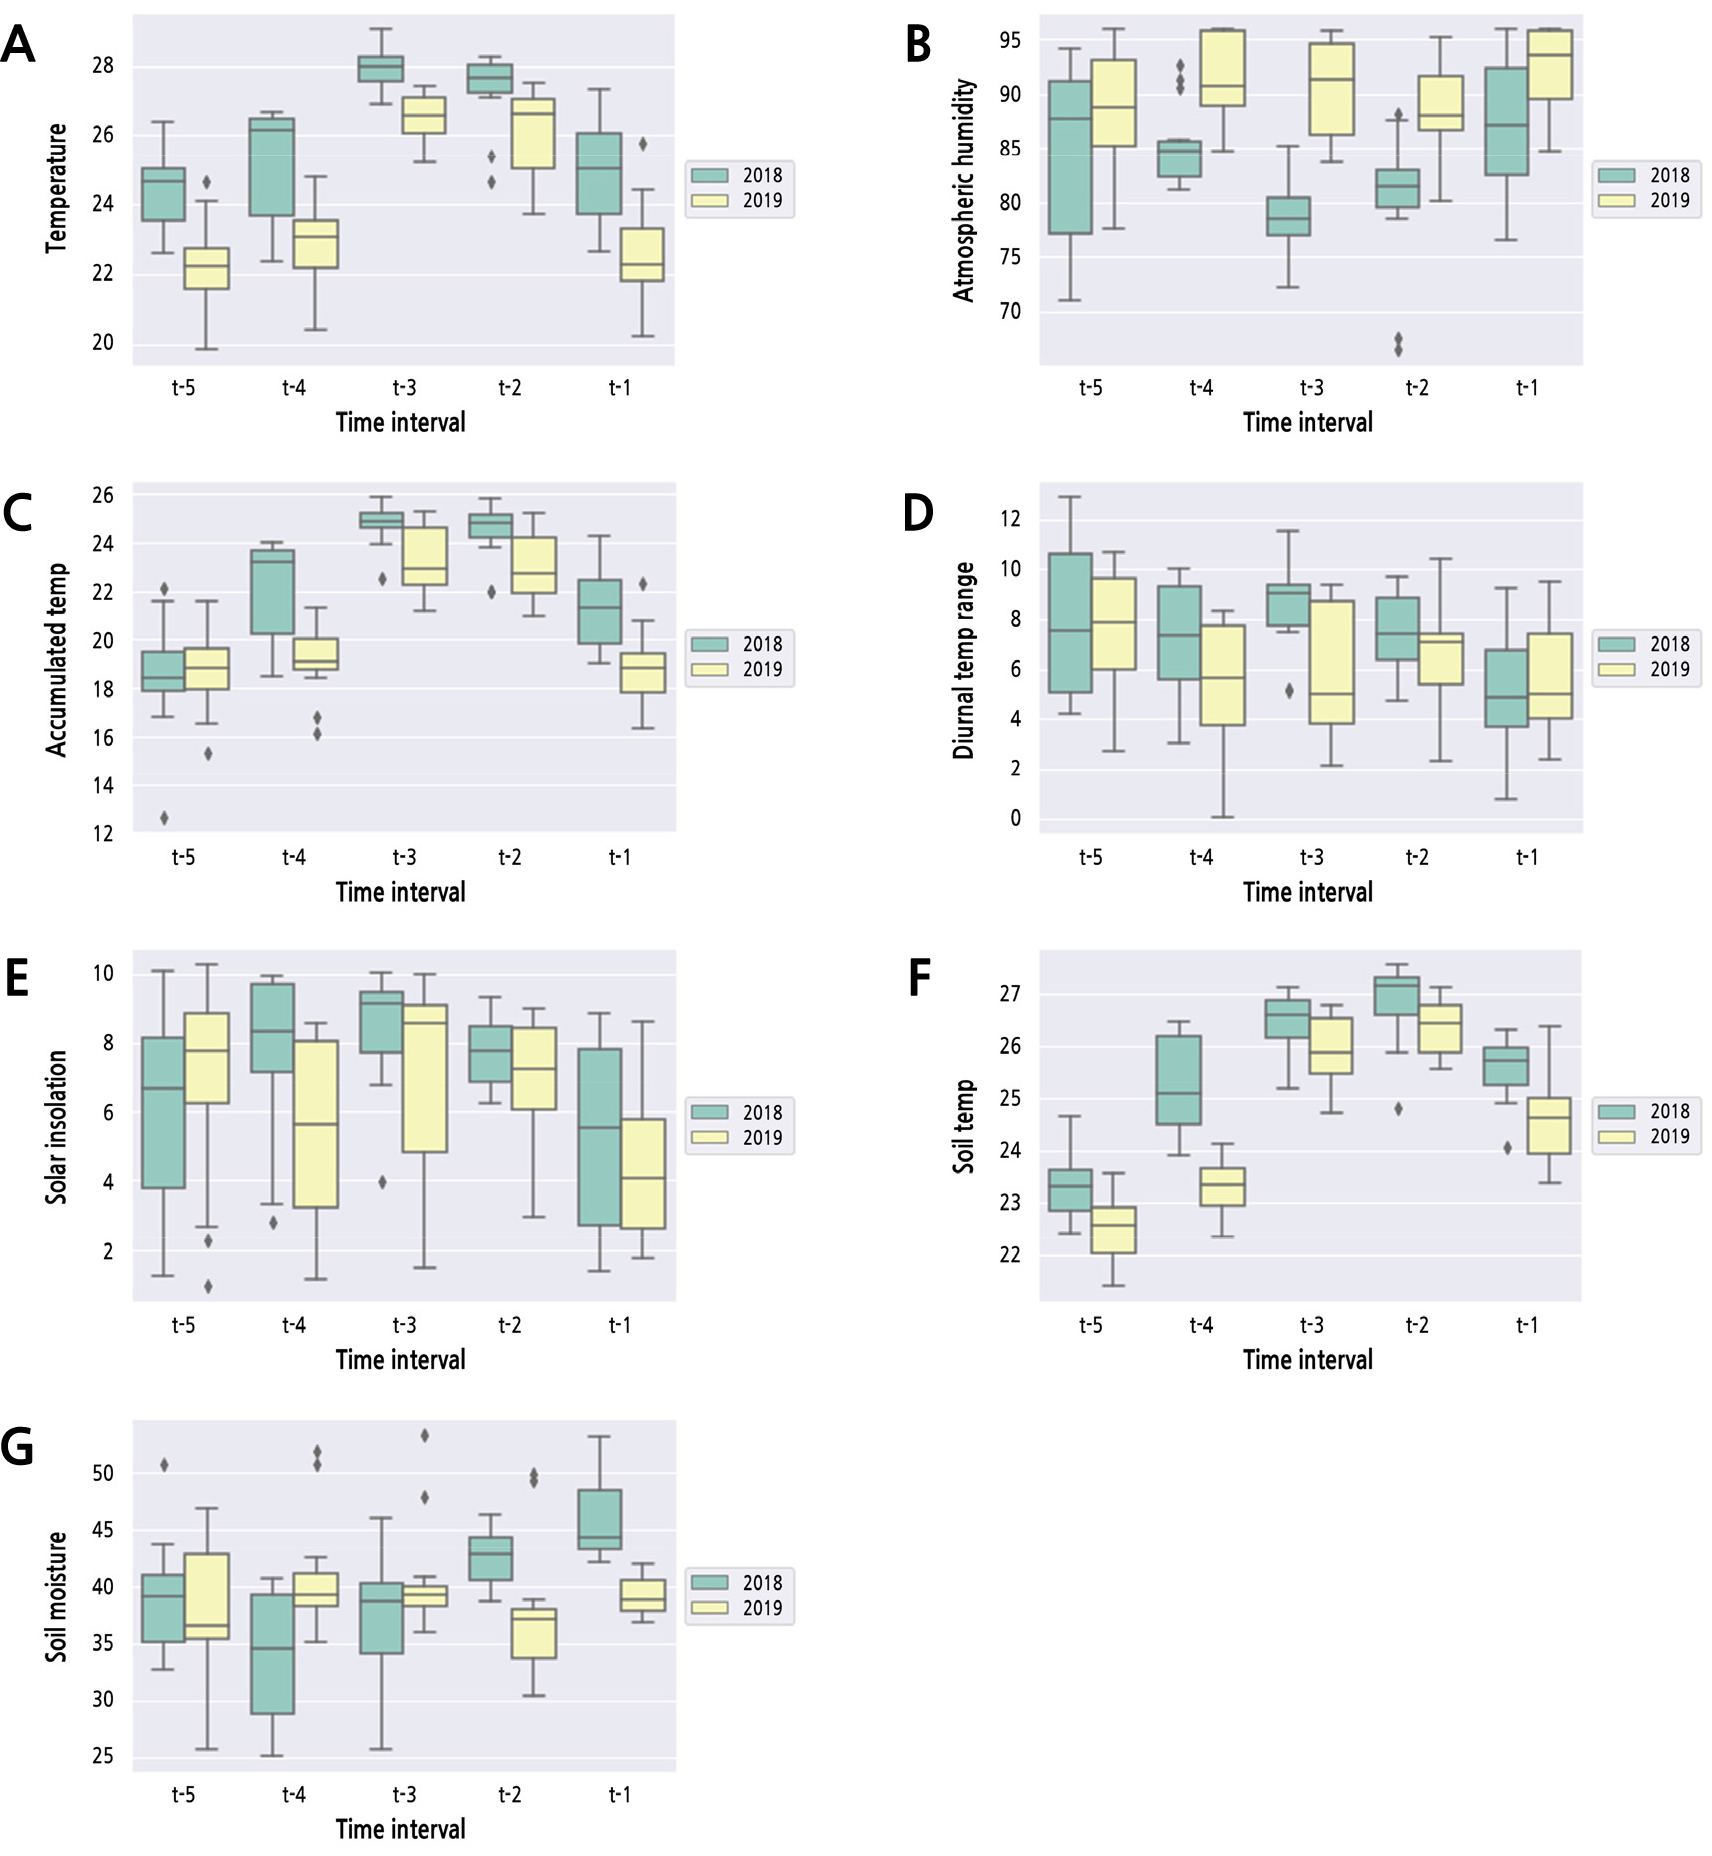
Fig. 3.
Box plots comparing values of meteorological variables at 15-day intervals between the two years. (A) Temperature. (B) Atmospheric humidity. (C) Accumulated temperature. (D) Diurnal temperature range. (E) Solar insolation. (F) Soil temperature. (G) Soil moisture. The boxplots consist of two parts: a box and a set of whiskers. Upper and lower whiskers in boxplots indicate the maximum and minimum values of data, respectively. The lower line in the box means quantile 25% (Q1), and the upper line in the box means quantile 75% (Q3). The center line in the box means median (Quantile 50%; Q2). The data points that lie outside of Q2 ± 1.5 × (Q3-Q1) are considered outliers and are represented as diamond-shaped dots.
Multiple Correlation Analysis
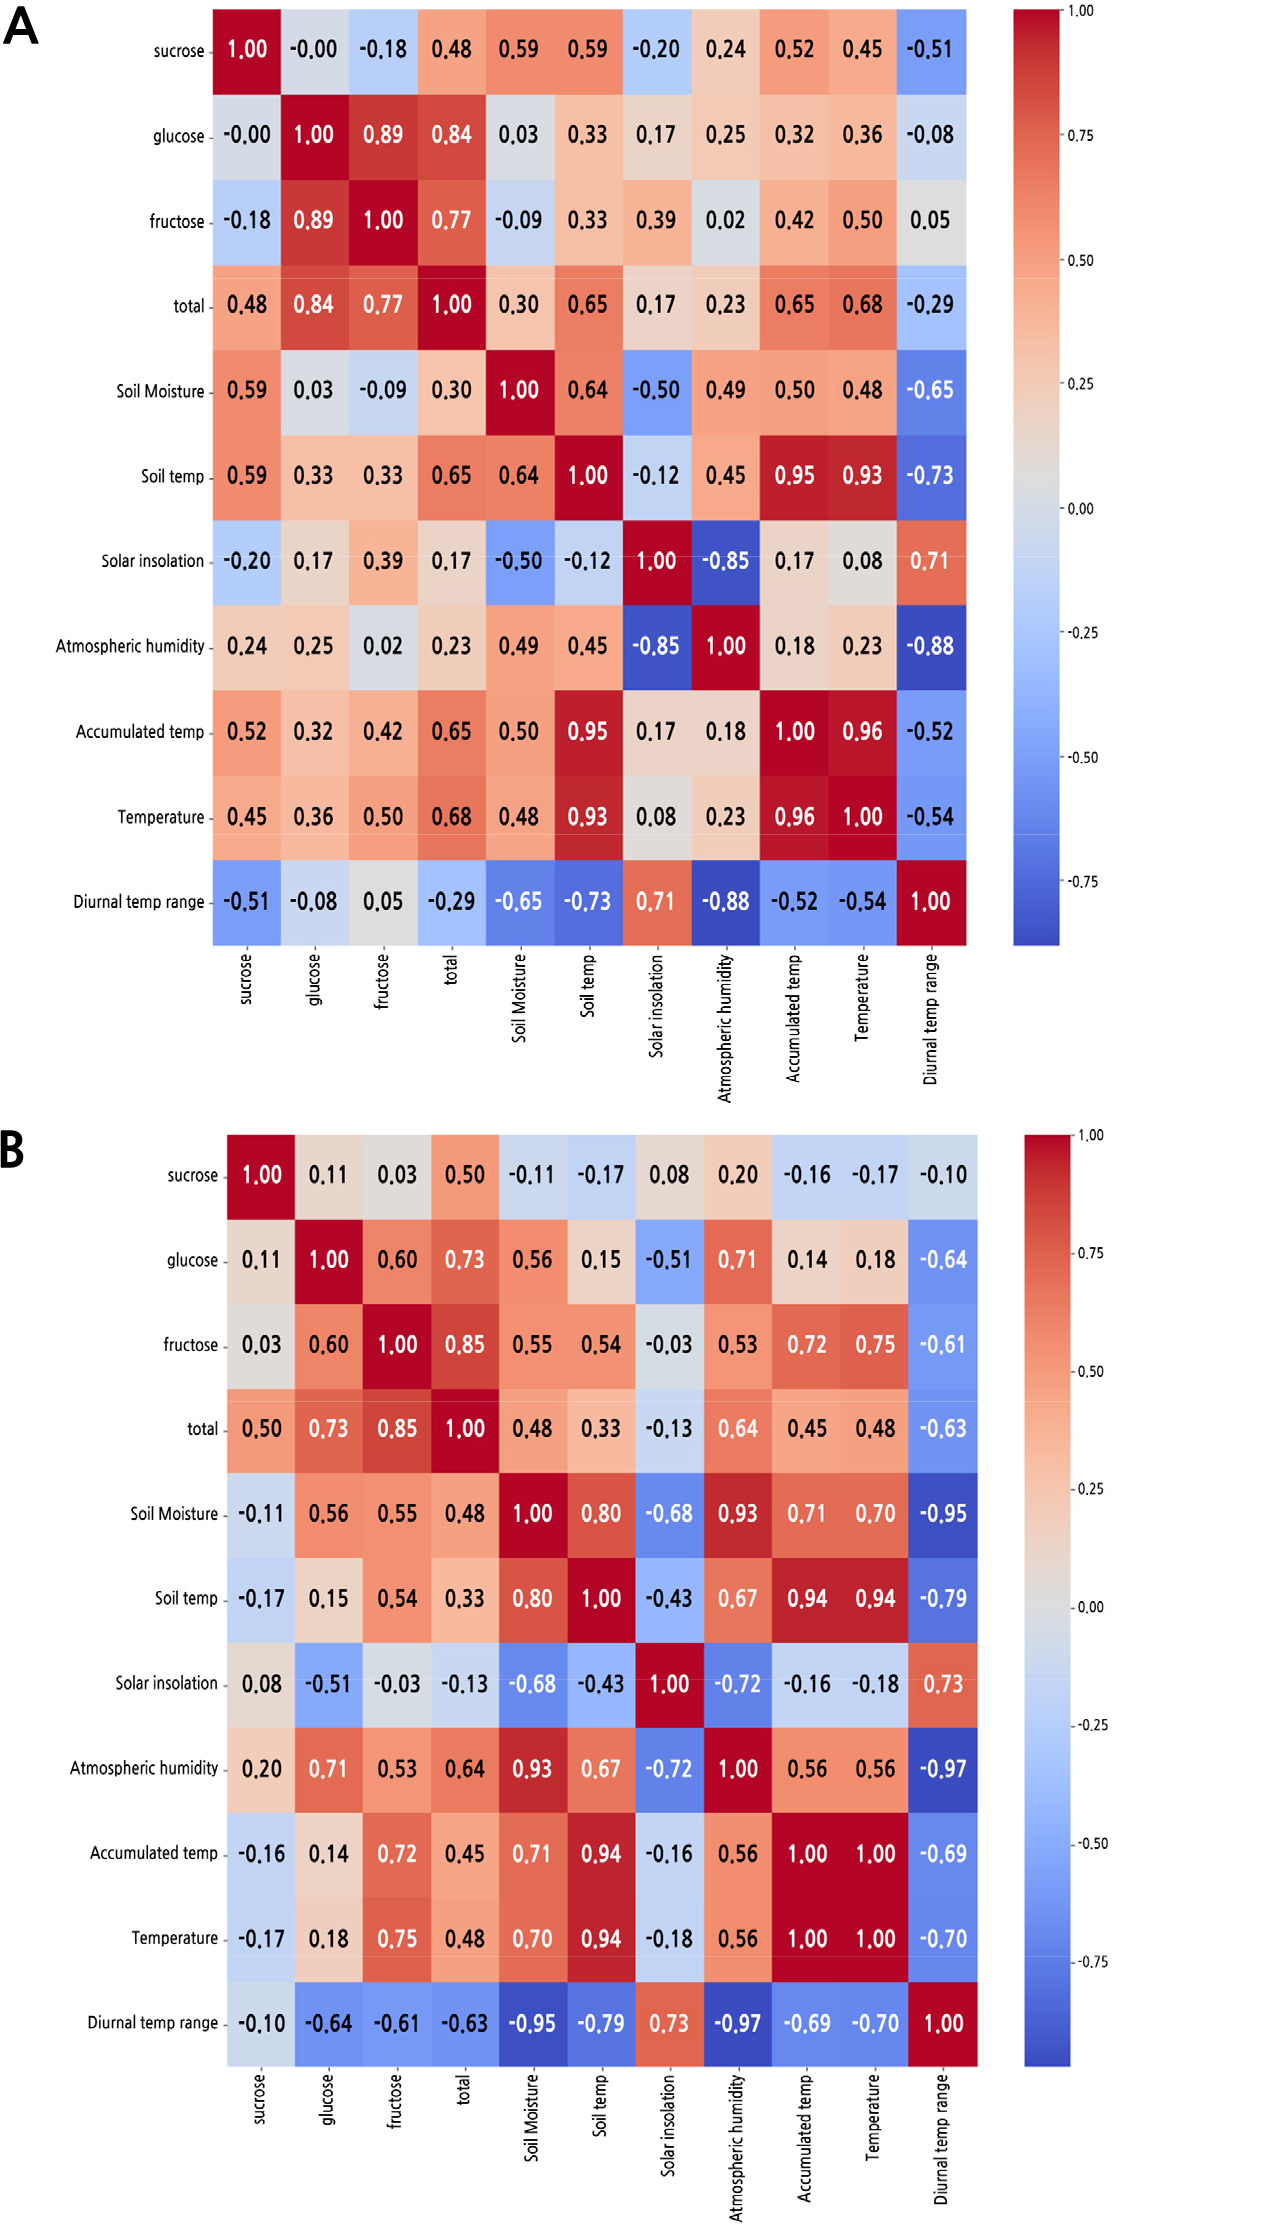
The heatmap of multiple correlation matrices between the soluble sugars content and meteorological variables is shown in Fig. 4. Multiple correlation matrices represent the correlations for the changes in the soluble sugars content with meteorological variables between the two years. In 2018, sucrose was found to be correlated with soil moisture, soil temperature, accumulated temperature, air temperature, and the diurnal temperature range. Fructose was correlated with accumulated temperature and air temperature in 2018. However, in 2019, fructose had a close correlation with accumulated temperature and air temperature, whereas sucrose showed no correlation with meteorological variables. This indicated that differences in the contents of fructose and sucrose might be attributed to differences in meteorological variables over the two years.
Discussion
This study was conducted to investigate the impacts of climate change on the quality of pear fruit during the growing seasons of 2018 and 2019. Between the two years, notable differences in the accumulation patterns of fructose and sucrose were noted from 132 DAFB until maturity of pear fruit; however, no difference in glucose accumulation was observed (Fig. 1). While sucrose accounted for approximately one-third of the total soluble sugar measured in 2018, fructose was the predominant sugar in 2019, accounting for 56.3% of the total soluble sugar at maturity. These differences in sugar composition might be responsible for the differences in the sweetness of pear fruit over the two years. The composition and overall amount of sucrose, fructose, and glucose directly impact the perceived sweetness of the fruit (Tanase and Yamaki, 2000). During fruit development, annual differences in the soluble sugars content and their accumulation patterns identified in this study have also been reported in previous studies (Fadda and Mulas, 2010; Oikawa et al., 2015; Mesa et al., 2016).
Over the two years, we found differences in the meteorological data measured (Fig. 2). In particular, the daily average temperatures from late-June to mid-August (73 to 132 DAFB) were all higher in 2018 than in 2019 (Fig. 2A), and differences in both fructose and sucrose accumulation were observed after 132 DAFB between the two years (Fig 1C and 1D). Notable differences were also observed in the meteorological variables for each time interval between the two years (Table 1 and Fig. 3). In the comparison based on each time interval, the values of air temperature, accumulated temperature, and soil temperature in 2018 were all higher than those in 2019, excluding the value of accumulated temperature at t-5 in 2018. In addition, as shown in the multiple correlation analysis (Fig. 4), we found that sucrose and fructose accumulation responded differently depending on the meteorological variables over the two years. These results implied that the differences in meteorological conditions may affect the soluble sugars content and their accumulation patterns. It also indicated that the difference in temperature observed over the two years may have contributed to differences in the fructose and sucrose contents and their accumulation patterns. This is because, unlike in 2019, only accumulated temperature and air temperature were found to be correlated with the change in sucrose and fructose content in 2018 among other meteorological variables.
Factors that contributed to differences in the cumulative amounts of both fructose and sucrose over the two years can be found in a previous study by Richardson et al. (2004) who investigated the deleterious effects of high temperatures on carbohydrate metabolism in kiwifruit. In their experiments, a transient reduction in the soluble sugars content was observed immediately after heat treatment of kiwifruit at any stage of fruit development. The soluble sugars content in kiwifruit receiving heat treatment during the cell division phase was recovered to the level of the control group thereafter, whereas kiwifruit subjected to heat treatment during starch accumulation or fruit maturation had a significantly lower soluble sugars content than that of the control group. In addition, the finding that the sugar to starch ratio of kiwifruit receiving heat treatment during the fruit maturation stage was lower than that of the control group indicates that mobilization of sugar from starch was delayed by heat treatment. Interestingly, sucrose was more affected by high temperatures than hexoses. However, the effect of high temperatures on the sensitivity of sucrose seems to be temporary. Although the hexose to sucrose ratio was raised immediately after heat treatment, the ratio returned to a level similar to that of the control group after the high temperatures were removed. Thus, it can be assumed that the delay in sucrose accumulation observed in 2018 was due to delayed starch decomposition by high temperatures, as revealed in the results of Richardson et al. (2004).
The effect of temperature on the sugar content during fruit development is well documented in the literature. In a previous study of Liu et al. (2013), the sucrose content in pear flesh increased significantly by 11.8% two weeks after a high-temperature treatment when compared with that in untreated flesh at harvest. Their result is consistent with our finding, where the sucrose content in 2018 increased dramatically after 132 DAFB. The average temperature from late-June to mid-August (73 to 132 DAFB) was 1.8°C higher in 2018 (26.3°C) than in 2019 (24.5°C). Kano (2006) observed that sucrose accumulation in melon fruit on 40 DAFB was much more promoted in a high-temperature treatment than that in unheated fruit. The sucrose content was higher in rice grains grown in a greenhouse than in grains grown in the field (Li et al., 2006); the day and night temperatures in the greenhouse were 2°C and 0.3°C higher than the ambient air temperature, respectively. Their results also showed that activities of sucrose synthase and invertase decreased in high-temperature-treated grains. Therefore, our finding that fructose accumulation at the maturation stage in 2018 was lower than that in 2019 suggests that it is related to a decrease in the activity of sucrose synthase by high temperatures (Schmolzer et al., 2016; Stein and Granot, 2019). Sucrose synthase has been shown to play a role in sucrose cleavage rather than sucrose synthesis (Turner and Turner, 1975; Stein and Granot, 2019).
In contrast to our results, Yamada et al. (1994) reported that the sucrose content in the flesh of two apple cultivars decreased with increasing fruit temperature from 21 to 35°C, but the content of fructose and glucose increased. However, the results obtained by Yamada et al. (1994) are thought to be due to a raised hexose to sucrose ratio in the fruit immediately after the high-temperature treatment, similar to the findings of Richardson et al. (2004). Besides, a high-temperature treatment negatively affected the sucrose content compared with plants subjected to a low-temperature treatment in sugarcane (Bonnett et al., 2006) and watermelon (Fukuoka et al., 2009). Sun et al. (2012) investigated the combined effects of elevated CO2, nitrogen, and temperature on sugar composition in strawberry. However, the effect of high-temperature treatment on the sugar composition was negligible. The contents of fructose and glucose increased 1.3-fold under elevated CO2 treatment compared to those under the ambient CO2 condition, regardless of temperature. Taken together, changes in the sugar content and the types of sugar accumulated under high temperature stress differ depending on the intensity and duration of the stress and the fruit crop species.
The meteorological conditions differed over the two years in the present study; likewise, the fructose and sucrose contents and their accumulation patterns also differed. Among the meteorological variables, the variables related to temperature showed a clear difference over the two years at each time interval. Correlation coefficient matrices showed that accumulation of soluble sugars responded differently depending on the meteorological conditions over the two years. Furthermore, only accumulated temperature and air temperature were correlated with the change in sucrose and fructose contents in 2018, unlike in 2019. This indicates that temperature differences may have contributed to the differences in the fructose and sucrose contents and their accumulation patterns over the two years.
However, our results are still insufficient to elucidate the effects of extreme high temperatures, especially during the summer period, on the accumulation pattern and composition of soluble sugars in pear fruit. The extent of the effects of these temperature changes on fructose and sucrose content during fruit development stages and/or at maturity of pear fruit remains unclear. Given the acceleration of global warming, further studies are needed to evaluate the effects of extreme high temperatures, particularly during the summer period, on the sugar composition at different developmental stages of pear fruit, especially in terms of the intensity, duration, and frequency of the high temperature.
