

Introduction
Materials and Methods
Plant preparation
Pathogen inoculation and disease development
Pathogenicity assessment and image data acquisition
Development of the symptom image classification model
Results and Discussion
Phenotypic analysis following pathogen inoculation
Performance evaluation of the symptom image classification model
Image classification system implementation
Implications and limitations of the CNN-based phenotyping framework
Conclusion
Introduction
Bacterial wilt, caused by the soil-borne bacterium Ralstonia solanacearum, is one of the most destructive diseases affecting pepper and other solanaceous crops (Genin 2010). The pathogen typically invades plants through root wounds, colonizes the xylem, disrupts water transport, and ultimately causes irreversible wilting and plant death (Champoiseau et al. 2009; Genin 2010). R. solanacearum has an exceptionally broad host range, infecting more than 250 plant species, including pepper and tomato, and is widely distributed across tropical, subtropical, and temperate regions (Champoiseau et al. 2009; Genin 2010). During the cultivation of pepper, bacterial wilt can result in substantial yield losses, and effective control remains difficult because the pathogen can survive in soil for extended periods and is not easily managed by chemical or biological means alone (Lee et al. 2015; Jiang et al. 2017). Therefore, the development of resistant cultivars is considered the most practical, durable, and environmentally sustainable strategy for disease management (Lee et al. 2011; Huet 2014; Lee et al. 2015).
Accurate phenotypic evaluations are essential for resistance screening and breeding because the severity of bacterial wilt is typically assessed according to the progression of wilting symptoms over time. However, conventional disease assessment largely depends on visual inspections by observers, a process that introduces subjectivity and can lead to inconsistency among evaluators and across experiments. Such variability limits the reproducibility and comparability of resistance data, particularly when symptom classes are subtle or intermediate. Accordingly, there is a need for an objective and reproducible phenotyping framework within which disease symptoms can be quantified more consistently. This limitation is particularly important in breeding programs, where reliable discrimination among resistant, moderately resistant, and susceptible genotypes is required for selection decisions. Moreover, accurate and reproducible phenotypic evaluation provides a critical foundation not only for breeding programs but also for genomics-based studies, including QTL mapping, genome-wide identification of resistance-associated genes, and transcriptome analyses aimed at elucidating the molecular mechanisms underlying disease resistance.
Artificial intelligence (AI) has emerged as a powerful tool for data-driven decision-making with minimal human intervention and is increasingly being applied in diverse areas of the life sciences, including genomics, genetics, and phenotypic analysis (Hamet and Tremblay 2017; Harfouche et al. 2019). In agriculture, AI-based approaches are being used for crop monitoring, automated disease diagnosis, and in high-throughput trait evaluations (Harfouche et al. 2019). In particular, image-based AI methods provide a promising strategy for objective assessments of plant disease symptoms and may help reduce observer-dependent bias in phenotyping workflows (Mohanty et al. 2016).
Among AI approaches, deep-learning methods based on artificial neural networks (ANNs) have shown particular strength when applied to image analysis. Convolutional neural networks (CNNs) are especially well suited for image classification given their ability to extract hierarchical spatial features automatically from raw image data (Kim et al. 2023). Owing to this capability, CNNs have been widely adopted for object recognition and plant disease classification and are considered effective tools for extracting biologically relevant information from visual symptom patterns (Mohanty et al. 2016; Kim et al. 2023). Comparative studies of fine-tuned deep CNN architectures have further demonstrated the utility of deep-learning models for image-based plant disease identification (Too et al. 2019).
In this study, we developed and evaluated a CNN-based image classification framework for bacterial wilt symptom assessments in pepper. Three pepper genotypes representing resistant, moderately resistant, and susceptible responses were inoculated with Ralstonia solanacearum SL1931 and symptom images were acquired under standardized imaging conditions. To reduce information leakage, images derived from the same plant individual were assigned to the same dataset partition. The objective of this study was to determine whether CNN-based image analysis could classify symptom-associated resistance classes in previously unseen images and thereby provide a more objective and reproducible tool for bacterial wilt phenotyping for use in pepper breeding operations.
Materials and Methods
Plant preparation
To compare the resistance of different pepper varieties to bacterial wilt disease, three varieties were selected for the experiment: a resistant variety (MC4), a moderately resistant variety (ECW30R), and a susceptible variety (Subicho). Once the first true leaf emerged, the seedlings were transplanted into 32-cell trays and grown under a 16-hour photoperiod in a controlled environment (29 ± 1°C and 50–70% relative humidity). The plants were grown for approximately 21 days, until the third and fourth true leaves had fully expanded. All experiments were repeated at least three times to ensure the reproducibility of the observed symptoms.
Pathogen inoculation and disease development
The pathogen responsible for bacterial wilt, Ralstonia solanacearum SL1931, was inoculated onto a TZC solid medium (1 g casamino acids, 10 g peptone, 5 g glucose, 17 g agar, 5 mL 1% 2,3,5-triphenyltetrazolium chloride solution, and 1 L TDW) and incubated in the dark at 28°C for 36–48 hours. To enhance bacterial viability, this process was repeated once.
A single colony was then inoculated into a CPG liquid medium (1 g casamino acids, 10 g peptone, 5 g glucose, and 1 L TDW) and subcultured twice for 24 hours each at 28°C. The cultured bacterial suspension was centrifuged at 12,000 rpm for three minutes to remove the supernatant, after which it was adjusted to an OD600 level of 0.3 (approximately 10⁸ CFU/mL) with sterile distilled water (TDW). The suspension was diluted 100-fold to prepare a final inoculation concentration of 106 CFU/mL.
Inoculation was conducted on plants 21 days after planting when they were in the early stage of 7–8 true leaf expansion with 3–4 fully expanded leaves. Using the leaf infiltration method, 0.1 mL of the bacterial suspension was injected onto the underside of 3–4 leaves with a needle-free syringe. After inoculation, the plants were maintained under identical environmental conditions (29 ± 1°C, 50–70% humidity, and a 16-hour light cycle) to observe disease development.
Pathogenicity assessment and image data acquisition
Disease progression following inoculation with Ralstonia solanacearum was monitored daily for 20 days. Disease severity was scored using the following five-level disease index (DI) scale based on the extent of wilting and leaf abscission: 0, no visible symptoms; 1, 1–25% of leaves wilted and/or abscised; 2, 26–50% of leaves wilted and/or abscised; 3, 51–75% of leaves wilted and/or abscised; and 4, 76–100% of leaves wilted and/or abscised (Kwon et al. 2021). This type of ordinal disease scoring system is commonly used for bacterial wilt phenotyping in solanaceous crops and enables reproducible discrimination among resistant, intermediate, and susceptible responses.
Phenotypic validation was undertaken at 20 days after inoculation, when varietal differences in symptom severity were clearly distinguishable (Kwon et al. 2021). Resistance classes were assigned according to the wilt rate (%): plants with a wilt rate of ≤25% were classified as resistant, those with a wilt rate of >25% and ≤75% as moderately resistant, and those with a wilt rate of >75% as susceptible. For phenotypic validation in this study, resistance classes were defined according to the wilt rate as follows:
wilt rate (%) = (number of plants with DI ≥ 3 / total number of plants) × 100.
For the image-based analysis conducted here, symptom images were collected when disease symptoms had stabilized sufficiently to allow clear visual discrimination among the resistance classes. Each plant was photographed from four directions (front, back, left, and right) against a black background under standardized imaging conditions (shutter speed, 1/100 s; aperture, f/7.1; ISO, 3200). A total of 1,500 images were generated for a deep-learning analysis, comprising 500 images each for the resistant, moderately resistant, and susceptible classes. All images were acquired under standardized conditions to reduce non-biological variations and to improve the consistency of feature extraction and downstream image classification (Mohanty et al. 2016).
Development of the symptom image classification model
To classify bacterial wilt symptoms from digital images, we applied a deep-learning-based convolutional neural network (convolutional neural network, CNN) model. CNN architectures are widely used in plant image analysis because they can automatically extract hierarchical spatial features from images and have demonstrated strong performance capabilities in plant disease detection and classification studies (Mohanty et al. 2016; Li et al. 2021). Rather than employing an existing pre-trained network, we developed a lightweight custom CNN architecture optimized for bacterial wilt symptom classification. The architecture comprised two convolutional blocks for feature extraction, followed by two fully connected layers and a Softmax output layer for three-class prediction. The relatively simple network design was selected to match the size and characteristics of the image dataset while reducing model complexity and the risk of overfitting. In the present study, a CNN-based framework was adopted to reduce observer-dependent bias and to enable objective classification of disease symptoms directly from image data. The overall workflow of the CNN-based image classification pipeline used in this study is summarized in Fig. 1.
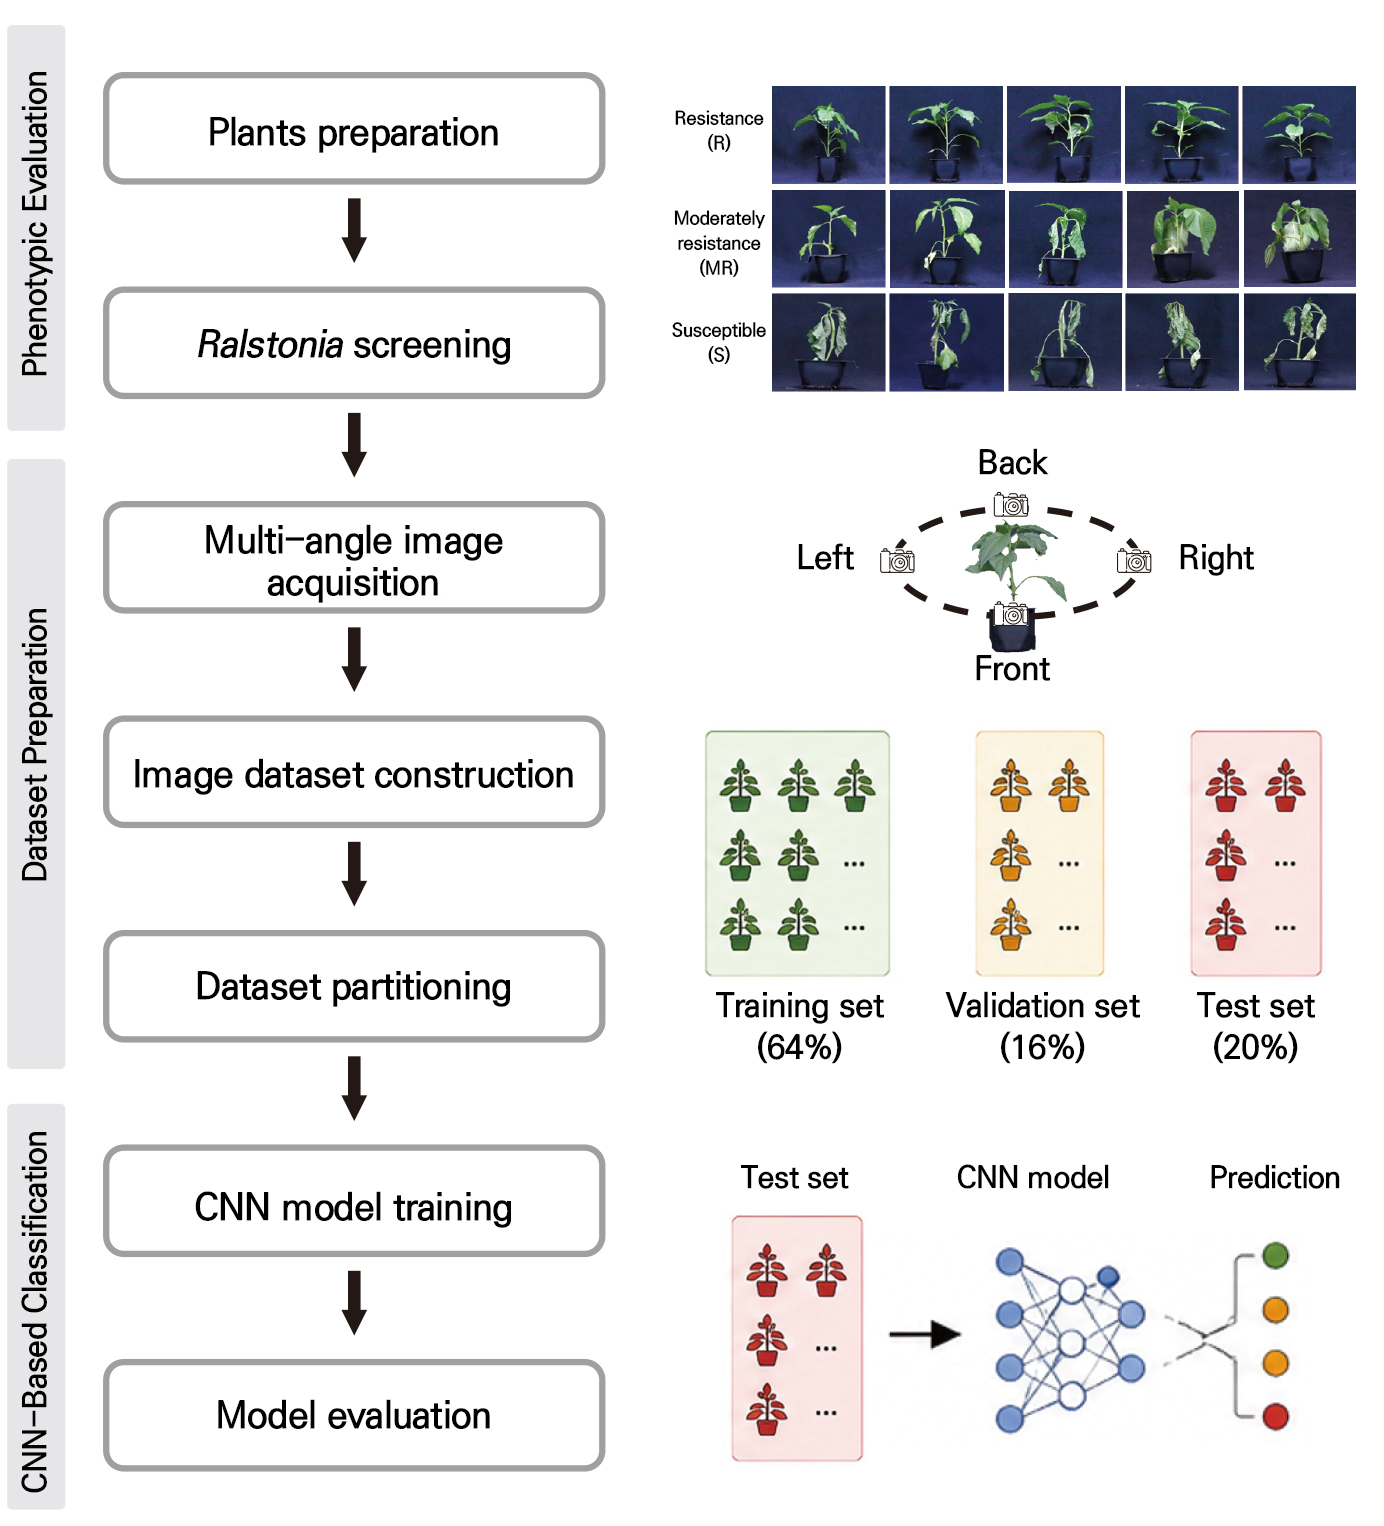
Fig. 1.
Workflow of CNN-based classification of bacterial wilt symptoms in pepper. Pepper plants representing resistant (R), moderately resistant (MR), and susceptible (S) phenotypes were inoculated with Ralstonia solanacearum and evaluated based on symptom severity. Representative symptom images were collected under standardized imaging conditions using a multi-angle image acquisition strategy (front, back, left, and right views). The image dataset was constructed and partitioned into training (64%), validation (16%), and test (20%) sets using a plant-level split strategy to prevent information leakage between datasets. A CNN model was trained using the training dataset and evaluated using an independent test set to classify bacterial wilt symptom categories.
The full dataset consisted of 1,500 images and was divided into three subsets for model development and evaluation. These were the training, validation, and test sets. Specifically, 64% of the images (n = 960) were assigned to the training set, 16% (n = 240) to the validation set, and 20% (n = 300) to the independent test set. The class distribution was maintained as evenly as possible across the three dataset partitions to avoid bias during the model training and performance evaluation processes. To minimize instances of information leakage, all images obtained from the same plant individual were assigned to a single dataset partition, and no images from the same plant were distributed across the training, validation, or test sets. This plant-wise partitioning strategy was used to reduce the risk of data leakage, which can otherwise lead to overly optimistic estimates of model performance capabilities in machine-learning-based studies (Kapoor and Narayanan 2023).
The independent test set was completely excluded from all training and model-selection procedures and was used only for the final evaluation of model performance. Such strict separation of dataset partitions is essential for obtaining an unbiased estimate of model generalization performance in image-based plant disease classification tasks (Géron 2022; Jannat et al. 2025).
During model development, the training set was used to optimize model parameters, whereas the validation set was used to monitor the behavior of the model during training and to assess convergence and potential overfitting. The final model was evaluated only once using the independent test set. This workflow enabled an objective assessment of whether the trained CNN model could accurately classify previously unseen images of bacterial wilt symptoms.
Results and Discussion
The results are presented in three sequential steps: phenotypic validation of bacterial wilt responses among pepper genotypes, an evaluation of model training behavior using the validation set, and a final assessment of classification performance using an independent test set. This structure was adopted to determine whether visually distinguishable bacterial wilt responses could be translated into reproducible image-based symptom classes for CNN-based phenotyping.
Phenotypic analysis following pathogen inoculation
To evaluate plant responses to bacterial wilt, plants were inoculated with the Ralstonia solanacearum SL1931 strain at a concentration of 106 CFU/mL. A phenotypic analysis was conducted at 20 days after inoculation (Kwon et al. 2021). By 20 days after inoculation, when symptom progression had stabilized, distinct phenotypic differences were observed among the three pepper genotypes.
The resistant line MC4 exhibited minimal leaf wilting and limited necrosis. In contrast, the susceptible cultivar Subicho showed extensive leaf wilting and severe necrosis, indicating a high level of disease severity. The moderately resistant line ECW30R displayed an intermediate phenotype between the two extremes, with disease severity falling within the moderate range. These results indicate that resistance levels can be clearly distinguished based on symptom severity (Fig. 2). Representative images of each phenotype classified according to the disease index provide visual confirmation of the differences among resistance classes. The distinct phenotypic separation among the classes supports the suitability of the image dataset for subsequent CNN-based classification (Mohanty et al. 2016).
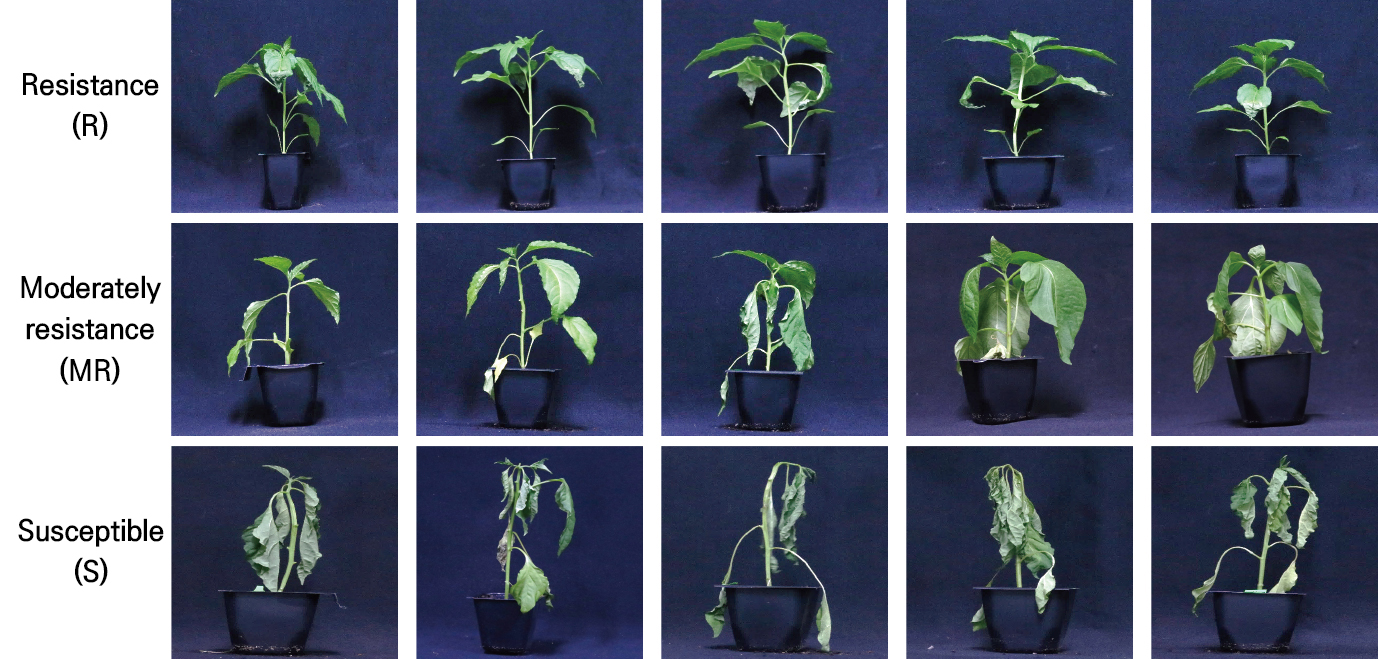
Fig. 2.
Phenotypic evaluation following Ralstonia solanacearum inoculation. Disease severity was evaluated using the following disease index scale: 0: no symptoms; 1: 1‒25% wilting and leaf drop; 2: 26‒50% wilting and leaf drop; 3: 51‒75% wilting and leaf drop; and 4: 76‒100% wilting and leaf drop. Scores of 0‒1 were classified as resistant, 2‒3 as moderately resistant, and 4 as susceptible. Images were captured 20 days after inoculation under standardized conditions (shutter speed of 1/100, aperture of f/7.1, and ISO of 3200).
Performance evaluation of the symptom image classification model
Model training behavior was assessed using training and validation accuracy and loss curves (Fig. 3). During the 12 training epochs, both the training and validation accuracy increased and then reached a plateau, whereas the loss values decreased and then became stabilized. The similar trajectories between the training and validation curves suggest stable model convergence without clear evidence of severe overfitting under the present dataset partitioning scheme. Because images obtained from the same plant individual were assigned to the same dataset partition, the evaluation design reduced the possibility that highly similar images from a single biological sample were shared between the training, validation, and test sets. This plant-wise partitioning is particularly important in image-based disease classification because multiple views of the same plant may contain shared morphological, background, or lighting features that can inflate estimates of apparent model performance outcomes if not properly separated (Kapoor and Narayanan 2023).
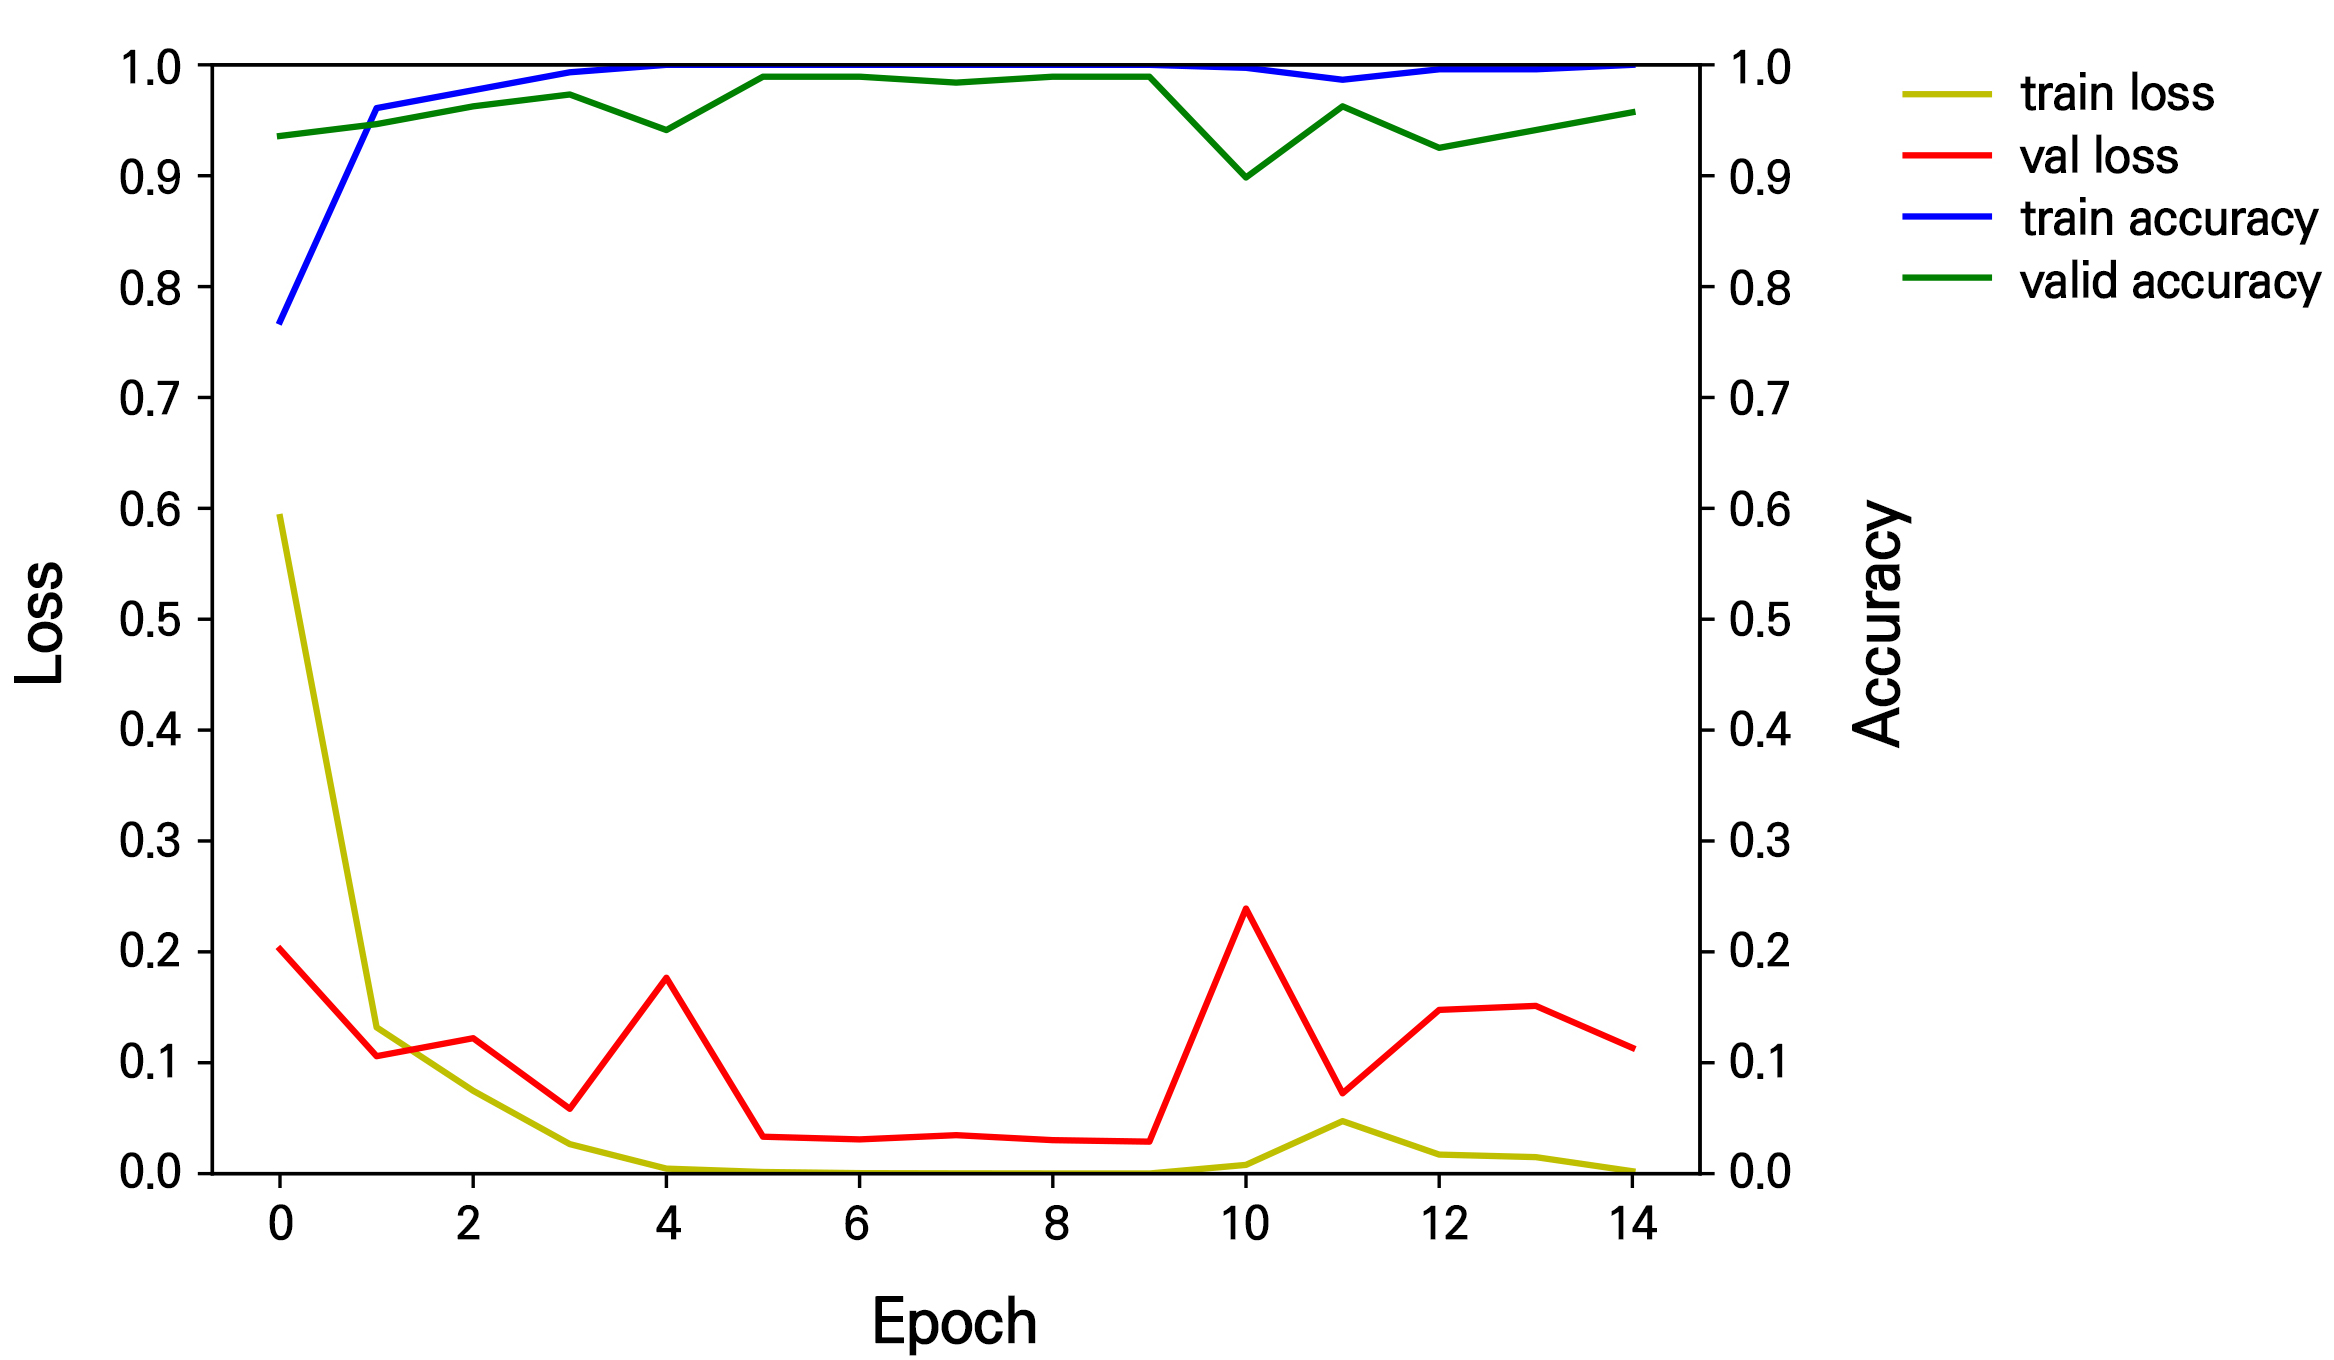
Fig. 3.
Training and validation performance outcomes of the CNN model. Model performance was monitored over 12 epochs using the validation set. Training and validation accuracy both increased and then stabilized, whereas loss values decreased and reached a plateau. The similar trajectories of the training and validation curves indicate appropriate model convergence without evident overfitting.
Image classification system implementation
The final model was evaluated using an independent test set that was not used during model training or validation. Among 300 test images, 266 were correctly classified into their corresponding symptom-associated resistance classes, resulting in an overall accuracy rate of 88.67% (Fig. 4). This result indicates that the CNN-based model was able to classify previously unseen bacterial wilt symptom images with relatively high accuracy under standardized imaging conditions.
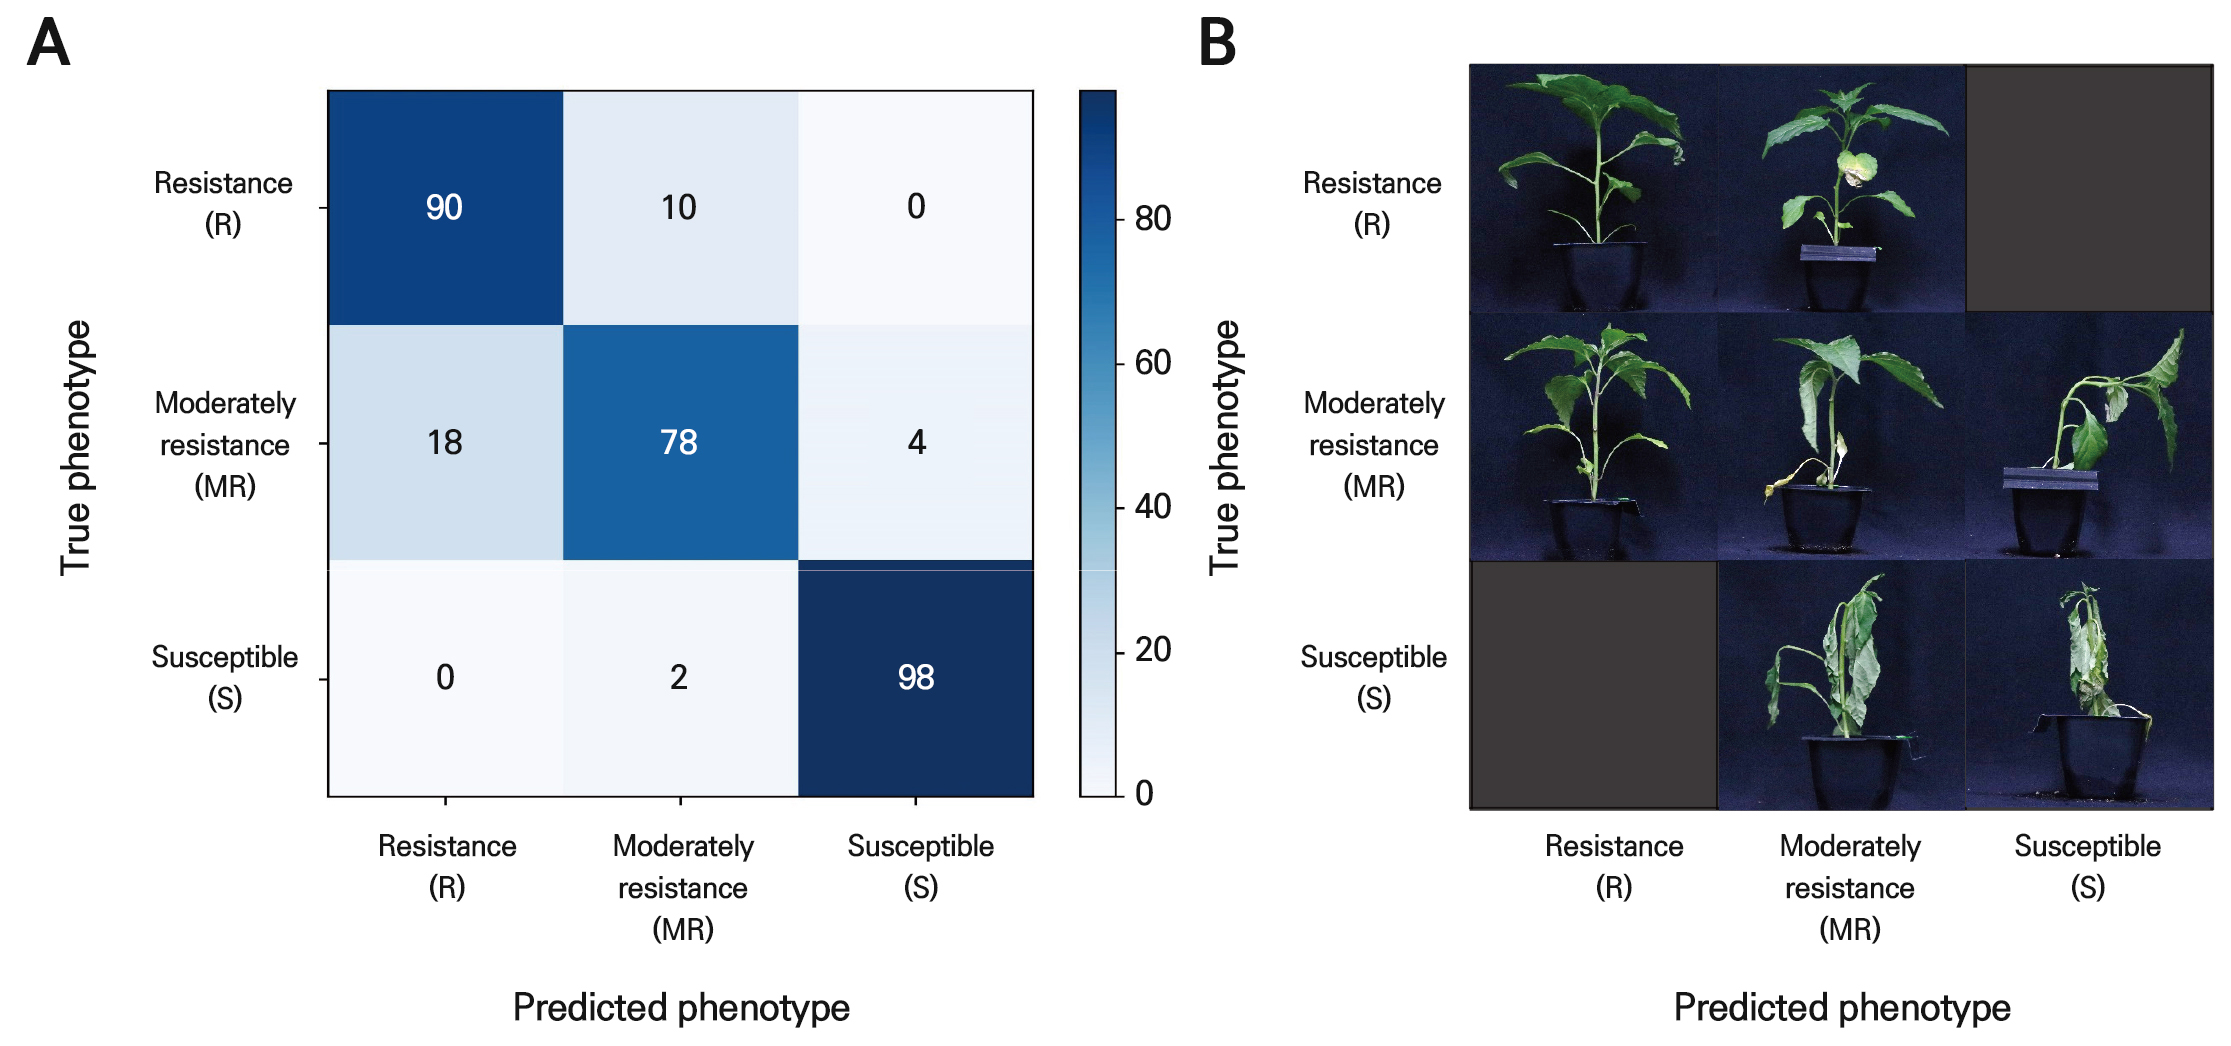
Fig. 4.
Classification performance outcomes of the CNN-based image classification model using the independent test set. (A) Confusion matrix showing the classification performance for 300 test images. The vertical axis represents the true symptom-associated resistance classes, whereas the horizontal axis represents the predicted classes generated by the CNN model. (B) Representative images of resistant, moderately resistant, and susceptible symptom classes.
The confusion matrix revealed that most classification errors occurred between adjacent symptom classes, particularly between the moderately resistant and susceptible phenotypes (Barbedo 2019). This error pattern is biologically plausible because bacterial wilt symptoms progress gradually and intermediate responses can share visual features with more severe wilt phenotypes. In contrast, resistant and susceptible phenotypes were more visually distinct, which likely contributed to more stable discrimination between the two extreme classes.
These results suggest that the proposed image classification framework can reduce observer-dependent variation in bacterial wilt phenotyping and provide a reproducible auxiliary tool for resistance screening in pepper (Bock et al. 2010; Mahlein 2016). Nevertheless, the model should be interpreted as a controlled-condition phenotyping framework rather than a fully generalized field diagnostic system.
Implications and limitations of the CNN-based phenotyping framework
The present study demonstrates the feasibility of using CNN-based image analysis to classify bacterial wilt symptoms in pepper. Compared with conventional visual scoring, the proposed framework has the potential to improve consistency in that it applies the same decision criteria across images. This advantage is particularly relevant for breeding programs, where large numbers of genotypes must be evaluated and where intermediate disease responses are often difficult to classify reproducibly by visual inspection alone.
However, several limitations should be considered. First, the model was trained and evaluated using images from three representative genotypes, meaning that its performance across broader pepper germplasm remains to be tested. Second, the experiment was conducted using a single R. solanacearum strain under controlled imaging conditions. Because bacterial wilt symptom expression can be influenced by the pathogen isolate, host genotype, plant developmental stage, inoculation method, and environmental conditions, further validation will be required before the model can be applied broadly. This is consistent with previous reports showing that the composition of the dataset, the image acquisition conditions, background effects, and symptom variability can strongly influence the performance of deep-learning-based plant disease recognition systems (Barbedo 2018). Third, the current model performs categorical classification rather than quantitative disease severity estimation. Future studies could improve the framework by incorporating ordinal classification, time-series image analysis, severity regression, or explainable artificial intelligence approaches to identify image regions contributing most strongly to model decisions.
Despite these limitations, the use of plant-wise dataset partitioning and an independent test set strengthens the reliability of the present evaluation. The framework provides a useful foundation for integrating digital-image-based phenotyping into pepper bacterial wilt resistance screening and can be extended to other crop–pathogen systems after appropriate external validation. From a biological perspective, the leaf infiltration method utilized in this study effectively facilitated the early and synchronized colonization of the xylem tissue by R. solanacearum, inducing uniform symptom development that was highly advantageous for digital image standardization. Furthermore, this robust framework demonstrates strong potential for scaling up into automated high-throughput phenotyping (HTP) systems (Fahlgren et al. 2015; Yang et al. 2020), which could significantly accelerate forward genetics and molecular breeding strategies, such as QTL mapping and genome-wide association studies (GWAS) in expansive segregating populations (Cobb et al. 2013).
Conclusion
In conclusion, this study developed a CNN-based image classification framework for objective assessments of bacterial wilt symptoms in pepper. Using standardized symptom images from resistant, moderately resistant, and susceptible genotypes, the final model correctly classified 266 of 300 independent test images, corresponding to an overall accuracy rate of 88.67%. The main classification errors occurred between adjacent symptom classes, particularly between moderately resistant and susceptible phenotypes, reflecting the continuous nature of bacterial wilt symptom development. The findings here indicate that image-based deep learning can support more reproducible bacterial wilt phenotyping in pepper. However, broader validation across diverse germplasm, pathogen isolates, developmental stages, and imaging environments will be necessary before large-scale breeding or field-level applications can be realized.
