

Introduction
Materials and Methods
Plant materials and growth conditions
Nitrogen- and water-deficit stress treatments
Measurement of growth parameters
Spectral imaging analysis
Analysis of stress-related substances
Statistical analysis
Results and Discussion
Nitrogen stress
Water-deficit stress
Conclusions
Introduction
Recently, spectral data obtained from multispectral and hyperspectral cameras have been used for phenotyping and to assess plant stress levels (Jang et al. 2018; Lee et al. 2019; Karoojee et al. 2021). By analyzing spectral imaging data, differences in the absorption and reflection characteristics of plant surfaces at different wavelengths can be detected, allowing for analyses of various plant physiological conditions. Multispectral imaging captures image data at a few limited wavelengths, whereas hyperspectral imaging captures large-scale three-dimensional spectral information across continuous wavelengths. Among the various imaging techniques, a hyperspectral data analysis is more effective than red-green-blue (RGB) or multispectral imaging for judging plant stress involving complex physiological changes because it allows for the selection of optimal detection wavelengths.
Hyperspectral imaging has been used to predict water content and water-deficit stress levels in various fruit vegetables, such as tomatoes (Zhou et al. 2011; Kang et al. 2015), cucumbers (Kim et al. 2018), and peppers (Park and Cho 2014). For tomato seedlings, a partial least squares regression analysis for all trays showed high accuracy (R2 values above 0.78; Kang et al. 2015). In cucumber seedlings under water-deficit stress, the reflectance values obtained from hyperspectral imaging showed differences starting at wavelengths of approximately 700 nm, with lower values in stressed plants (Kim et al. 2018). For pepper seedlings, hyperspectral shortwave infrared imaging (1,000–2,500 nm) revealed the most distinct differentiation between control and stressed plants at 1,449 nm (Park and Cho 2014). These studies have consistently demonstrated that hyperspectral imaging can distinguish between normal and water-stressed plants. However, the studies were limited to measurements at the single-plant or leaf scale, and there have been no practical attempts to detect stress at the plug-tray unit level during the seedling stage.
Several studies have used spectral imaging to predict nitrogen content and nitrogen stress levels, such as those that diagnose the nitrogen nutritional status of apple tree leaves (Jang et al. 2022), and to predict chlorophyll and nitrogen contents in grasslands (Clevers and Kooistra 2012). A total nitrogen content difference of approximately 0.3–0.4 between plots treated and not treated with nitrogen ammonium was observed. With longer treatment periods, the reflectance values obtained from hyperspectral imaging showed significant differences that exceeded 750 nm (Jang et al. 2022).
Although nitrogen deficiency symptoms are not common during the seedling stage in controlled commercial nurseries where nutrient-rich media and fertilized irrigation solutions are typically used, several factors can lead to nitrogen stress in tomato seedlings. These include an uneven distribution of nutrients during large-scale production, nutrient leaching due to excessive irrigation, improper substrate selection or mixing ratios, and nutrient depletion during extended growing periods. Detecting nitrogen deficiency before visible symptoms appear is crucial for maintaining seedling quality and uniformity. Early detection enables timely intervention through corrective fertilization practices, preventing growth delays and ensuring consistent seedling development. This is particularly important in commercial nurseries, where thousands of seedlings are simultaneously grown, and where quality consistency directly impacts crop establishment and the subsequent yield potential after transplanting.
There have been no attempts to assess nitrogen and water-deficit-stress levels considering either single plants or plug-tray units during the commercial seedling stage of tomato seedlings. Establishing hyperspectral analysis techniques for the rapid detection of water and nitrogen stress in tomato plug seedlings before external symptoms appear could lead to comprehensive assessments of the quality of seedlings in the future.
Therefore, this study aimed to detect nitrogen and water-deficit-stress levels in tomato seedlings on the single-plant and plug-tray unit scale using multispectral and hyperspectral imaging. Although these types of stress may not be immediately visible during early seedling development, detecting them early is critical for commercial seedling production. The early identification of suboptimal nitrogen levels or water stress allows nursery managers to implement precise corrective measures before plant quality is compromised, thus reducing waste, optimizing resource use, and ensuring uniform, high-quality seedlings for growers. Nitrogen and water-deficit-stress levels were set within specific ranges that reflect realistic conditions during commercial production, and vegetation indices were analyzed using multispectral data.
Materials and Methods
Plant materials and growth conditions
Nitrogen stress
The experiment was conducted from March 7 to April 23 of 2024 in a smart greenhouse at Jeonbuk National University in Jeonju (35° 50' 38" N 127° 07' 45" E). Seeds were sown in 50-cell plug trays using a fertilizer-free nursery medium (Hanaeum Horticulture Fertilizer-Free Nursery Media; Sinsung Mineral Co., Goesan, Republic of Korea) and grown for 46 days. Eleven growth parameters were measured, with five replications at the single-plant unit scale and three replications at the plug-tray unit scale for each treatment group.
Water-deficit stress
The experiment was conducted from March 27 to May 2, 2024 in a smart greenhouse at Jeonbuk National University in Jeonju (35° 50' 38" N 127° 07' 45" E). Seeds were sown in 50-cell plug trays using Bunong horticulture nursery media (Bunong Co., Gyeongju, Republic of Korea) and were allowed to grow for 36 d. Eleven growth parameters were measured, with five replications at the single-plant unit scale and three replications at the plug-tray unit scale for each treatment group.
Nitrogen- and water-deficit stress treatments
Nitrogen stress
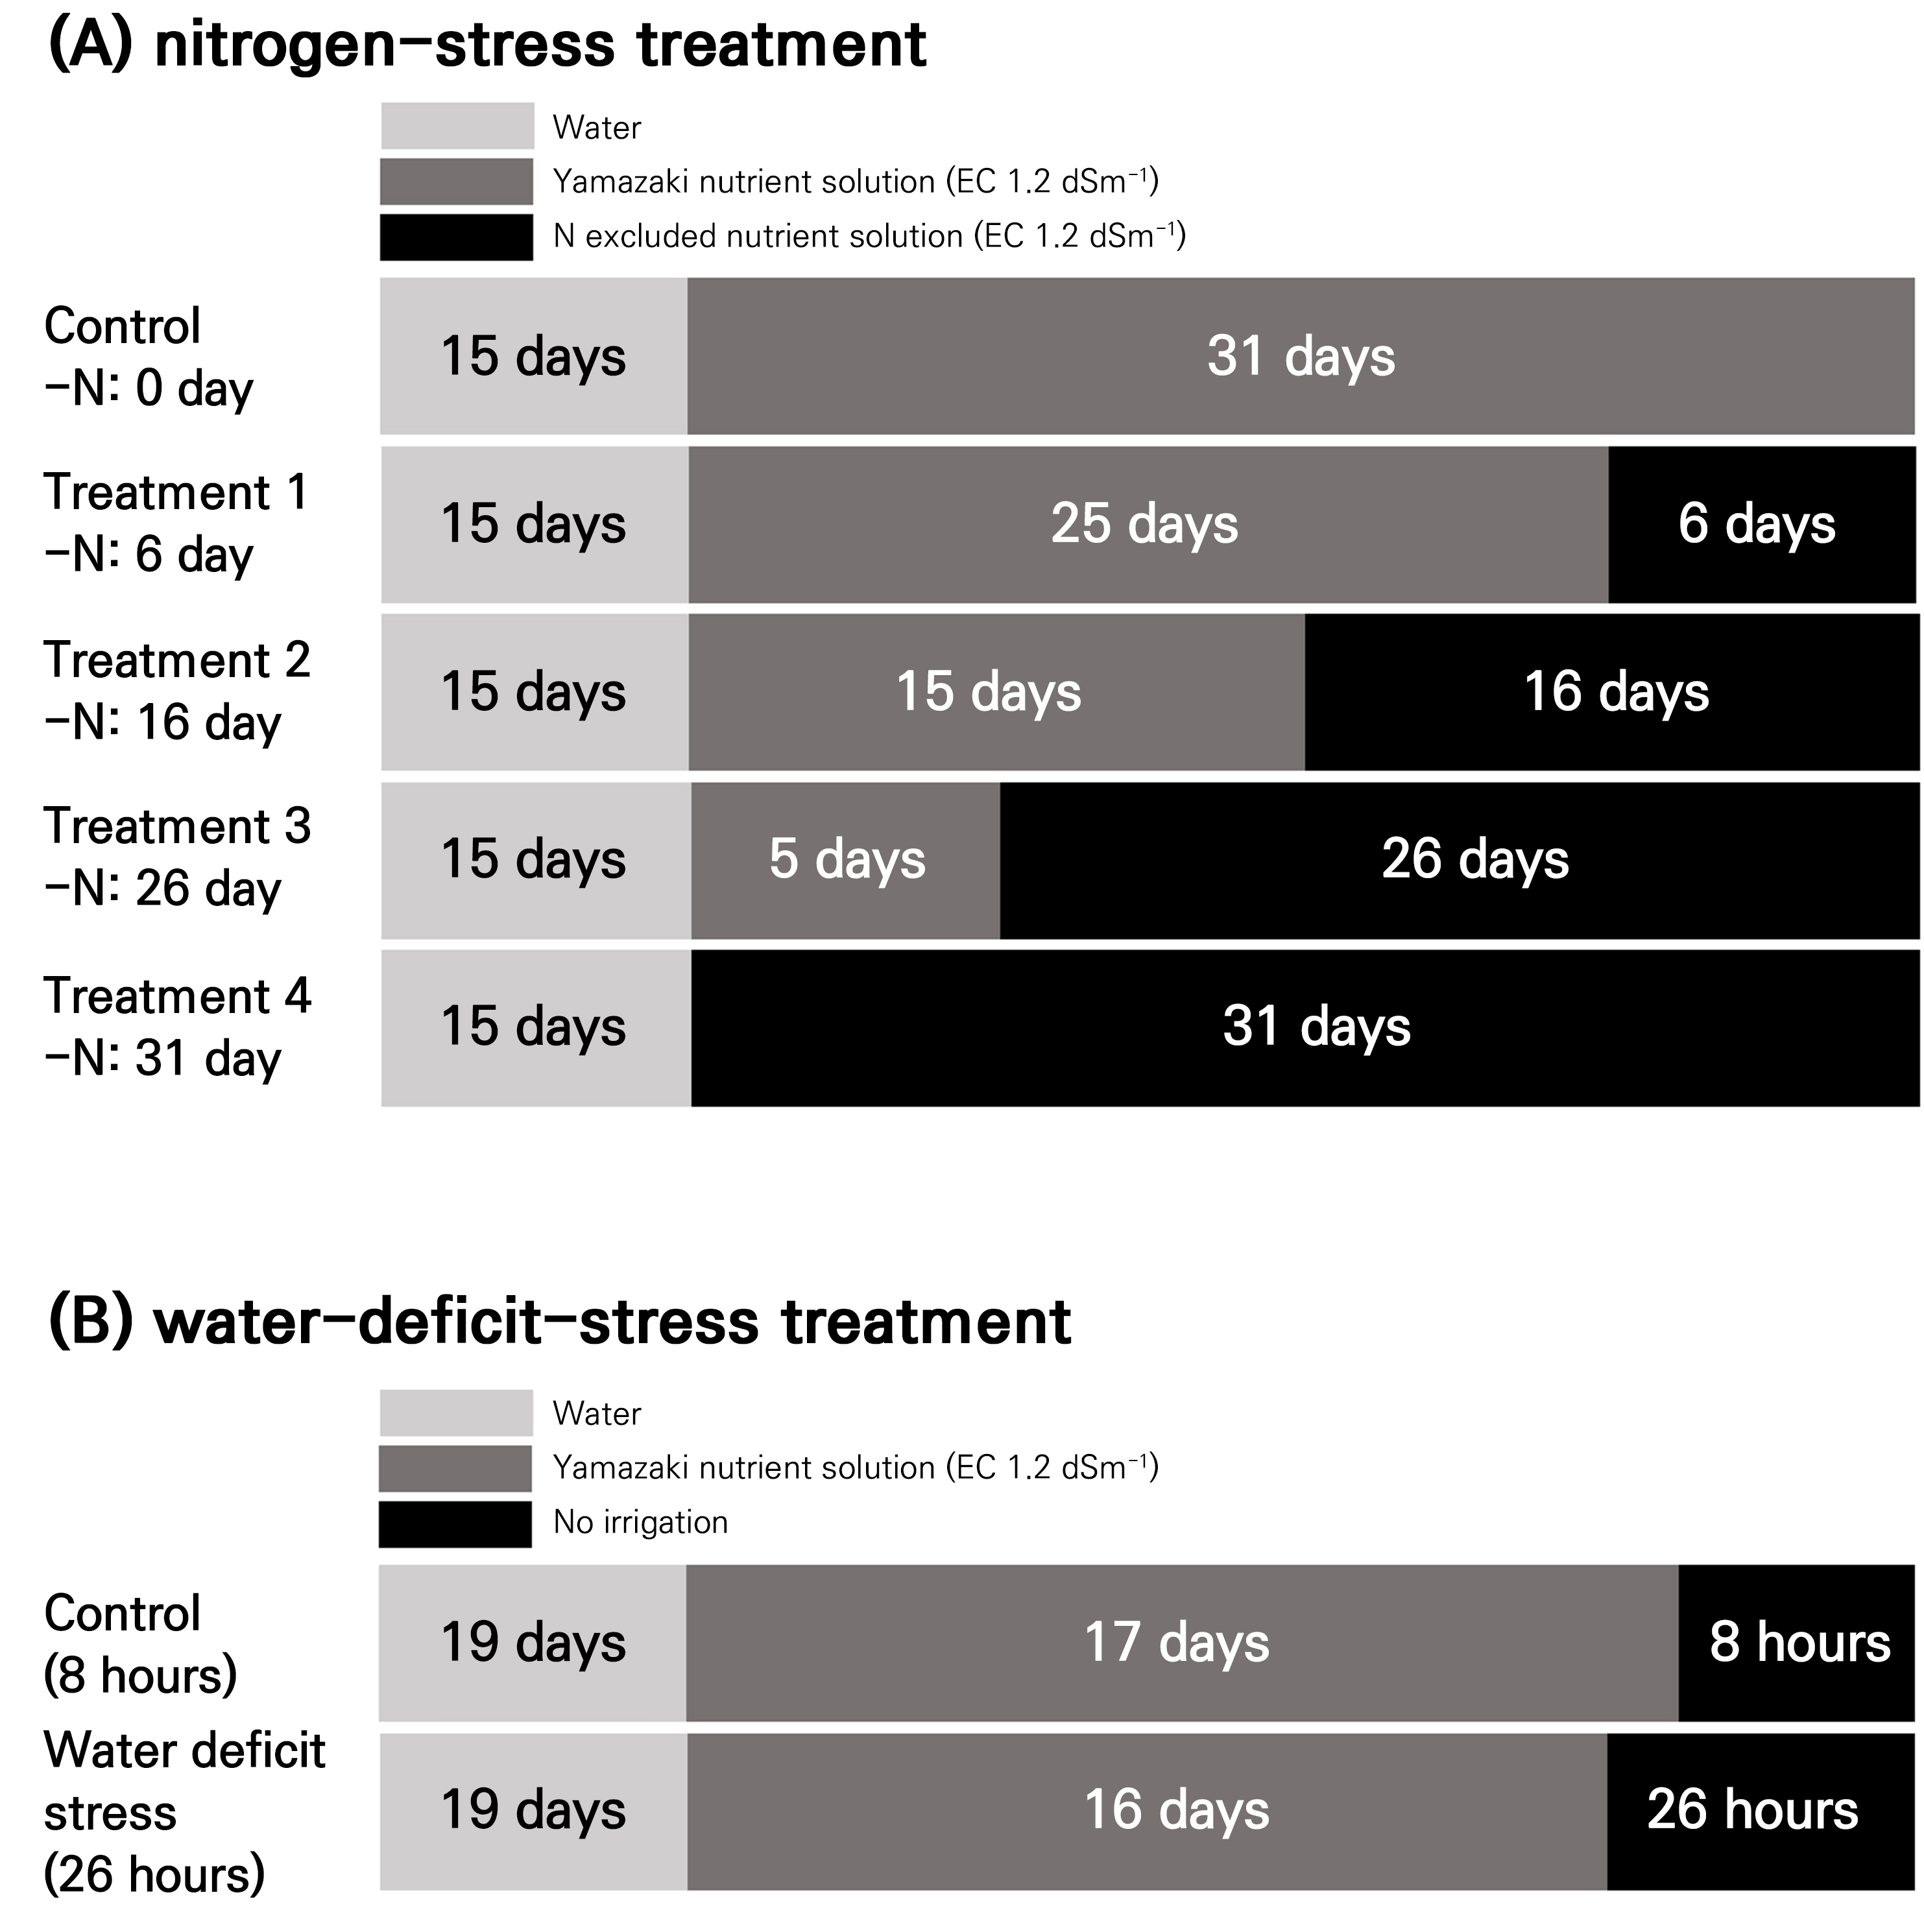
In this study, tomato seedlings of the ‘TY Sharmang’ cultivar (The Kiban Co., Anseong, Republic of Korea) were used. The seedlings were initially irrigated with plain water for 15 days, after which they were supplied with nutrient solutions with electrical conductivity of 1.2 dS·m-1. Two nutrient solutions were prepared for this experiment: a control treatment using the standard Yamazaki solution for tomatoes (RDA 2020) and a nitrogen-stress treatment with nitrogen completely excluded. The control treatment (Yamazaki solution) contained macroelements in the following concentrations (in me·L-1): nitrate (NO3‒) at 7.0, ammonium (NH4+) at 0.7, phosphorus (P) at 2.0, potassium (K) at 4.0, calcium (Ca) at 3.0, magnesium (Mg) at 2.0, and sulfur (S) at 2.0. In the nitrogen-stress treatment, both nitrogen sources (NO3‒ and NH4+) were completely eliminated while maintaining all other macroelements at concentrations identical to that of the control. For both nutrient solutions, microelement concentrations were maintained at the following identical levels (in ppm): iron (Fe) at 2.0, boron (B) at 0.2, manganese (Mn) at 0.2, zinc (Zn) at 0.02, copper (Cu) at 0.01, and molybdenum (Mo) at 0.005. The experiment consisted of five treatment groups. The control group was irrigated with the standard Yamazaki nutrient solution continuously for 31 days. The four nitrogen-stress treatment groups (designated as Treatments 1, 2, 3, and 4) were subjected to nitrogen deficiency for varying durations. Specifically, Treatments 1, 2, 3, and 4 received the nitrogen-excluded nutrient solution for 6, 16, 26, and 31 days, respectively, before the growth parameters were measured. These measurements corresponded to 41, 31, 21, and 16 days, respectively, after sowing. The experimental design allowed for the systematic assessment of the effects of the nitrogen stress duration on tomato seedling development, with shorter exposure times in Treatment 1 (6 days) and progressively longer exposure times in Treatments 2, 3, and 4 (up to 31 days of continuous nitrogen stress) (Fig. 1A). In this study, nitrogen deficiency was induced by replacing nitrate (NO3‒) with chloride (Cl‒) ions in the nutrient solution. While Cl‒ was intended to inhibit nitrate uptake competitively, it is acknowledged that Cl‒ itself may exert independent physiological effects on plant growth, with possible effects on osmoregulation and the ionic balance. The concentration of Cl‒ used in this study was determined based on earlier work that targeted nitrogen uptake suppression; however, its specific effects on the results beyond nitrogen restriction were not separately evaluated.
Water-deficit stress
In this study, tomato seedlings of the ‘TY Sharmang’ cultivar (The Kiban Co., Anseong, Republic of Korea) were used. The seedlings were watered with tap water for 20 days after sowing when the true leaves unfolded. After the true leaf stage, the plants were irrigated with the Yamazaki tomato nutrient solution with electrical conductivity of 1.2 dS·m-1 using sub-irrigation to ensure uniform water absorption in the plug trays. Hyperspectral imaging was conducted on May 2, 2024, from 4 to 5 PM. Before imaging, plants in the control and water-deficit-stress treatments were not watered for 8 h and 26 h, respectively (Fig. 1B).
Measurement of growth parameters
Eleven growth parameters were quantified: plant height, leaf length, width, area, and number; stem diameter; SPAD (soil and plant analysis development) value; shoot fresh and dry weight; and root fresh and dry weight. Plant height was measured from the soil surface to the growing point. Leaf length and width were measured using the largest true leaf. Leaf number and area were measured using true leaves longer than 2 cm. Leaf area was measured using the ImageJ program (National Institutes of Health, Bethesda, USA), and the SPAD value was measured using a SPAD meter (SPAD-502Plus, Konica Minolta, Osaka, Japan). The fresh weights of the shoots and roots were measured using a scale. Shoot and root dry weights were measured after drying in an oven (HB-502M, Hanbeak Science, Bucheon, Republic of Korea) at 80°C for at least 72 h.
Spectral imaging analysis
Spectral imaging
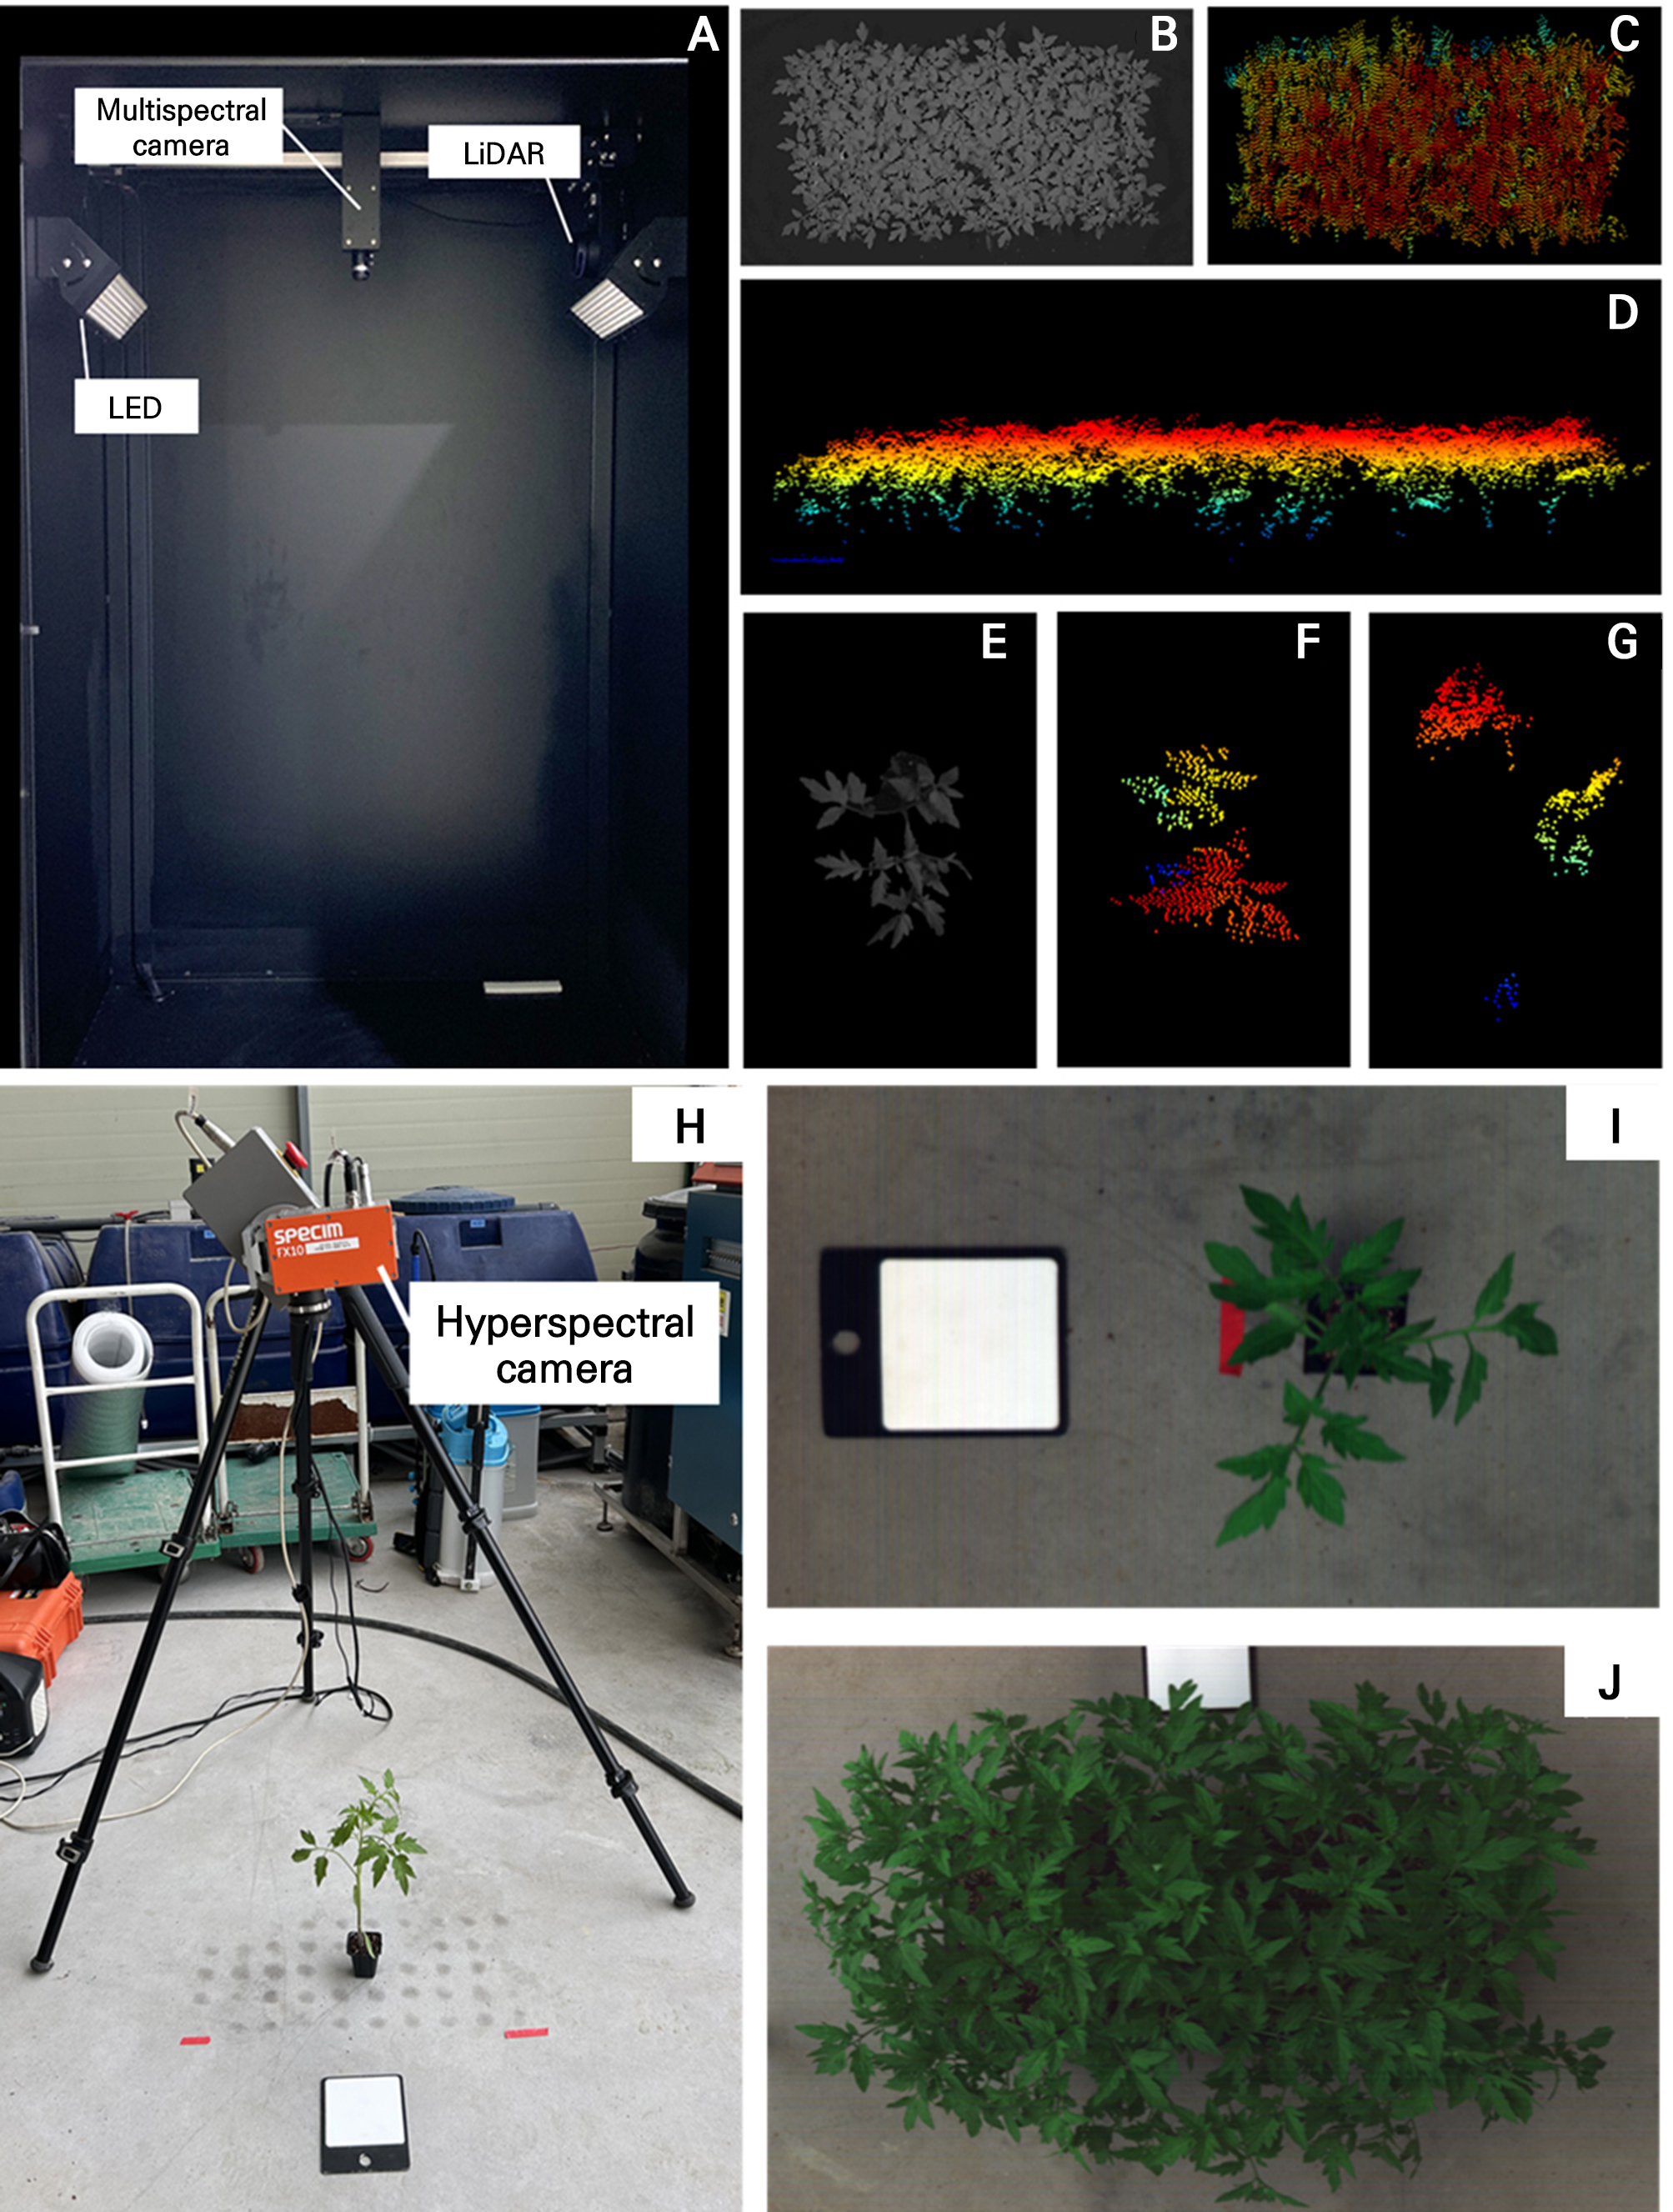
Multispectral images were obtained using a plant image measurement system (PIMS) (Fig. 2). The PIMS was equipped with a multispectral camera (FS-3200T-10GE-NNC, JAI Corp., Denmark), a LiDAR sensor (RP LiDAR A3M1, SLAMTEC, China), and LED lights. The seedlings were imaged at RGB (450, 550, and 650 nm, respectively), near-infrared 1 (NIR1; 750 nm), and near-infrared 2 (NIR2; 830 nm) wavelengths. Hyperspectral images were obtained using a hyperspectral camera (FX10, Specim, Finland) covering a wavelength range of 400–1,000 nm and including 224 bands.
Spectral image analysis
The images acquired through the multispectral and hyperspectral cameras in the PIMS were preprocessed, and the vegetation’s reflectance was extracted using ENVI v5.3 (SulSoft, Porto Alegre, Brazil). Using the reflectance extracted from the multispectral images, vegetation indices, in this case the normalized difference vegetation index (NDVI), green normalized difference vegetation index (GNDVI), and green chlorophyll index (CIgreen), were calculated. In the calculations, the NIR reflectance is the average of the reflectance values at the NIR1 (750 nm) and NIR2 (830 nm) wavelengths. The red and green reflectance values were from the 650 nm and 550 nm wavelengths, respectively.
Analysis of stress-related substances
Chlorophyll (Chl) content
A chlorophyll analysis was conducted using the methods described by Warren (2008) and Shin et al. (2020). Dried tomato plant samples (0.05 g) were extracted with 10 mL of methanol at room temperature in the dark for a minimum of 8 h. The extracted solution was filtered using a 0.22 µm syringe filter (291019205, Thermo Fisher Scientific Oy, Vantaa, Finland), and the absorbance was measured at 652 and 665 nm using a microplate reader (Multiskan Go; Thermo Fisher Scientific Oy) with three technical replications.
Proline content
A proline analysis was conducted following Bates et al. (1973) and Shin et al. (2020). Frozen and dried tomato plant samples (0.05 g) were extracted with 4 mL of 3% 5-sulfosalicylic acid, vortexed, and incubated at room temperature for at least 30 min. The extracted solution was filtered using a 0.22 µm syringe filter (291019205). In a 15 mL conical tube, 500 µL each of the supernatant, acid ninhydrin, and acetic acid were added and incubated in a water bath at 90°C for 1 h. The mixture was then quickly cooled in a refrigerator for at least 10 min, 1 mL toluene was added, and the mixture was vortexed. The toluene phase (200 µL) was placed in a 96-well plate in technical duplicates, and the absorbance was measured at 520 nm using a microplate reader (Multiskan Go).
Total nitrogen content
The total nitrogen content was analyzed using the Dumas combustion method (Bhati and Raliya 2022) with an automatic elemental analyzer (FlashSmart, Thermo Fisher Scientific, Waltham, MA, USA). Frozen and dried samples were placed in tin capsules and injected into a combustion reactor set to 950°C using an autosampler. Subsequently, oxygen was introduced, causing the sample to combust. The temperature during combustion rose to 1,800°C, and the resulting gases were separated as they passed through a gas chromatography column, with detection achieved using a thermal conductivity detector. The analysis report was generated using EagerSmart Data Handling Software (v1.00, Thermo Fisher Scientific).
Statistical analysis
The growth measurement and analysis results are presented as mean values (n = 5 at the single-plant unit scale and n = 3 at the plug-tray unit scale). Statistical analyses were performed using RStudio software (v4.4.0, RStudio Desktop, Boston, MA, USA). In the nitrogen-stress experiment, an analysis of variance followed by Duncan’s multiple range test was used to analyze statistical differences among the mean values at p < 0.01. In the water-deficit-stress experiment, a t-test was used to analyze the statistical differences between the mean values at a significance level of p < 0.05. Regression and correlation analyses were conducted using Microsoft Office Excel 2019 (Microsoft Corporation, Redmond, WA, USA), and all graphs were created using SigmaPlot v12.5 (Systat Software Inc., San Jose, CA, USA).
Results and Discussion
Nitrogen stress
Effects of stress on the major plant growth parameters of single plants and plug-tray units
During the seedling period, nitrogen in the nutrient solution was excluded at four levels (for 6, 16, 26, and 31 d before measurement). Differences in the morphological characteristics (Fig. 3) and in ten major growth parameters between the control group (continuously grown in a standard nutrient solution containing nitrogen) and the nitrogen-free groups were analyzed (Table 1). Significantly reduced growth was noted when the nitrogen supply was excluded for more than 16 days during the 46-day seedling period. Even when nitrogen was excluded for six days, some degree of growth reduction was observed compared to the control group, but it was not severe.
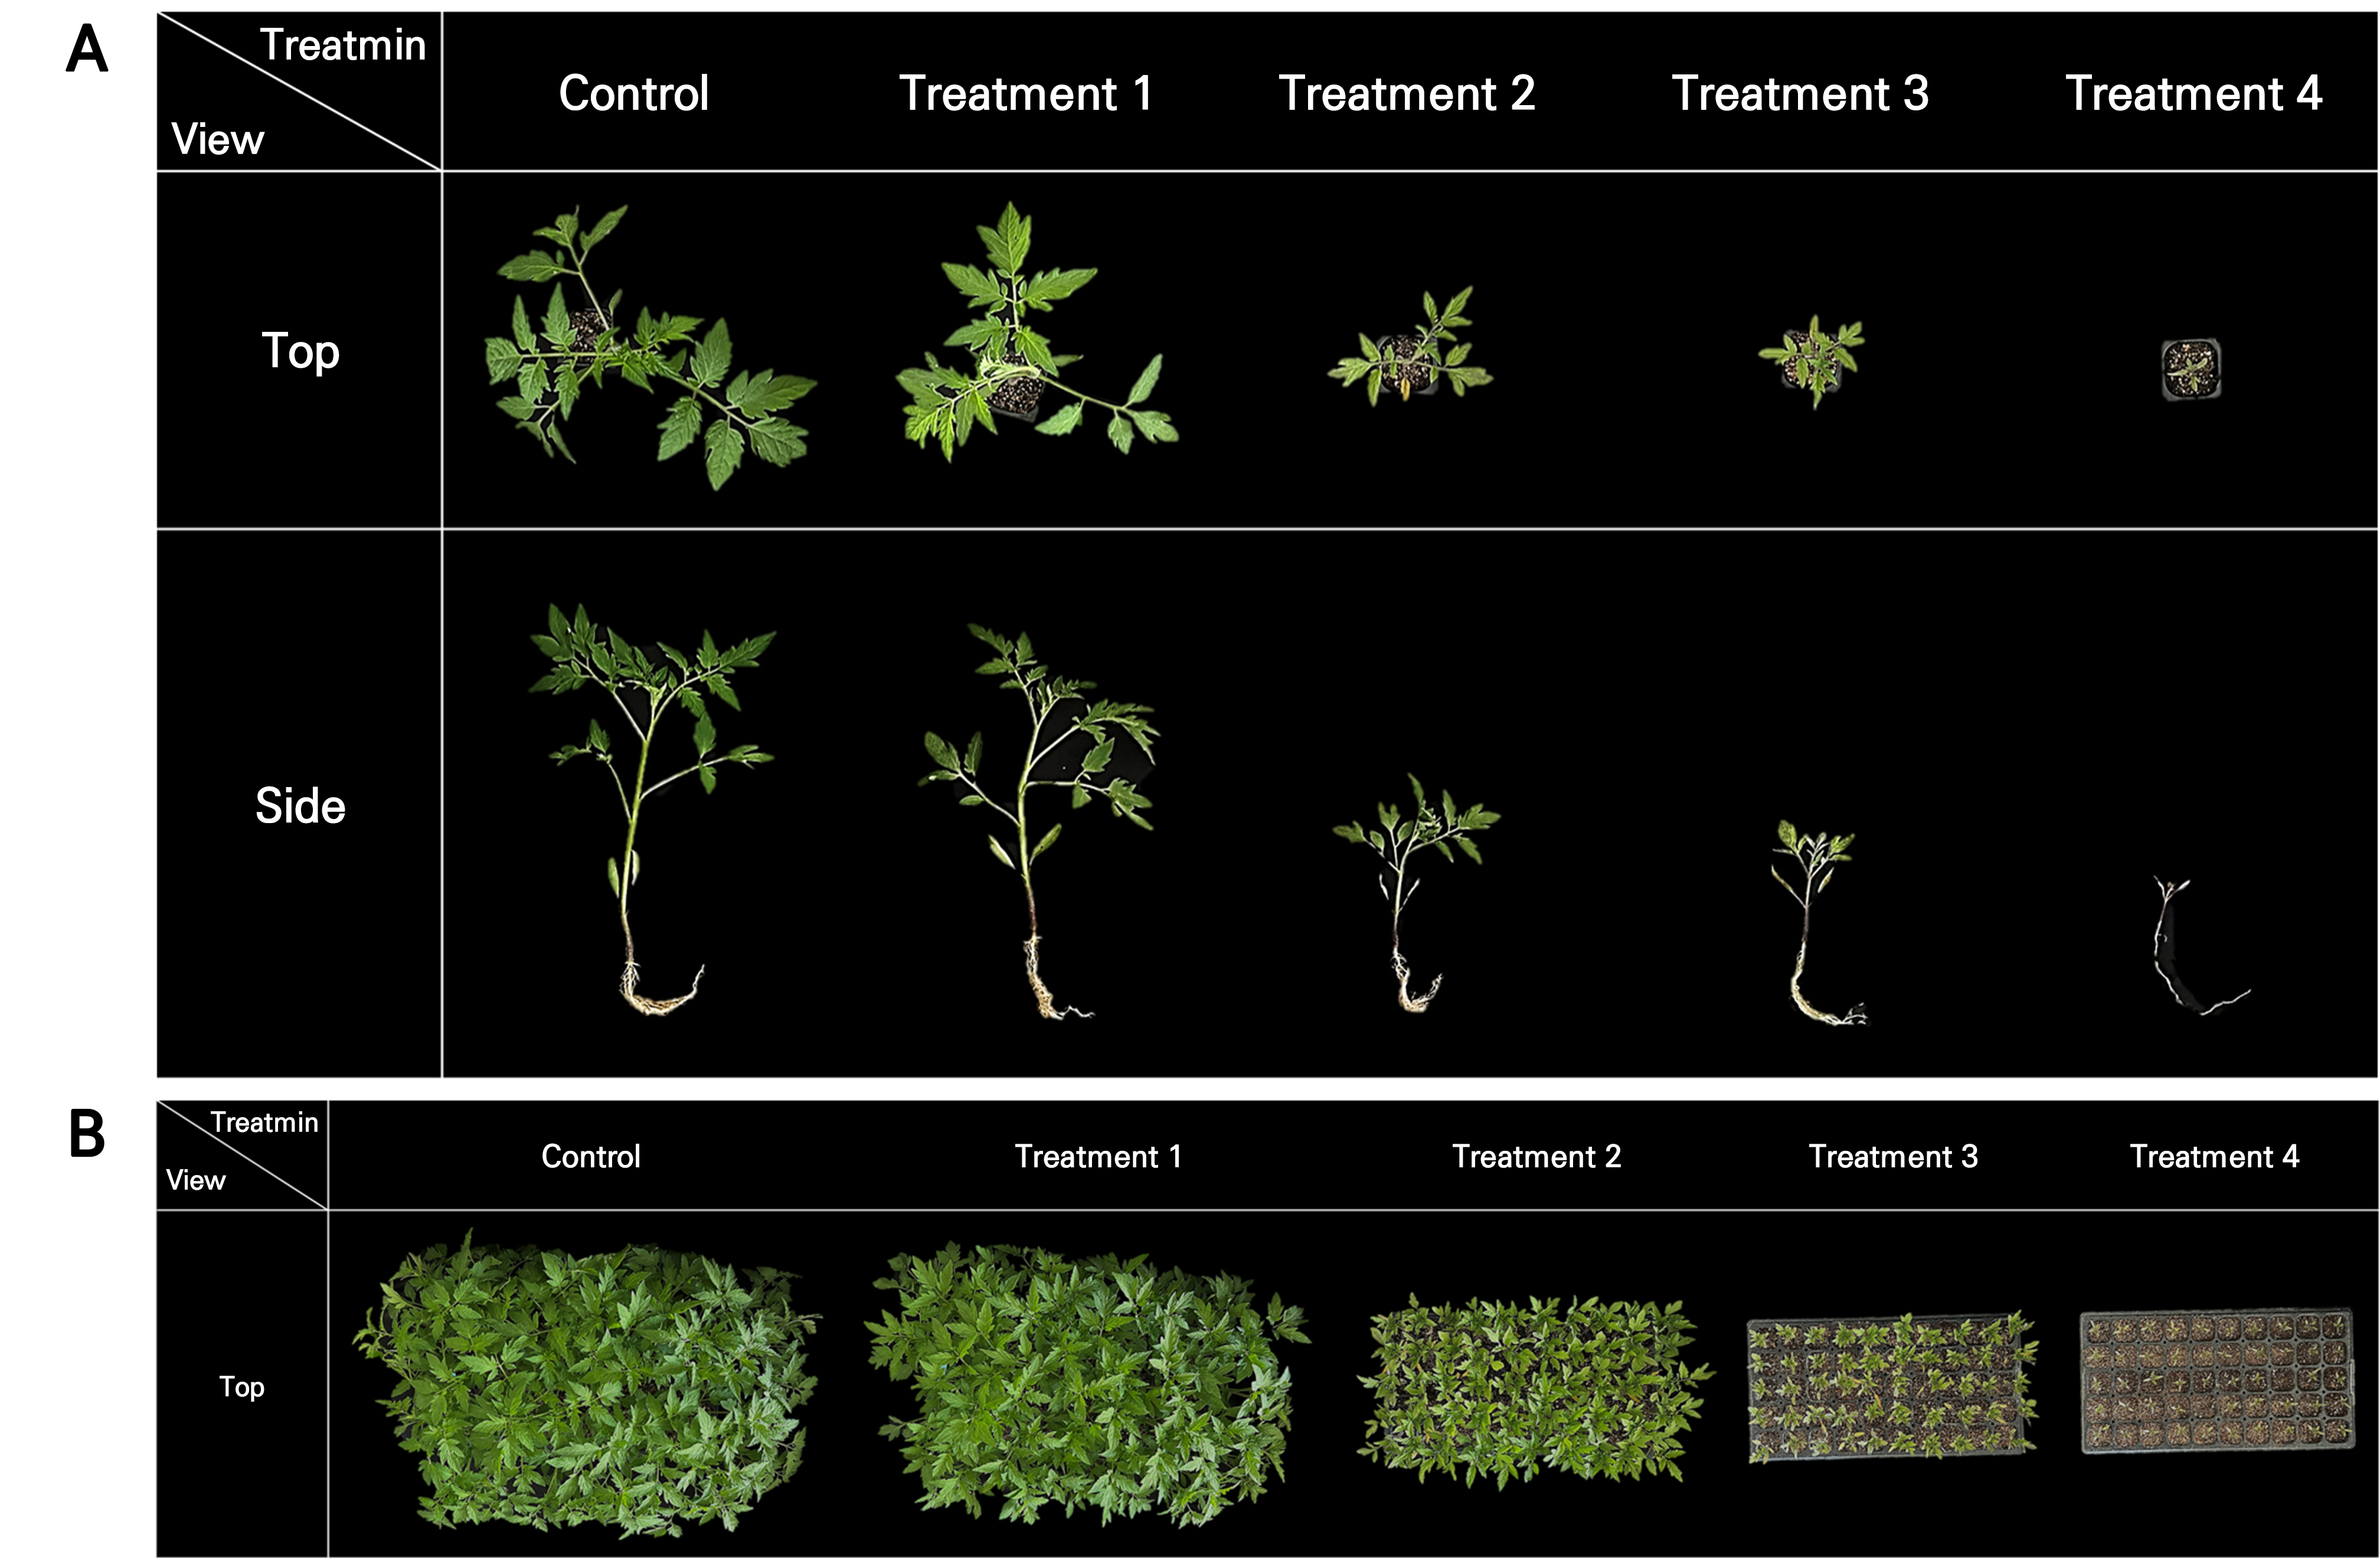
Nitrogen deficiency symptoms were easily distinguishable by the yellowing of the cotyledons and true leaves (Fig. 3). All ten growth parameters analyzed decreased as the level of nitrogen restriction increased. In treatment 1, which had the lowest level of nitrogen restriction, the plant height, leaf area, and fresh weight decreased by 19.3%, 19.6%, and 20.3%, respectively, compared to the control group. However, when nitrogen was excluded during the entire seedling period (treatment 4), the fresh weight decreased drastically to 97.5% of the control group’s value (Table 1). Because identifying nitrogen deficiency symptoms by means of a visual inspection is challenging in nurseries where proper nutrient management is practiced, this study focused on determining whether nutrient stress could be distinguished between the control group and treatment 1 (nitrogen exclusion for < 6 days).
Table 1.
Growth characteristics of tomato seedlings after nitrogen-stress treatments
| Treatmentz |
Plant height (cm) |
Leaf length (cm) |
Leaf width (cm) | Leaf number |
Stem diameter (mm) |
Leaf area (cm2) | Fresh weight (g) | Dry weight (g) | |||
| Shoot | Root | Shoot | Root | ||||||||
| Control | 25.72 a | 12.90 a | 11.38 a | 6.40 a | 4.70 a | 130.43 a | 7.769 a | 1.310 b | 0.7104 a | 0.0978 a | |
| Treatment 1 | 20.76 b | 10.80 b | 10.30 b | 6.20 a | 4.70 a | 104.75 b | 6.194 b | 1.550 a | 0.6250 a | 0.1066 a | |
| Treatment 2 | 10.16 c | 7.06 c | 6.86 c | 4.20 b | 3.21 b | 32.17 c | 2.197 c | 0.782 c | 0.3390 b | 0.0631 b | |
| Treatment 3 | 6.98 d | 5.10 d | 4.40 d | 3.60 b | 2.59 c | 14.05 d | 1.108 d | 0.501 d | 0.1835 c | 0.0428 c | |
| Treatment 4 | 4.06 e | - | - | - | 1.89 d | - | 0.196 e | 0.094 e | 0.0264 d | 0.0100 d | |
Chlorophyll, proline, and total nitrogen contents
Total chlorophyll, proline, and total nitrogen contents in the plants decreased linearly with an increase in the level of nitrogen stress (Fig. 4). Compared to the control group, which had a total chlorophyll content of 10.37 mg·g-1 DW, the nitrogen-stress treatment groups showed progressively lower levels at 6.90, 3.88, and 2.40 mg·g-1 DW (Fig. 4A). Chlorophyll is a primary photosynthetic pigment in plants, with a molecular structure in which four nitrogen atoms surround a central magnesium atom (Tanaka and Tanaka 2006). It was inferred that the excluded nitrogen supply hindered the synthesis and maintenance of chlorophyll.
Proline generally accumulates under stressful conditions and is used as a parameter to assess stress levels. It is the most reliable biochemical parameter for predicting drought stress (Shin et al. 2021). In this study, the proline content decreased with an increase in the nitrogen-stress levels under identical water conditions (Fig. 4B). This is similar to the findings of Albert et al. (2012), who found that proline levels decreased with higher nitrogen restriction, regardless of the internal water content.
Nitrogen is a major component of proteins, nucleic acids, and chlorophyll, which are crucial for normal plant growth and development. As the level of nitrogen stress was increased, the total nitrogen content of the plants decreased significantly. In this study, true leaves did not develop during the highest nitrogen-stress treatment (treatment 4), making a total nitrogen content analysis impossible. Seedlings exposed to 26 d of nitrogen stress (treatment 3) had a total nitrogen content of 0.89%, which was approximately 75% lower than that of the control group (3.57%) (Fig. 4C).
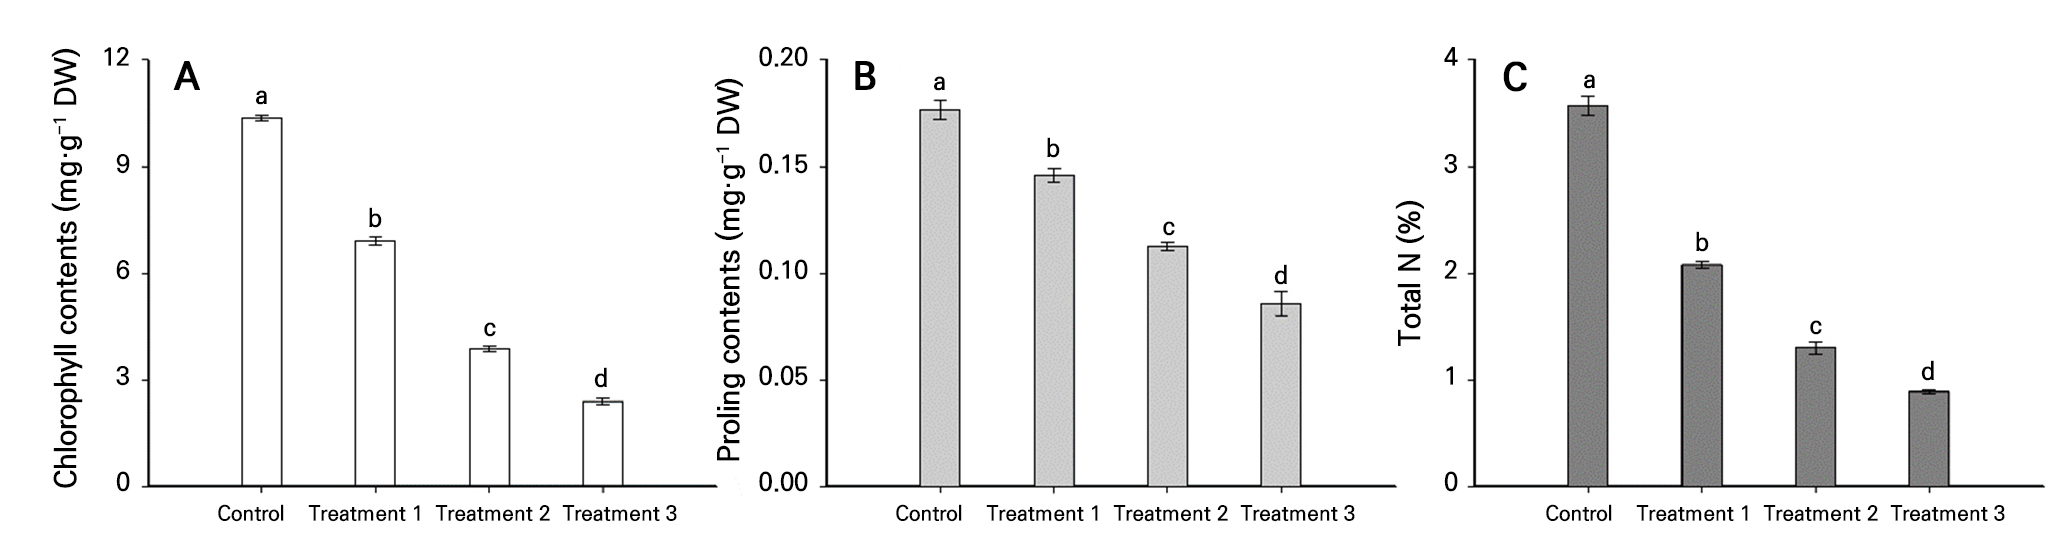
Fig. 4.
Chlorophyll (A), proline (B), and total nitrogen (C) contents under nitrogen-stress treatments. Treatment 1, 2, and 3 were irrigated with a nitrogen-excluded nutrient solution for 6, 16, and 26 days, respectively, before measurement. Error bars represent the standard deviation based on three replicates. Different letters indicate a significant difference at p < 0.01 according to Duncan’s multiple range test.
Analysis of multispectral images
Through multispectral imaging, differences in the NDVI, GNDVI, and CIgreen were observed when nitrogen was excluded for 16 d during the seedling period. The values for each index were higher in the plug-tray unit, which had a broader vegetation range, than in the single-plant unit. When nitrogen was excluded for six days or more (treatments 1–4), the stress levels increased significantly, as indicated by the indices. However, in treatment 4, where nitrogen was excluded for the longest period, true leaves did not develop, and the indices calculated from the spectral reflectance of the cotyledon deviated from the expected decreasing trend as the nitrogen-stress levels were increased (Table 2). Healthy plants show high light absorption at the red wavelength and increased light reflection at the near-infrared wavelength, which are combined to form the NDVI. The GNDVI is an index calculated by combining NIR and green wavelengths and has been reported to be highly correlated with the leaf nitrogen content in rice (Kim et al. 2007). CIgreen is an index that combines near-infrared and green wavelengths. In soybeans and corn, the CIgreen value calculated from the spectral reflectance showed a high coefficient of determination (0.92 and 0.93, respectively) with the chlorophyll content according to a linear regression analysis (Gitelson et al. 2005).
Table 2.
Vegetation indices after nitrogen stress in single plants and plug-tray units using multispectral imaging (550, 650, 740, and 850 nm)
| Treatmentz | NDVI | GNDVI | CIgreen | |||||
| Single plant | Plug tray | Single plant | Plug tray | Single plant | Plug tray | |||
| Control | 0.683 a | 0.749 a | 0.584 a | 0.663 a | 2.812 a | 3.939 a | ||
| Treatment 1 | 0.680 a | 0.738 b | 0.582 a | 0.651 b | 2.790 a | 3.727 b | ||
| Treatment 2 | 0.622 b | 0.670 c | 0.530 b | 0.600 d | 2.377 b | 3.004 d | ||
| Treatment 3 | 0.604 c | 0.632 d | 0.545 b | 0.596 d | 2.398 b | 2.949 d | ||
| Treatment 4 | 0.619 b | 0.624 e | 0.554 b | 0.621 c | 2.484 b | 3.278 c | ||
Analysis of hyperspectral images
Reflectance values in the 400–1,000 nm wavelength range were collected using a hyperspectral camera and graphed for each treatment, distinguishing between single-plant and plug-tray units (Fig. 5 and Table 3). For both single-plant and plug-tray units, changes in reflectance due to nitrogen stress were observed at 500–600 nm and at wavelengths above 750 nm. In single-plant units, significant reflectance differences were found only in treatments with extreme nitrogen-stress symptoms, where nitrogen was excluded for 26 days or more (treatments 3 and 4), making it difficult to distinguish stress at higher levels (Fig. 5A). In contrast, in the plug-tray unit, treatments that excluded nitrogen for 16 days or more (treatments 2, 3, and 4) showed clear differences in reflectance compared to the control group in both the 500–600 nm (green) and > 750 nm (near-infrared) wavelength regions. The differences clearly decreased in proportion to the degree of nitrogen restriction (Fig. 5B). When nitrogen was excluded for less than six days (treatment 1), only minor differences were observed at wavelengths above 750 nm, which are unlikely to be practically useful for distinguishing stress levels. The results of the analysis of both single plants and plug-tray units showed that the reflectance wave pattern above 750 nm was similar to those in studies that assessed the nitrogen nutritional status in apple leaves (Jang et al. 2022) and estimated the water content in cucumber and watermelon seedlings (Kim et al. 2018). This similarity is likely due to the influence of the optical measurement environment and the characteristics of the imaging equipment used. The reduced reflectance values in the near-infrared wavelength region under high nitrogen-stress levels matched the findings of prior research, where a reduced nitrogen application in apple leaves resulted in lower spectral reflectance around 750 nm (Jang et al. 2022). To compare the reflectance values between treatments in wavelength ranges that showed differences due to nitrogen stress, specific wavelengths within the 500–600 nm range and above 750 nm ranges were selected. At 556 nm, which had the highest reflectance value for the control group within the 500–600 nm range, single-plant units showed higher values than plug-tray units, with the reflectance decreasing proportionally with the level of nitrogen restriction. Both single plants and plug-tray units showed significant differences between treatments 3 and 4. At 756 nm, the peak wavelength of the first reflectance wave above 750 nm for the control group, the reflectance decreased as nitrogen stress was increased. This decrease was more pronounced in the plug-tray units than in the single-plant units. The finding of higher reflectance values in the control group compared to the nitrogen-stress treatments is in good agreement with previous studies (Jang et al. 2022).
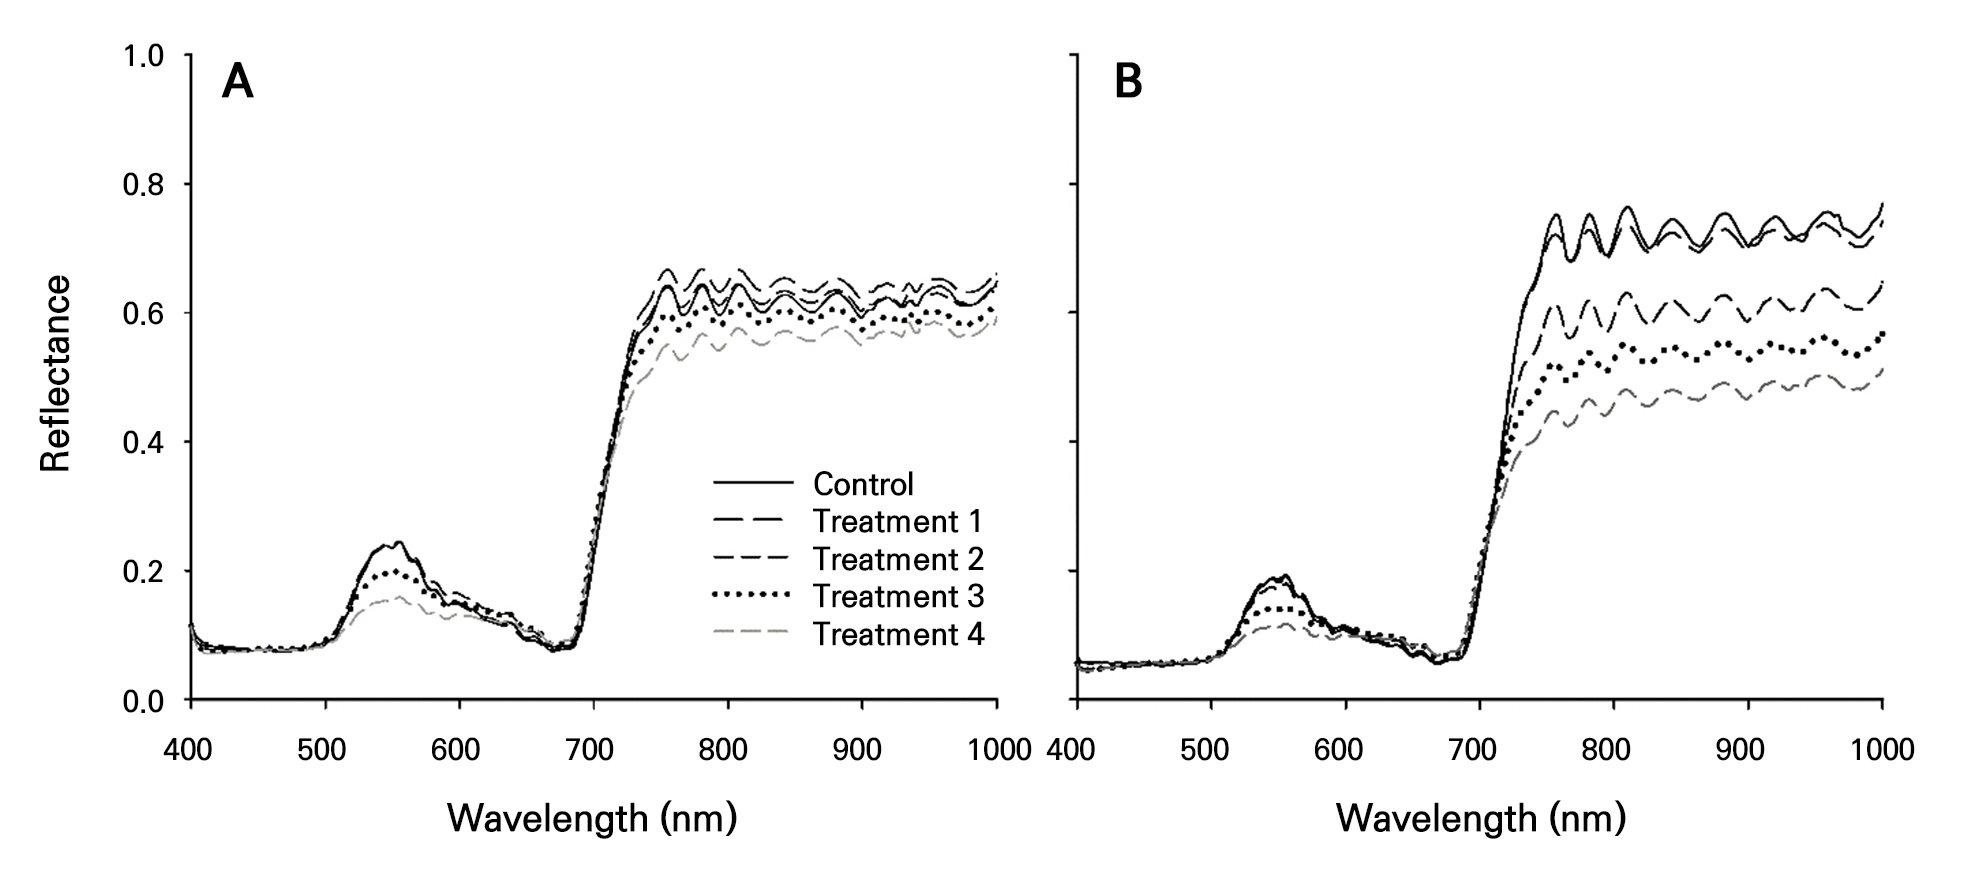
Fig. 5.
Reflectance values obtained from hyperspectral images (400–1,000 nm) after nitrogen-stress treatments in single-plant (A) and plug-tray (B) units. The reflectance values were the average values of five replicates for the single-plant units and three replicates for the plug-tray units. Treatment 1, 2, 3, and 4 were irrigated with a nitrogen-excluded nutrient solution for 6, 16, 26, and 31 days, respectively, before imaging.
Table 3.
Reflectance values at 556 and 756 nm obtained from hyperspectral images of single plants and plug-tray units after nitrogen-stress treatments
Wavelengthz Treatmenty | 556 nm | 756 nm | |||
| Single plant | Plug tray | Single plant | Plug tray | ||
| Control | 0.2430 a | 0.1907 a | 0.6419 ab | 0.7517 a | |
| Treatment 1 | 0.2438 a | 0.1923 a | 0.6659 a | 0.7211 a | |
| Treatment 2 | 0.2429 a | 0.1794 a | 0.6387 ab | 0.6123 b | |
| Treatment 3 | 0.1997 b | 0.1452 b | 0.5980 bc | 0.5220 c | |
| Treatment 4 | 0.1587 c | 0.1174 c | 0.5508 c | 0.4473 d | |
zThe specific wavelengths chosen from those showing differences in reflectance values between the treatments: 556 and 756 nm.
yTreatments 1, 2, 3, and 4 were irrigated with a nitrogen-excluded nutrient solution for 6, 16, 26, and 31 d, respectively, before measurement.
Correlation analysis between image-based measurements and stress-related substance contents
The three indices derived from multispectral imaging (NDVI, GNDVI, and CIgreen) and the chlorophyll, proline, and total nitrogen contents under varying levels of nitrogen stress were correlated (Fig. 6A, 6B, and 6C). CIgreen showed very high coefficients of determination for chlorophyll (0.93) and the total nitrogen content (0.86), indicating its potential for predicting chlorophyll and nitrogen levels in tomato seedlings (Fig. 6A). For proline, the NDVI demonstrated a high R2 value of 0.94, suggesting that it is a reliable predictor (Fig. 6B). The correlation between the reflectance values at two specific wavelengths (556 and 756 nm) derived from hyperspectral imaging and the substance analysis was also examined (Fig. 6D, 6E, and 6F). Chlorophyll, proline, and the total nitrogen contents showed higher coefficients of determination (> 0.77) at 756 nm than at 556 nm, indicating that the 756 nm wavelength, which was the peak of the first reflectance wave for the control group, can be used to predict the levels of chlorophyll, proline, and internal nitrogen. Overall, the chlorophyll, proline, and total nitrogen levels showed higher coefficients of determination when vegetation indices calculated from multispectral imaging were used than when reflectance values from hyperspectral imaging were used. The CIgreen value was identified as the most accurate predictor of internal nitrogen levels in stressed plants based on varying levels of nitrogen restriction. A similar study predicting the nitrogen nutritional status in apple tree leaves using hyperspectral imaging (Jang et al. 2022) attempted to predict internal nitrogen levels. Similar to our research, that study found differences in reflectance values between the control and nitrogen-excluded treatments at approximately 550 nm and above 750 nm, with lower reflectance values in the nitrogen-excluded treatments. Attempts have also been made to correlate various vegetation indices derived from multispectral images obtained via unmanned aerial vehicles with the wheat nitrogen content (Walsh et al. 2018). At the Feekes 10 growth stage, the nitrogen content of wheat estimated based on the NDVI showed a high correlation with the measured nitrogen content (R2 = 0.89). CIgreen provided an even more accurate prediction than the NDVI. In our study, similar to previous research, CIgreen showed higher coefficients of determination than the NDVI for predicting the internal nitrogen content.
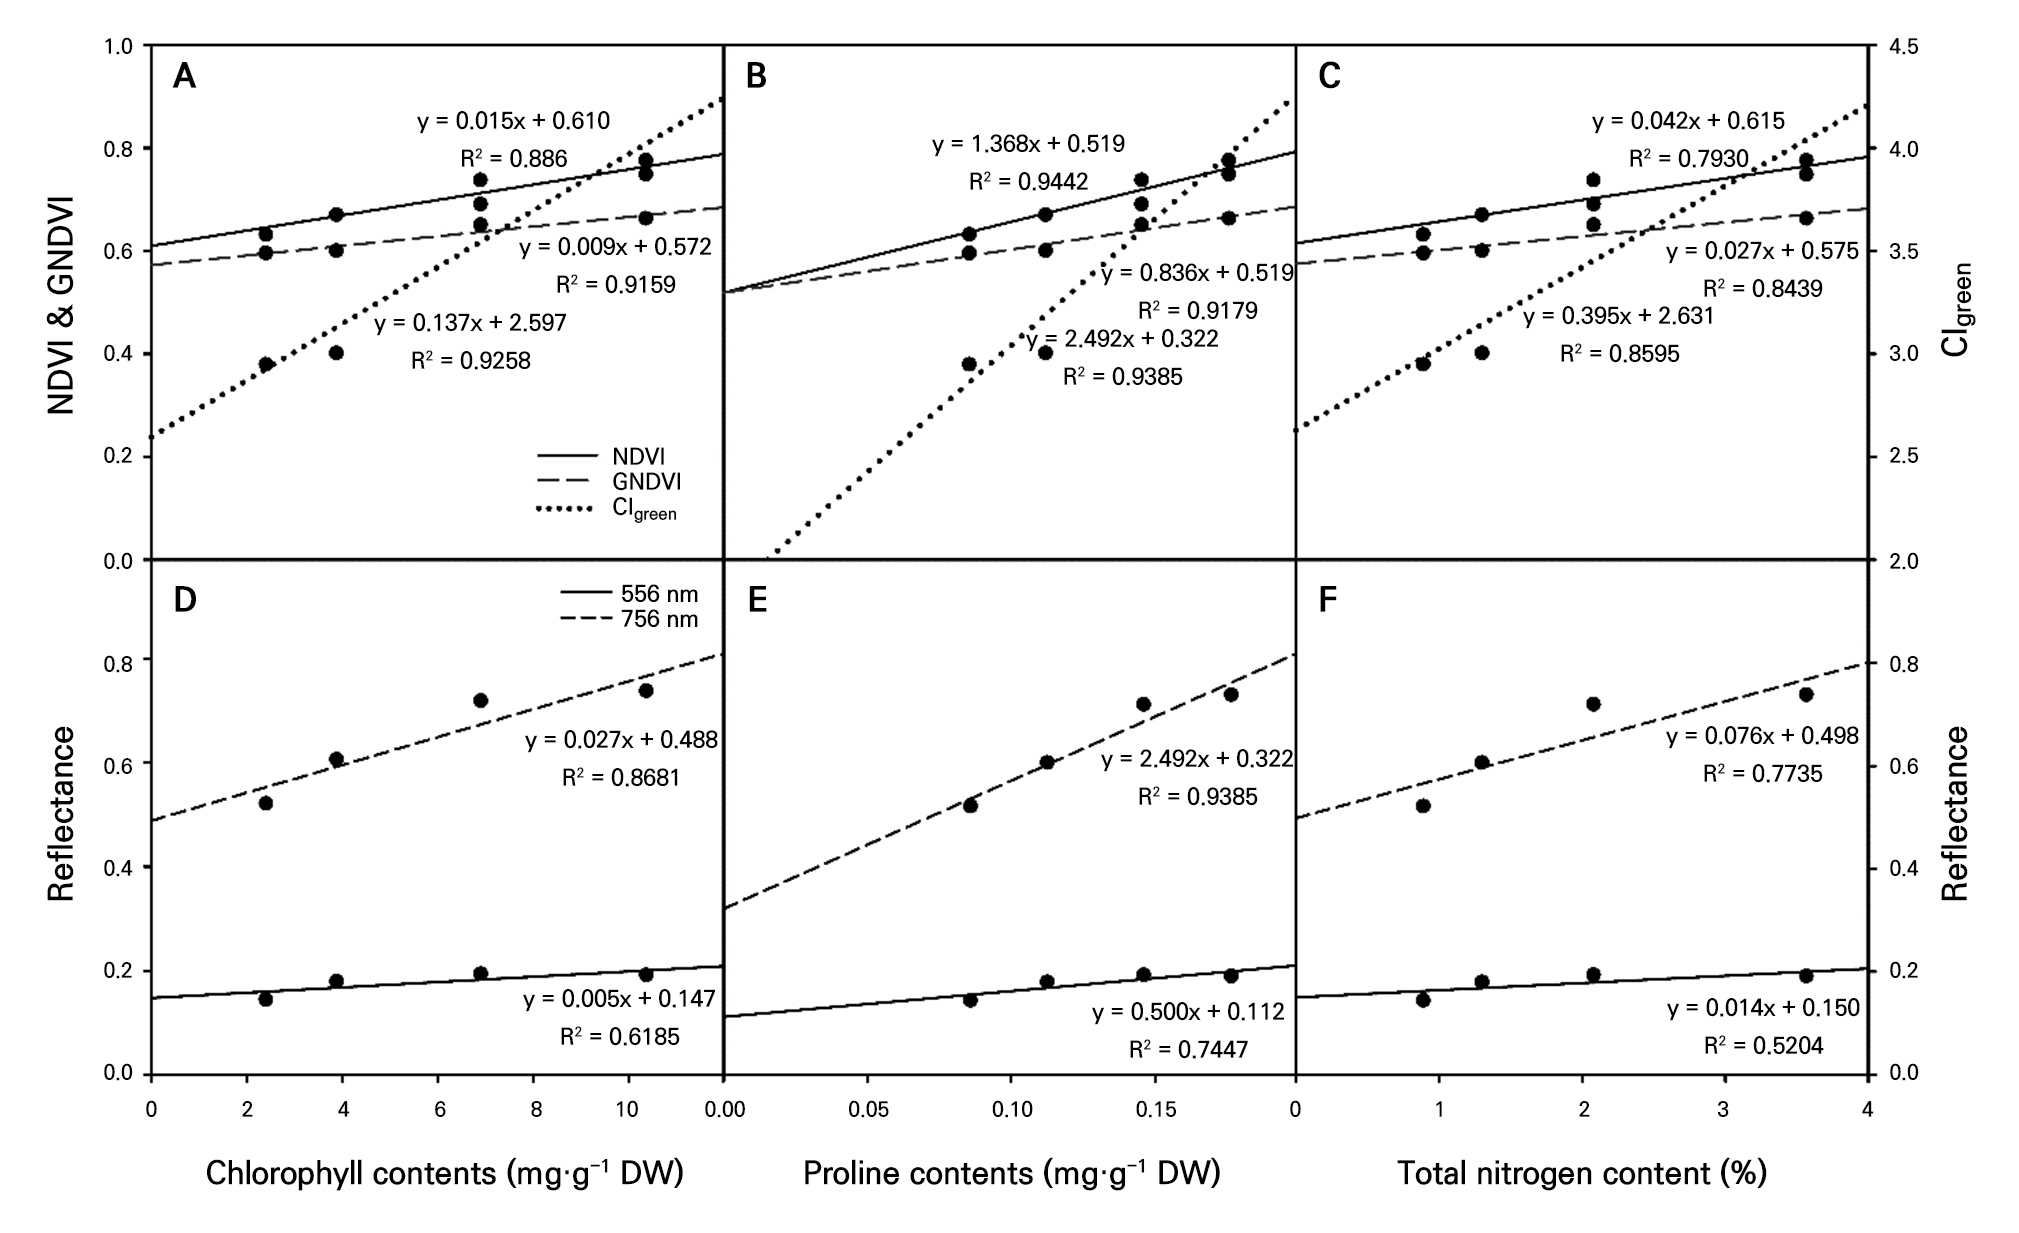
Fig. 6.
Correlation analysis between stress-related substances (chlorophyll, proline, and total nitrogen contents) and spectral image values (NDVI, GNDVI, CIgreen [A, B, C], and hyperspectral image reflectance [D, E, F]). The stress-related substances and spectral image values used were the average values of three replicates.
One limitation of this study is the potential physiological impact of the chloride ions used to induce nitrogen deficiency. Although Cl‒ was introduced to inhibit nitrate uptake, it may have had additional effects on plant physiology independent of nitrogen restriction. Future studies should include treatments that differentiate between the effects of Cl‒ itself and those of nitrogen deficiency while also testing a range of Cl‒ concentrations to validate the optimal level for selectively inducing nitrogen stress without introducing confounding ionic stress.
Water-deficit stress
Effect of stress on major plant growth parameters in single plants and plug-tray units
During the seedling period, the soil moisture content was consistently maintained. Before hyperspectral imaging, the soil moisture content was adjusted by withholding water. The control group received its last water 8 h before imaging, whereas the water-deficit-stress treatment group received its last water 26 h before imaging. Morphological characteristics (Fig. 7) and differences in ten major growth parameters were analyzed (Table 4). The root zone moisture contents amounted to 141.32% and 76.68% in the control and treatment groups, respectively. As soil moisture content decreased, slight wilting was observed in the treatment group. Apart from the leaf area and root fresh weight, no significant differences were observed between the treatments. It was inferred that withholding water for 8 h and 26 h before hyperspectral imaging did not significantly affect growth parameters other than the root fresh weight, as the seedlings were grown under identical greenhouse conditions. Regarding the leaf area and root weight, the statistical significance appeared to result from variations in growth within the trays. Although water deficiency in nurseries can be identified visually by wilting, it does not result in significant differences in growth parameters, making it difficult to assess its severity. Therefore, this study focused on determining whether water-deficit stress can be distinguished based on water content levels using imaging.
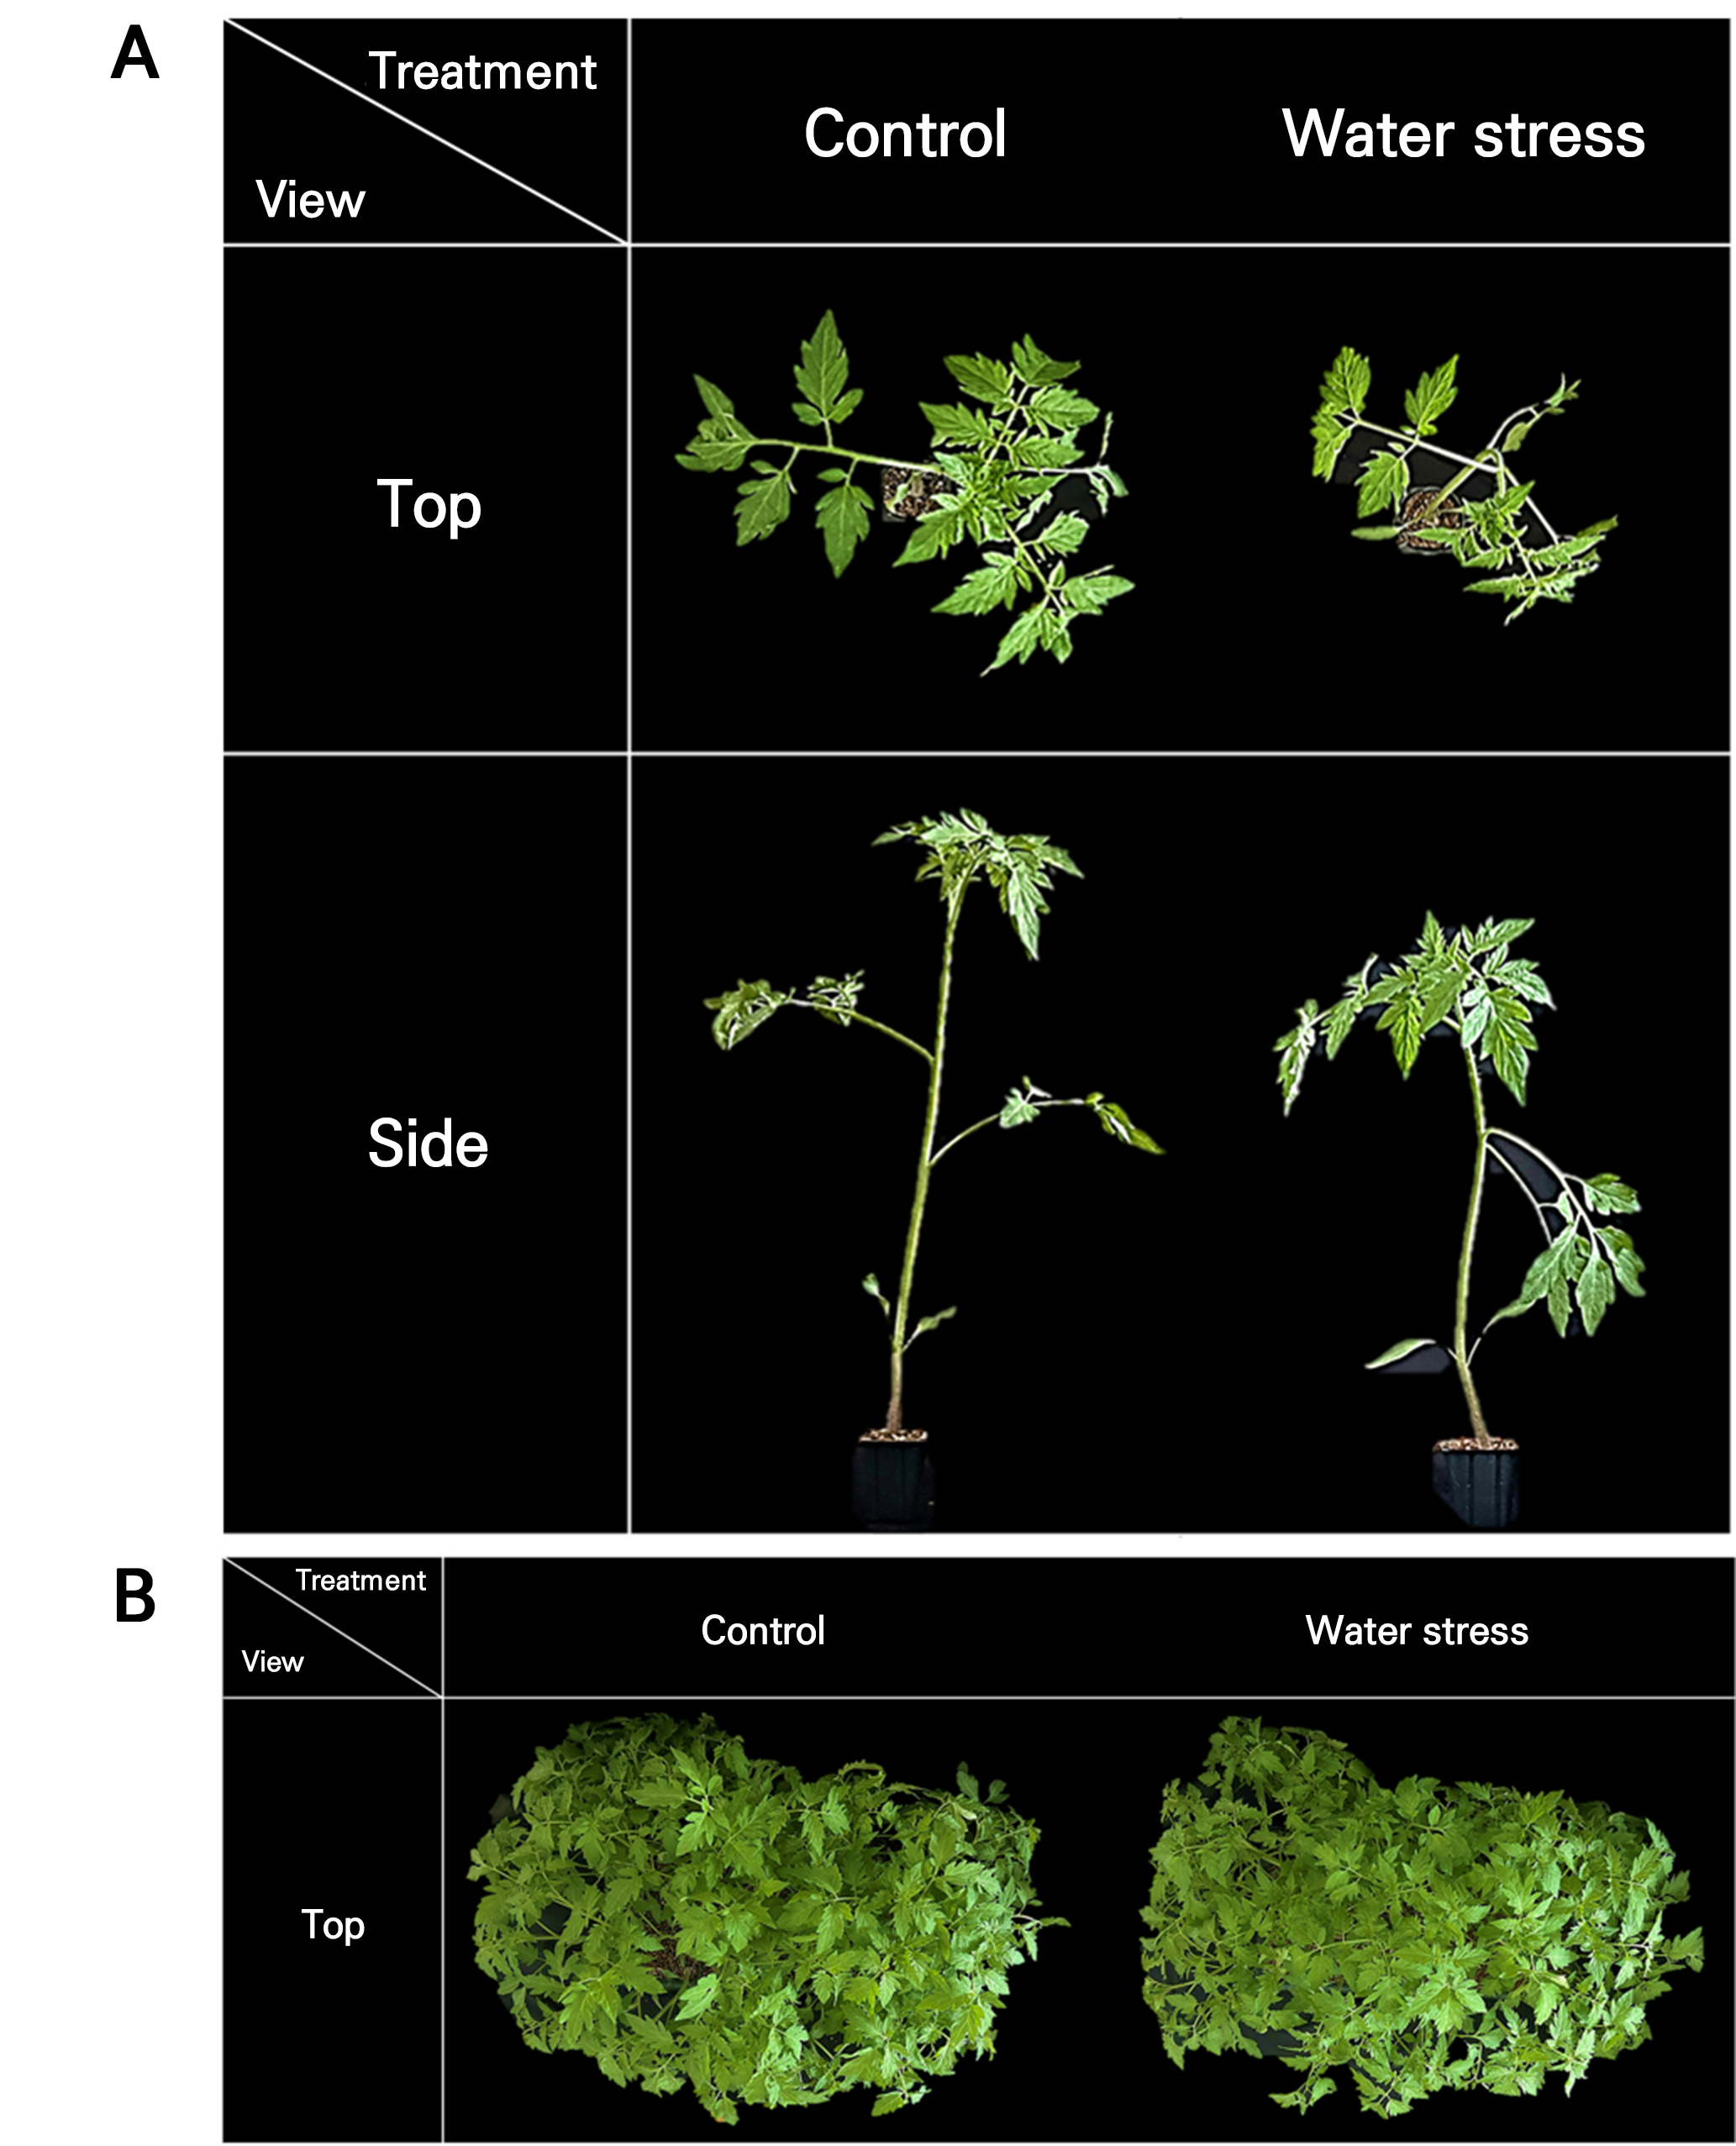
Table 4.
Effects of water-deficit stress on the growth parameters and proline content of tomato seedlings
| Treatmentz |
Plant height (cm) |
Leaf length (cm) |
Leaf width (cm) | Leaf number |
Stem diameter (mm) | Leaf area (cm2) | Fresh weight (g) | Dry weight (g) |
Proline contents (mg·g-1 DW) | ||
| Shoot | Root | Shoot | Root | ||||||||
| Control | 31.04 | 13.70 | 13.94 | 6.4 | 4.55 | 161.13 | 9.873 | 0.900 | 28.506 | 11.838 | 0.235 |
| Water-deficit stress | 31.32 | 14.32 | 14.40 | 6.2 | 4.66 | 179.93 | 10.415 | 0.941 | 19.826 | 11.223 | 0.293 |
| Significance | NS | NS | NS | NS | NS | * | NS | * | NS | NS | * |
Proline content
The control and water-deficit-stress groups were not watered for 8 and 26 h, respectively, before measurement. The proline content was higher in the water-deficit-stress treatment group (0.29 mg·g-1 DW) than in the control group (0.24 mg·g-1 DW; Table 4). This result is consistent with that of a previous study, which found that proline content increased as the level of drought stress was increased in lettuce (Shin et al. 2021).
Analysis of multispectral images
The analysis of the vegetation indices through multispectral imaging showed higher values in the plug-tray units, which had a broader vegetation range, than in the single-plant units. However, no significant differences were observed between the control and water-deficit-stress treatment groups (Table 5). The last watering session was conducted 8 and 26 h before hyperspectral imaging under the same conditions. While this was sufficient to observe wilting in the seedlings, it was not enough to cause significant changes in the vegetation indices.
Table 5.
Vegetation index after water-deficit stress in single plants and plug-tray units using multispectral imaging (550, 650, 740, and 850 nm)
| Treatmentz | NDVI | GNDVI | CIgreen | |||||
| Single plant | Plug tray | Single plant | Plug tray | Single plant | Plug tray | |||
| Control | 0.709 | 0.767 | 0.612 | 0.672 | 3.160 | 4.092 | ||
| Water-deficit stress | 0.707 | 0.757 | 0.612 | 0.667 | 3.155 | 4.008 | ||
| Significance | NS | NS | NS | NS | NS | NS | ||
Analysis of hyperspectral images
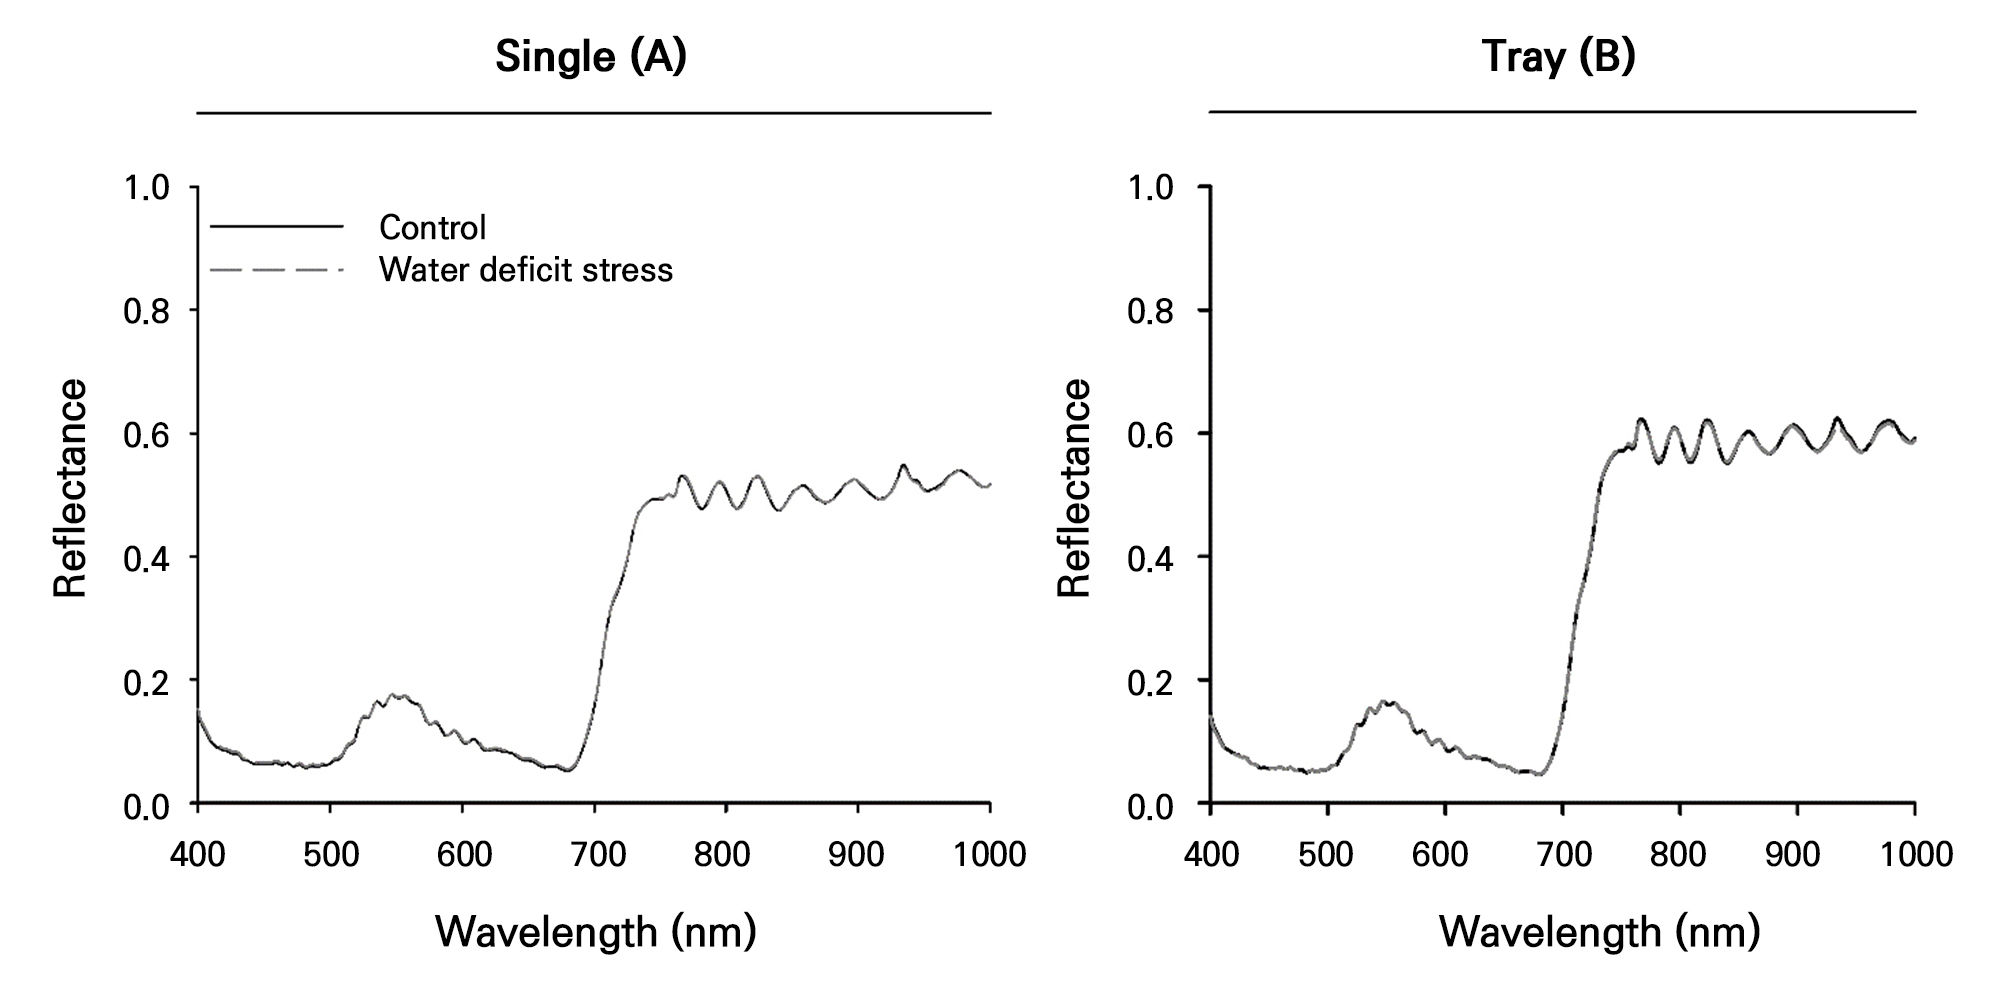
Reflectance values in the 400–1,000 nm wavelength range were determined using a hyperspectral camera and graphed for the control and water-deficit-stress treatment groups, distinguishing between single plants and plug-tray units (Fig. 8). The plug-tray units, which have a broader vegetation range, showed higher spectral reflectance than the single-plant units. However, there were no differences in the reflectance values between the control and water-deficit-stress treatments. This contrasts with previous studies that focused on the early detection of water-deficit stress in tomato and pepper plants (Kim et al. 2022) and on estimating water contents in cucumber and watermelon seedlings (Kim et al. 2018). The difference in results was likely due to the short interval between the last watering session and hyperspectral imaging, which likely resulted in a lower degree of water-deficit stress that did not induce significant changes in physiological stress.
Conclusions
This study aimed to develop a method for effectively detecting nitrogen and water-deficit-stress levels in tomato seedlings using multispectral and hyperspectral imaging techniques. Tomato seedlings were subjected to five levels of nitrogen exclusion and two levels of water-deficit stress, and their growth, chlorophyll, proline, and total nitrogen contents were analyzed. By utilizing multispectral and hyperspectral imaging data for each stress type and treatment level, the final objective was to identify indices or wavelengths that can practically predict stress levels in the plug-tray unit, which is required for seedling nurseries. Treatment 3, which involved restricting nitrogen for 26 days, showed a total nitrogen content of 0.89%. Stress levels below this threshold were detected using multispectral and hyperspectral imaging techniques. Vegetation indices derived from multispectral imaging (NDVI, GNDVI, and CIgreen) indicated that nitrogen stress could be detected in treatment 2, during which nitrogen was excluded for 16 days, corresponding to a total nitrogen content of ≤ 1.30%. However, water-deficit stress was not distinguishable using multispectral or hyperspectral data. Therefore, while the stress levels of certain nutrients, such as nitrogen, can be practically assessed on the plug-tray unit scale by means of a multispectral or hyperspectral analysis, water-deficit-stress levels are challenging to detect using near-infrared wavelengths below 1,000 nm. This study demonstrates that multispectral or hyperspectral imaging can be effectively used to determine nitrogen-stress levels on the plug-tray unit scale rather than merely on the single-plant unit scale, rendering this approach practical for agricultural applications. The findings here suggest that both externally visible quantitative growth changes and internal nutrient stress levels can be rapidly analyzed on the plug-tray unit scale.
