

Introduction
Materials and Methods
Strawberry plant cultivation and environment management
Experimental design and treatments
Irrigation management and WETc measurement
Plant growth and fruit weights measurement
Statistical analysis
Results and Discussion
Irrigated and drained water volumes
Plants growth and strawberry yield
Diurnal environment changes and the WETc value of strawberry
Introduction
Strawberries are one of Korea’s most valuable crops, producing 176.6 thousand tons valued at KRW 14,757 billion (MAFRA, 2022), with an export value of US$ 64.7 million in 2021 (KaTi, 2023). Hydroponic cultivation in Korea covers 5,341 hectares, with strawberry hydroponics constituting 3,009 hectares, or 56.3% of the total hydroponic area (MAFRA, 2022).
Rooting media are classified into two categories: inorganic substrates, including perlite and rockwool, and organic substrates such as coconut coir and peat moss. Coconut coir is the predominant substrate, encompassing 50.0% (2819 ha) of all substrates used, followed by perlite at 12.6% (710 ha) and rockwool at 3.6% (205 ha) (MAFRA, 2022). Different substrates possess unique chemical and physical properties, meaning that vegetable producers must select the most appropriate substrate depending on the specific crop. For strawberry cultivation, the prevalent practice involves using mixed substrates of peat and perlite in plastic pots to optimize the liquid and gas phases. Strawberries require both sufficient water retention and drainage due to their shallow roots. The coir substrate offers advantages in managing the water content and gas phases, particularly when using a coir slab blended with coconut chips and dust at a specified ratio (Hwang et al., 2022). Therefore, hydroponics with coir substrates is the subject of much research. There is also much research being done on coir substrate hydroponics in strawberries (Kim, 2015; Choi et al., 2016; Lee et al., 2017).
Controlling irrigation in hydroponics is crucial for producing superior quality levels and yields. Irrigation strategies vary based on the substrate type, crop, plant growth stage, and environmental conditions (Na, 2005). On strawberry farms, timer irrigation, which divides the daily water supply into four to six intervals irrespective of the soil water conditions, is widely implemented. To counter potential water shortages, the drainage rate is maintained at 30–50%, resulting in approximately 560 tons of daily drained water on a strawberry farm with 7.5 plants per m2, each receiving 250 mL of water (Choi et al., 2024).
Integrated solar radiation (ISR)-automated irrigation, prevalent in commercial fruit-vegetable farms, relies on the correlation between crop transpiration rates and solar radiation levels, applying water when a specific accumulated amount of solar radiation is achieved (Na et al., 2008). One of the benefits of this system is that it prevents over-irrigation during periods of reduced transpiration.
The growing interest in precision irrigation control is fueled globally by considerations of climate change and initiatives towards achieving net zero carbon emissions. The concept of precision irrigation in hydroponics aims to apply water precisely as needed by the plant, thereby reducing the volume of drainage water, which is typically high in nitrogen and phosphorus. Precision irrigation scheduling approaches consider measurements of the soil water (soil water potential via tensiometers and soil water content via frequency domain reflectometry (FDR) sensors) or plant stress indicators (e.g., visible wilting and stomatal conductance measured by sap-flow sensors) (Jones, 2004). In practice, a plant responds to the water status within its tissues rather than the soil water potential or content. The plant’s physiological response is intricately linked to the evaporative demand, making the application of an evapotranspiration-based approach using crop evapotranspiration (ETc) models viable. ETc encompasses both transpiration and evaporation, accurately reflecting a plant’s water requirements. A plant transports substantial volumes of water from the soil (or substrates) to the roots, from the roots to the xylems, and from the xylems to the stomata on leaves, before releasing it into the atmosphere through transpiration (Khanal et al., 2017).
A fundamental principle of ETc-based irrigation control within a precision irrigation strategy involves replenishing moderate amounts of water in the root zones to match the ETc losses, thereby meeting the plant’s water consumption demands. Consequently, it is essential to establish a relationship between the irrigation amount and the actual ETc for each crop, as this relationship significantly affects crop growth, quality outcomes, and yields while also facilitating precise or intelligent irrigation strategies (Ren et al., 2021).
A load cell offers a straightforward method for estimating weighted ETc (WETc). Load cells, primarily used to monitor plants’ environmental responses, employ weight sensors to gauge the plant’s weight, allowing for the continuous monitoring of fresh weights, transpiration amounts, and uptake levels due to temporal changes (Oishi et al., 2018). This method proves beneficial when using slab-type hydroponic substrates. A slab is positioned on a load cell, which continuously detects changes in the slab’s weight due to variations in its water content in real time, thus enabling the WETc calculation. Therefore, this study aimed to estimate the WETc of strawberries grown on a coir substrate utilizing a load cell and subsequently to determine an optimal monthly irrigation water volume for more precise irrigation control and a reduced drainage water volume.
Materials and Methods
Strawberry plant cultivation and environment management
This experiment was conducted in a Venlo-type smart greenhouse (W8 × L16 × H6.5 m) at Kangwon National University in Chuncheon-si, Gangwon-do, Korea. June-bearing strawberry plug seedlings with three to five leaves (Fragaria x ananassa Duch., var. ‘Sulhyang’) were transplanted on September 15, 2022. Twelve plants per slab were transplanted on slabs on hanging beds at a height of 75 cm, and eleven slabs per treatment were used.
The nutrient solution recipe for strawberry in coir substrate hydroponics, developed by the University of Seoul, was utilized at an electrical conductivity (EC) of 0.8–1.5 dS·m-1 and a pH ranging from 5.5 to 6.0, adjusted as the plant growth stages changed. Irrigation was controlled automatically using a timer and the ISR function in a Ridder HortiMaX system (CX500, Ridder, Maasdijk, The Netherlands). The irrigation schedule commenced one hour after sunrise and concluded three hours before sunset. Timer-controlled irrigation occurred hourly from an hour after sunrise until 11 a.m., while ISR-controlled irrigation, ranging from 110–180 J, changed with the season, occurred from 11 a.m. to three hours before sunset. The greenhouse environment was automatically regulated by the same system managing irrigation, with screens and windows operating to maintain the maximum daytime temperature at approximately 23°C, with a heating system activated when temperatures dropped to 8°C.
The environment was monitored from December 1, 2022 to February 28, 2023. The average daily temperature was 13.8°C, with daytime and nighttime temperatures averaging 17.6°C and 11.3°C, respectively (Table 1). The relative humidity (RH) stood at 75.7%, with the average ISR measuring 9.6 MJ·m-2. The nighttime temperature was below average in December, whereas the daytime temperature was higher in February, and the nighttime temperature increased in January. ISR levels were fairly consistent at 8.0–8.6 MJ·m-2 in December and January, peaking at 12.5 MJ·m-2 in February. Additionally, the vapor pressure deficit (VPD) remained in the range of 0.50–0.54 kPa during the daytime in December and January, reaching its highest at 0.70 kPa in February.
Table 1.
Temperature (℃), relative humidity (RH, %), vapor pressure deficit (VPD, kPa), and integrated solar radiation (ISR, MJ·m-2·day-1) by month in the greenhouse during the cultivation periods for the experiment
| Month | Temperature | RH | VPD | ISR | ||||||
| Mean | Day | Night | Mean | Mean | Day | Night | ||||
| Dec. | 12.4 bz | 15.6 c | 10.4 c | 73.5 b | 0.41 | 0.50 b | 0.35 a | 8.0 b | ||
| Jan. | 14.5 a | 18.0 b | 12.1 a | 77.5 a | 0.39 | 0.54 b | 0.30 ab | 8.6 b | ||
| Feb. | 14.7 a | 19.3 a | 11.3 b | 76.1 ab | 0.46 | 0.70 a | 0.27 b | 12.5 a | ||
| Ave. | 13.8 | 17.6 | 11.3 | 75.7 | 0.42 | 0.57 | 0.31 | 9.6 | ||
Experimental design and treatments
Coir substrates were categorized to analyze the different volumes and dust-to-chip ratios. The substrates consisted of three types: 40 L with a dust-to-chip (v/v) ratio of 10:0 (V40D10) (100 × 20 × 20 cm, Duck Yang Coco, Sri Lanka), 30 L also with a dust-to-chip (v/v) ratio of 10:0 (V30D10) (100 × 20 × 15 cm, Duck Yang Coco, Sri Lanka), and 20 L with a dust-to-chip (v/v) ratio of 5:5 (V20D5) (100 × 20 × 10 cm, Dae Young GS, Korea). The substrate volume and the dust ratio were designed considering the practical strawberry bed size (15–17 cm deep) and commercial mixed substrates for strawberry (organic substrates 50–70% and inorganic substrates 30–50%).
The physical properties of the coir substrates, differentiated by volume and dust ratio, were analyzed using Shin and Son’s methodology (2015); these findings are presented in Table 2. Although the volumes varied per treatment, the density levels of all substrates were uniform. As the substrate volume increased, so did the maximum water holding capacity. The porosity was highest in V20D5 at 79.6%, whereas V40D10 and V30D10 exhibited comparable porosity levels of 70.9% and 70.1%, respectively.
Table 2.
Physical properties of the coir substrates used in the experiment for ‘Sulhyang’ strawberries
| Treatment | Volume (L) | Density (L·kg-1) | Water holding capacity (L) | Porosity (%) |
| V40D10 | 35 az | 0.11 | 24.8 a | 70.9 b |
| V30D10 | 28 b | 0.11 | 19.9 b | 70.1 b |
| V20D5 | 20 c | 0.12 | 15.8 c | 79.6 a |
Irrigation management and WETc measurement
The daily average volume of water used for irrigation was calculated and found to be 152.8 mL·plant-1. Both irrigated and drained water volumes were monitored in real time; the drainage rate (Eq. 1) and the retained water volume (RWV) (Eq. 2) were calculated based on these data. To conduct a detailed analysis of irrigation and drainage across various volumes and dust ratios of the coir substrates, we segmented the daytime into three parts: section 1, from one hour after sunrise to 11 a.m.; section 2, from 11 a.m. to 2 p.m.; and section 3, from 2 p.m. to three hours before sunset.
The WETc values of the strawberry plants were determined by monitoring changes in the slab weights with a load cell (RMFarm, Co., Ltd. Ireis, Korea) (Shin et al., 2014). Each treatment involved placing a slab (twelve plants) on the load cell. We recorded the slab’s weight every minute, together with the irrigation and drainage water volumes. The WETc value was calculated by accounting for the net changes in the slab’s weight after adjusting for irrigation and drainage (Eq. 3).
Plant growth and fruit weights measurement
We measured various growth indicators of strawberry plants, in this case the plant height, leaf length and width, petiole length, the number of leaves, and crown diameter monthly from December of 2022 to February of 2023, based on the guidelines provided by the Rural Development Administration (RDA) (2022). Plant height was determined at the tallest leaf, while measurements of the leaf length and width, petioles, and SPAD (Spad-502, Konica Minolta, Japan) were taken at the third leaf. The count of leaves included only fully expanded leaves, and the crown diameter was measured with Vernier calipers (CD-20CPX; Mitutoyo Corp., Kawasaki, Japan). To assess growth differences across treatments, the relative growth rate (RGR) was calculated (Eq. 4).
Fruits were harvested once or twice weekly, and both the total number of fruits and the weight per plant per month were determined.
Statistical analysis
Data for the analysis were collected from December 1, 2021 to February 28, 2022. The significance of the differences in means was determined by an analysis of variance (ANOVA), and mean comparisons were conducted using Duncan’s multiple range test (DMRT) at p < 0.05, utilizing SPSS (SPSS Statistics 26, IBM, Armonk, NY, USA).
Results and Discussion
Irrigated and drained water volumes
Irrigation was primarily supplied in section 1 and section 2 (from an hour after sunrise to 2 p.m.), accounting for a range of 78–95% of the daily total irrigation water. After 2 p.m. (section 3), less than 10% of irrigation water was supplied in December and January, with about 20% in February (Table 3). Daily irrigated water volumes increased slightly each month, from 136.2 mL·plant-1 in December to 143.4 mL·plant-1 in January, and then to 181.9 mL·plant-1 in February. It is established that the daily irrigation water volume per plant for strawberry forcing cultivation ranges from 150 to 200 mL in December, from 100 to 150 mL in January, and from 150 to 250 mL in February (Lee et al., 2014).
The volume of drained water by section was highest in section 2, constituting 70% of the daily total drained water volume in December and January, and 50% in February (Table 3). This trend was due to drainage occurring from the second irrigation supply. Regardless of the month, the drained water volume for V20D5 tended to be the highest, followed by V30D10 in section 1. In section 2, the drained water volume for V40D10 was lower compared to those of V30D10 and V20D5 in January and February. There were no statistically significant differences between the treatments in terms of the drained water volume in section 3. The daily total drained water volume in December was 64.3 mL·plant-1 for V20D5 and approximately 49–50 mL·plant-1 for V30D10 and V20D5 (Table 3). In January, the daily drained water volume for V20D10 and V30D10 remained statistically consistent at 58–64 mL·plant-1, while that for V40D10 was only 40.8 mL·plant-1. February continued the trend of higher drained water volumes: 69–70 mL·plant-1 for V30D10 and V20D5, and 51.1 mL·plant-1 for V40D10.
The drainage rate was in the range of 28–50% throughout the experimental period and was consistently higher for V20D5 at 40–50% (Table 3). In January, the drainage rate was statistically insignificant, despite a nearly 20% difference between V40D10 and V20D5. These findings align with earlier findings (Choi et al., 2019), where the drained water volume of the 3:7 chip-to-dust ratio coir substrate was 59–72% lower when irrigation volumes were higher and 25–33% lower when they were reduced, compared to the 5:5 coir substrate. This difference is likely attributed to the higher water retention capacity of the 3:7 coir substrate with a higher dust ratio, which minimized drainage. Conversely, the retained water volume was consistently higher for V40D10 at 83, 100, and 130 mL·plant-1 in December, January, and February, respectively, as V40D10 possessed the highest water-holding capacity. Although V30D10 displayed a slightly higher retained water volume than V20D5, the difference was not statistically significant.
Table 3.
Average irrigated water volume (mL·plant-1·day-1), average drained water volume (mL·plant-1·day-1) by time zone (section 1, an hour after sunrise - 11:00; section 2, 11:00 - 14:00; and section 3, 14:00 – three hours before sunset), drainage rate, and retained water volume (RWV, mL·plant-1·day-1) of strawberry plants cultivated with different volumes and dust ratios of coir substrates
| Treatment | Irrigation volume (percentage) | Drainage volume (percentage) | Drainage rate (%) | RWV | |||||||
| Section 1 | Section 2 | Section 3 | Day total | Section 1 | Section 2 | Section 3 | Day total | ||||
| December | |||||||||||
| V40D10 | 61.7 (45.3) az | 64.6 (47.4) | 10.0 (7.3) b | 136.2 (100) | 5.6 (11.2) b | 36.4 (73.1) | 7.8 (15.6) | 49.8 (100) b | 36.7 b | 83.7 a | |
| V30D10 | 5.8 (11.4) b | 36.9 (72.4) | 8.3 (16.2) | 50.9 (100) b | 38.4 b | 80.4 ab | |||||
| V20D5 | 12.6 (19.6) a | 42.2 (65.6) | 9.5 (14.8) | 64.3 (100) a | 47.0 a | 72.2 b | |||||
| January | |||||||||||
| V40D10 | 67.1 (46.8) a | 68.5 (47.8) | 7.7 (5.4) b | 143.4 (100) | 1.5 (3.6) c | 32.5 (79.6) b | 6.9 (16.8) | 40.8 (100) b | 31.4 | 100.6 a | |
| V30D10 | 4.3 (7.4) b | 45.5 (78.1) a | 8.4 (14.5) | 58.2 (100) a | 47.0 | 81.3 b | |||||
| V20D5 | 8.2 (12.7) a | 47.5 (73.7) a | 8.7 (13.6) | 64.4 (100) a | 50.0 | 75.0 b | |||||
| February | |||||||||||
| V40D10 | 56.7 (31.2) b | 84.9 (46.7) | 40.3 (22.2) c | 181.9 (100) | 1.4 (2.8) b | 25.7 (50.3) b | 23.9 (46.9) | 51.1 (100) b | 28.3 b | 130.6 a | |
| V30D10 | 3.6 (5.1) ab | 38.1 (54.2) a | 28.7 (40.7) | 70.4 (100) a | 38.8 a | 111.2 b | |||||
| V20D5 | 4.5 (6.5) a | 39.1 (55.9) a | 26.3 (37.7) | 69.9 (100) a | 39.1 a | 110.3 b | |||||
| Total ave. | |||||||||||
| V40D10 | 61.7 (40.4) | 72.2 (47.3) | 18.8 (12.3) | 152.8 (100) | 2.9 b | 31.8 b | 12.5 | 47.1 b | 32.2 b | 104.4 a | |
| V30D10 | 4.6 b | 40.2 a | 14.7 | 59.5 a | 41.1 a | 91.0 b | |||||
| V20D5 | 8.6 a | 43.0 a | 14.5 | 66.1 a | 45.4 a | 86.1 b | |||||
Plants growth and strawberry yield
Daily growth rates in December, January, and February exhibited varying tendencies. According to the shape of the hexagons, growth was predominantly concentrated in the crown during December and January, whereas leaf development, as defined by the leaf length, width, and petiole length of the third leaf, was emphasized in February (Fig. 1). In December, leaf width and the number of leaves were superior to those in the other treatments in V40D10, while crown development was superior in V30D10 (Fig. 1A). In January, crown growth was notable in the V40D10 and V20D5 cases, while it was negligible in V30D10 (Fig. 1B). In February, among the leaf development indicators, the petiole length growth of V40D10 was exceptional compared to the other treatments (Fig. 1C).

Jun et al. (2006a) observed that strawberry growth and water uptake increased in substrates with a higher water-holding capacity, such as cocopeat, because more new roots emerged in the early growth stages. Hwang et al. (2022) reported that the growth of strawberry plants in a coir slab with 70% chips was slightly inferior compared to growth in a slab with 50% chips.
The differences in the number of fruits harvested per plant by month and by treatment were not significant. However, during the early season (December and January), V40D10 and V30D10 yielded a higher number of fruits; subsequently, V20D5 outperformed the others (Fig. 2A). Jun et al. (2006b) also noted stronger growth of strawberry plants in peat substrates during the early growth stages than in perlite substrates. Overall, V30D10 produced slightly more strawberry fruits. Guttormsen (1974) found that the yield and fruit size of tomato plants increased with rising peat heights above a stable water content level. The number of fruits harvested was considerably lower in January because vegetative growth was more pronounced than reproductive growth during this period, creating a gap between the first and second clusters.
The total fruit weight per plant from December to February was notably higher for the V30D10 treatment at 428.4 g, while it was lower for the V40D10 treatment at 315.5 g, despite identical dust ratios for V40D10 and V30D10. In contrast, the total fruit weight for V20D5, containing 50% dust, was comparable to that of V30D10 at 350 g (Fig. 2B). Though the number of fruits did not differ significantly, variations in the weights of individual fruits suggested treatment-related differences. Endo et al. (2006) noted that the ratio of dust to chips in a coir slab could influence the liquid phase within the slab. In his results, the liquid phase decreased as the chip content increased, which caused the strawberry plant’s water uptake and yield to decrease, explaining how the yield from February to March decreased as the gaseous phase of the coir and peat mixed substrates increased due to the limited water uptake, which is opposite to our findings. This implies that 80% porosity of the substrates (as V20D5) was not detrimental to the strawberry yield and that a suitable irrigation strategy is required for different substrates.
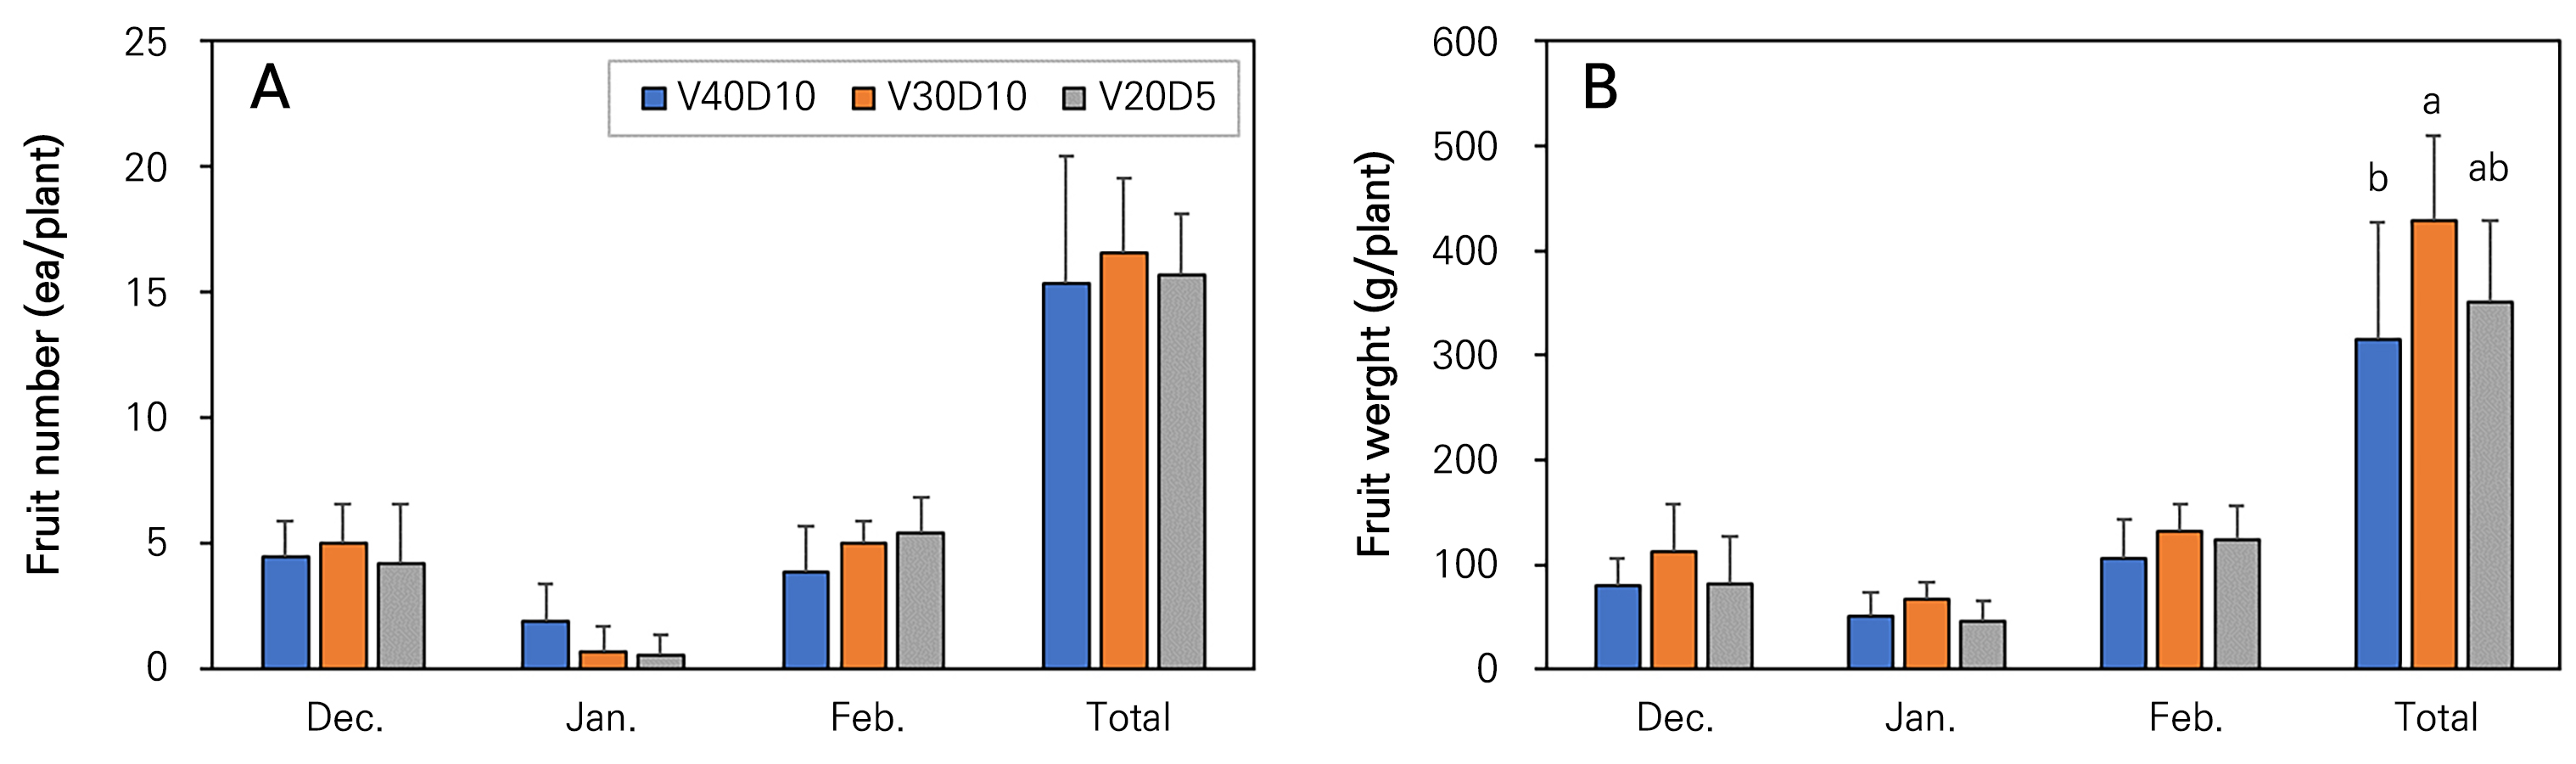
Fig. 2.
Number of fruit harvested (A) and fruit weights (B) of strawberries in a coir hydroponic system with different volumes and dust ratios of coir substrates. Lines on bars indicate standard deviations. Bars with different letters above them are significantly different according to Duncan’s multiple range test (DMRT) at p < 0.05 (n=9).
In general, the growth and production of plants are more promoted as the available substrate per plant increases (Poorter et al., 2012). In cucumber cultivation, a lower rate of photosynthesis was observed for a plant in a small pot due to the restricted root growth, which limited shoot growth as well (Robbins and Pharr, 1988). However, there were no differences observed in the shoot growth or gas exchange parameters between the treatments (data not shown), identical to the findings of a previous study revealing that the pot volume was not a critical factor with regard to the growth of the aerial parts of ‘Sulhyang’ strawberry plants (Lee et al., 2023). Perhaps the larger substrate volume in V40D10 impacted the amount of production given the higher water content, which caused aquic moisture within the strawberry rhizosphere. A strawberry plant requires sufficient water at the top of the substrate for emerging new roots at the crown and ample air in the root zone to foster improved growth and yields (Udagawa, 1988). Hence, timely irrigating V20D5, which has greater porosity, using a moderate water quantity may enhance yields.
Diurnal environment changes and the WETc value of strawberry
WETc is influenced by environmental factors such as solar radiation, temperatures, and VPD levels (Kuiper, 1961). Measurements of the diurnal environment within the greenhouse show variations between sunny and cloudy days. There were 20, 22, and 23 sunny days compared to 11, 9, and 5 cloudy days in December (total: 31 days), January (total: 31 days), and February (total: 28 days), respectively.
On sunny days, solar radiation reached its peak of 484–641 W·m-2 between 12 and 1 p.m., with the highest levels observed in February (Fig. 3A, 3D, and 3G). Conversely, the maximum solar radiation on cloudy days did not exceed 200 W·m-2 regardless of the month (Fig. 4A, 4B, and 4G). The temperature and VPD profiles on sunny days mirrored those of solar radiation, with temperatures ranging from about 10°C to approximately 24°C, as controlled automatically, and VPD peaking between 0.8 and 1.3 kPa. Both the temperature and VPD typically reached their highest levels in February. On cloudy days, however, the temperature was consistently between 11 and 15°C, with the VPD remaining lower than 0.5 kPa. Zolnier et al. (2004) also found this pattern of diurnal change, despite differing seasonal conditions. The maximum VPD on a cloudy day approached 1.4 kPa around 12:30 p.m., compared to approximately 1.7 kPa at around 3:00 p.m. on a sunny day. The solar radiation at these maximum VPD times was 450 W·m-2 on a cloudy day and 600 W·m-2 on a sunny day in June.
The irrigation frequency was aligned with the solar radiation levels throughout the day. During sunny days, irrigation occurred five times in both December and January, reflecting similar solar radiation levels, increasing to ten times in February (Fig. 3B, 3E, and 3H). On cloudy days, irrigation was limited to two to three times during the same period (Fig. 4B, 4E, and 4H). Consequently, the drainage rates varied. On sunny days, the drainage rates for V40D10, V30D10, and V20D5 were 47.4%, 42.2%, and 50.6% in December; 29.3%, 37.3%, and 45.3% in January; and 20.2%, 32.0%, and 30.0% in February, respectively. During cloudy days, these rates for V40D10, V30D10, and V20D5 were 18.5%, 24.5%, and 32.9% in December; 0%, 0%, 27.8% in January; and 11.5%, 20.1%, and 22.4% in February, respectively (data not shown).
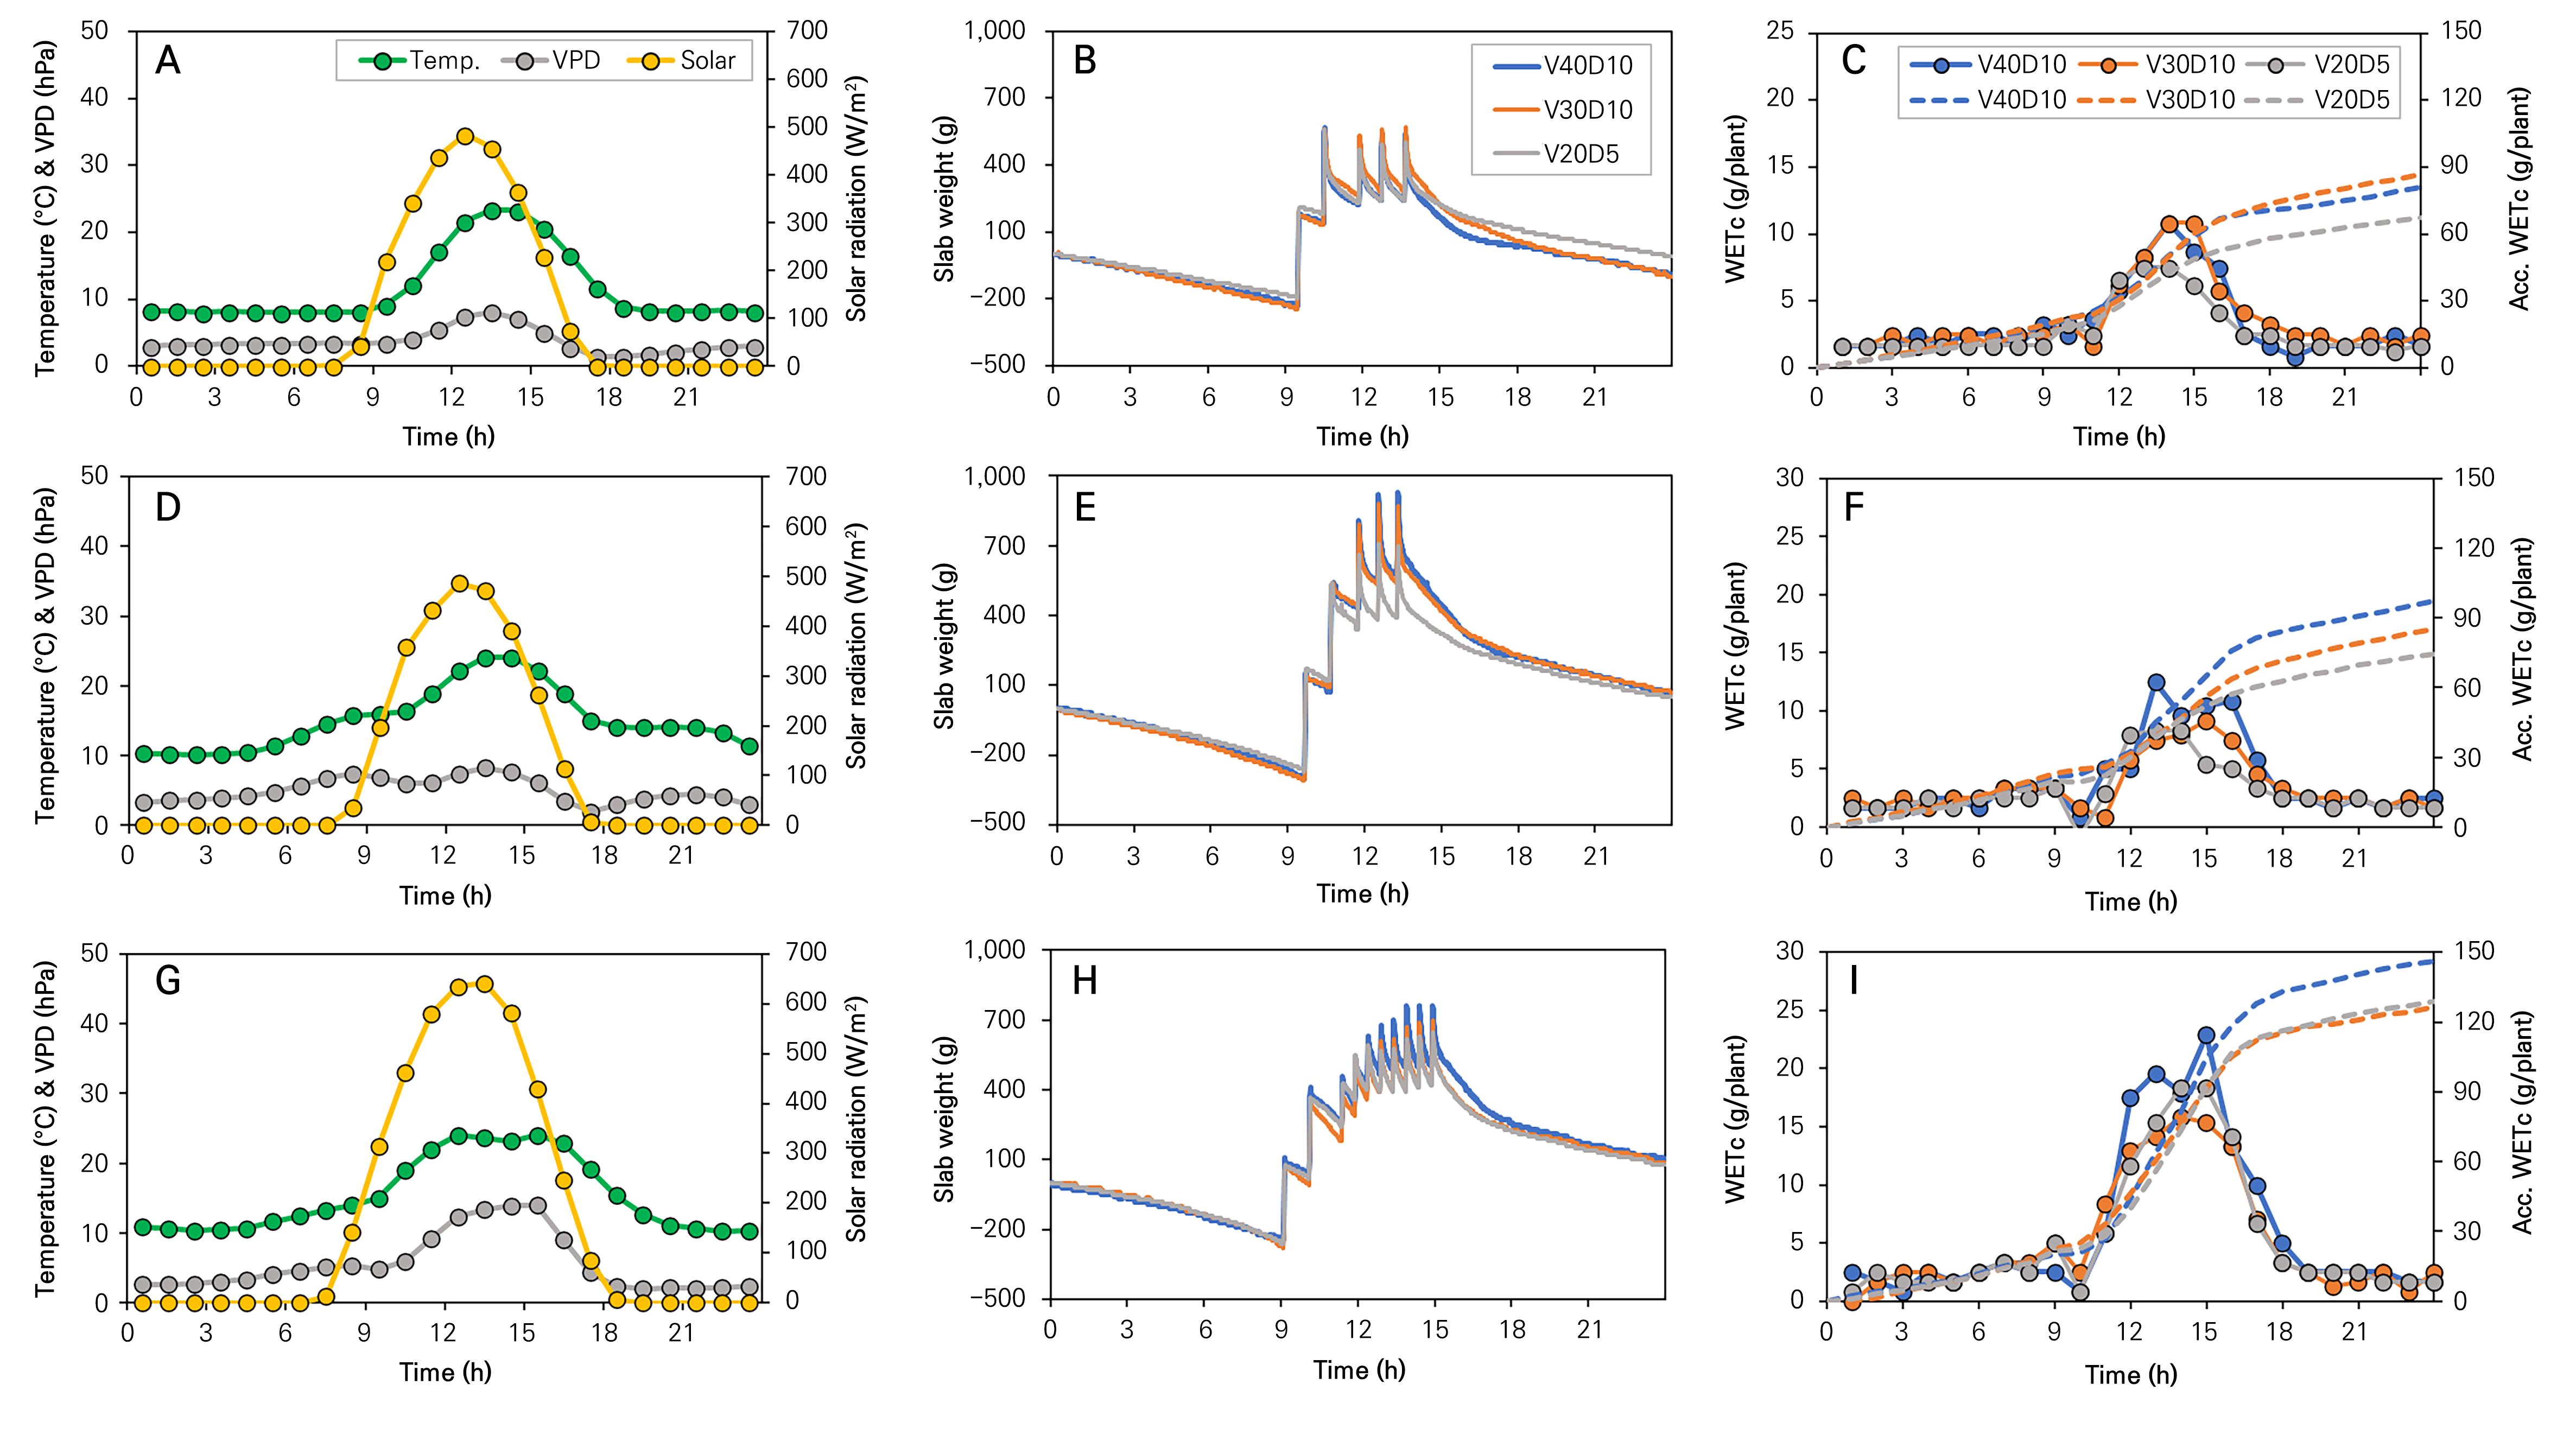
Fig. 3.
On a sunny day, hourly changes in the temperature, vapor pressure deficit (VPD), and solar radiation of the greenhouse (A, D, G), changes in the slab weights with twelve plants (B, E, H), and the weighted evapotranspiration (WETc) and accumulated WETc (Acc. WETc) values of strawberries (C, F, I) in a coir hydroponic system with different volumes and dust ratios of coir substrates were measured in December (A‒C), January (D‒F), and February (G‒I) (n=60).
Consequently, due to variations in environmental conditions and the number of irrigation events, the accumulated WETc was highest in February, followed by January and December. In December from 2 to 4 p.m., V40D10 and V30D10 recorded higher hourly WETc values than V20D5, resulting in a greater accumulated WETc of 87.1 g·plant-1 and 80.8 g·plant-1 for V30D10 and V40D10, respectively, compared to 67.5 g·plant-1 for V20D5 (Fig. 3C). In January, V40D10 saw its first peak in hourly WETc at noon and a second peak at 3 p.m. V30D10 peaked at 3 p.m., whereas V20D5 reached its peak at 2 p.m. Between 3 and 4 p.m., a noticeable gap in WETc was evident between the treatments (Fig. 3F). As the strawberry plants matured, the accumulated WETc of V40D10 surpassed that of both V30D10 and V20D5; the values were 97.5 g·plant-1, 85.0 g·plant-1, and 74.6 g·plant-1 respectively, in January (Fig. 3F), and WETc increased further for V40D10 to 146.3 g·plant-1, with V30D10 and V20D5 maintaining a similar range of 128.8 to 127.1 g·plant-1 in February (Fig. 3I). Conversely, the hourly WETc on cloudy days did not exceed 5 g·plant-1, and the accumulated WETc was only between 41 and 75 g·plant-1 (Fig. 4C, 4F, and 4I). Kuiper (1961) observed that the transpiration rate increased linearly with solar radiation at each air temperature level, and at constant temperatures, transpiration increased with an increase in solar radiation; with the same level of solar radiation, higher temperatures resulted in increased transpiration rates.
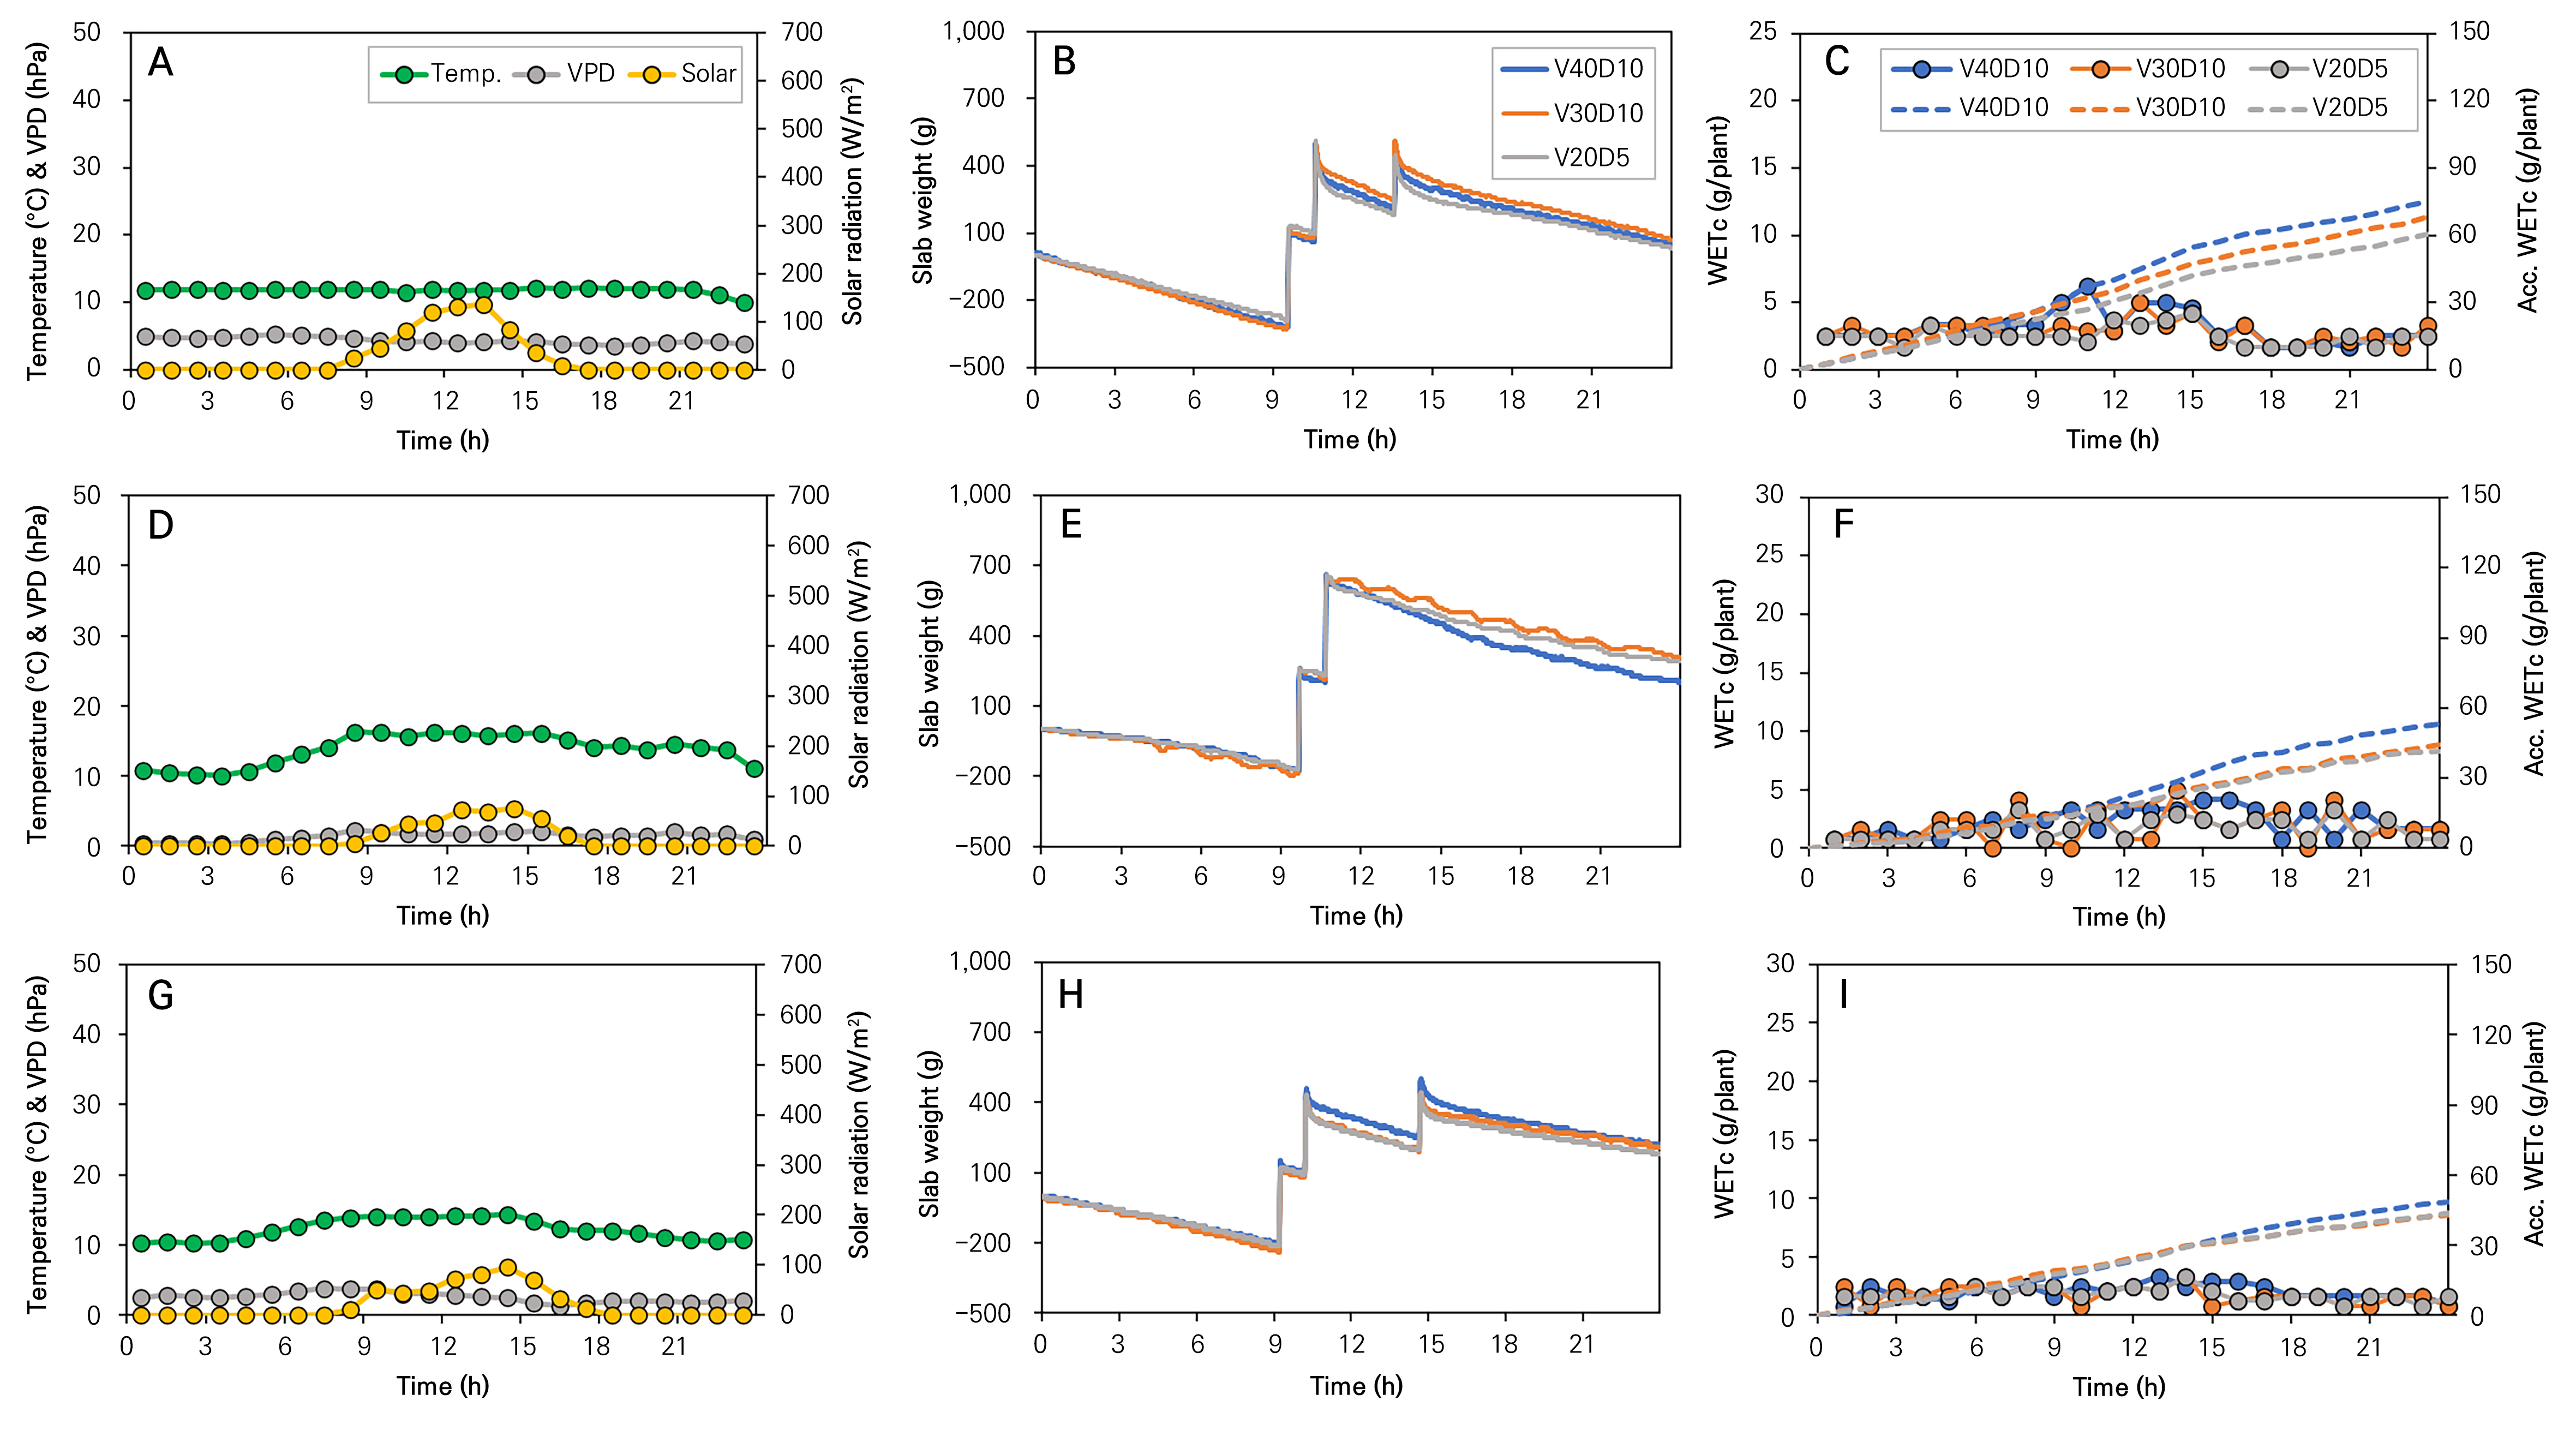
Fig. 4.
On a cloudy day, hourly changes in the temperature, vapor pressure deficit (VPD), and solar radiation of the greenhouse (A, D, G) were observed. Changes in the slab weights with twelve plants (B, E, H) were also recorded. Additionally, the weighted evapotranspiration (WETc) and accumulated WETc (Acc. WETc) values of strawberries (C, F, I) were measured in a coir hydroponic system with different volumes and dust ratios of coir substrates on sunny days in December (A‒C), January (D‒F), and February (G‒I) (n=60).
When aggregating data for the entire month without differentiating between sunny and cloudy days, the trends for solar radiation, ISR, hourly WETc, and accumulated WETc closely mirrored those observed on sunny days. The maximum solar radiation and ISR in December and January were 412–415 W·m-2 and 8 MJ·m-2, respectively (Fig. 5A and 5C). The maximum hourly WETc was approximately 8 g·plant-1 for all treatments in December and January, except for V40D10, which reached 10.3 g·plnat-1 in January (Fig. 5B). The accumulated WETc was approximately 80±5 g·plnat-1 for all treatments during these months, and it increased to 100.5 g·plant-1 for V40D10 in January (Fig. 5D). Despite similar average solar radiation levels per hour between December and January, the slight difference in WETc for V40D10 in January likely stems from the significantly higher temperatures observed during this month (Table 2). As previously noted, at constant solar radiation levels, transpiration escalates with rising temperatures, providing an advantage to V40D10 in terms of a higher WETc due to the retained water volume.
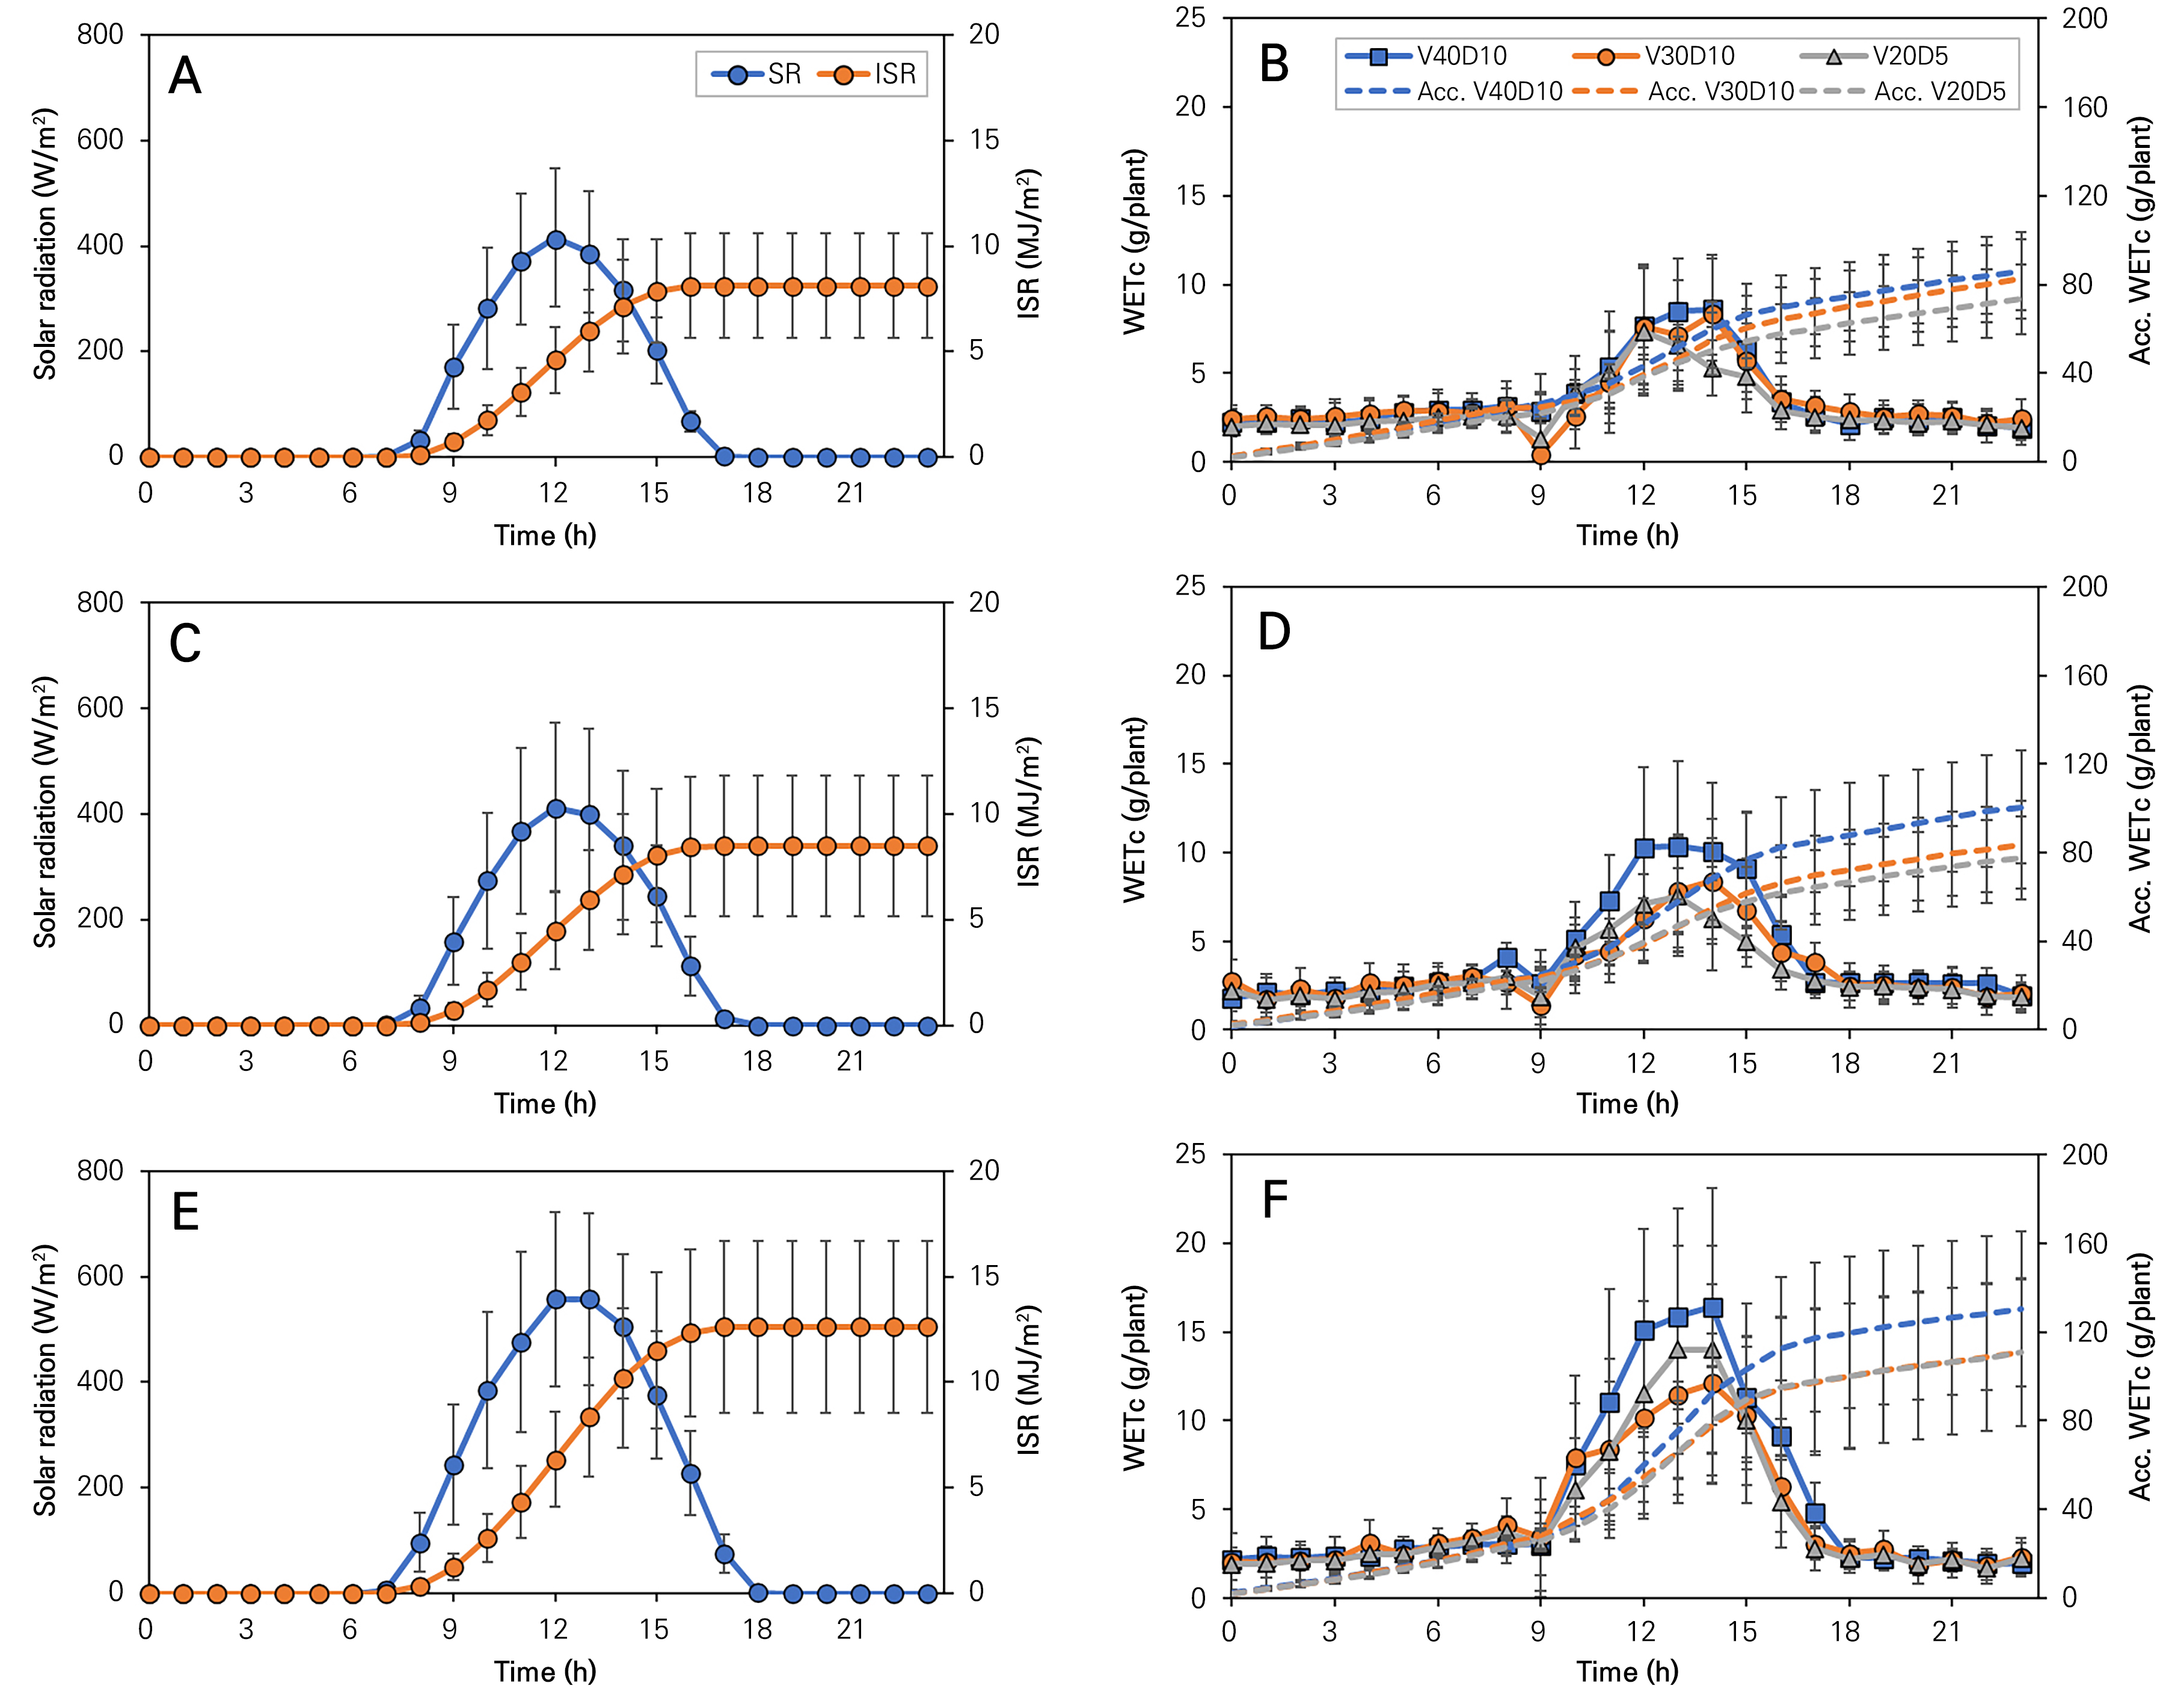
Fig. 5.
Hourly changes in solar radiation and integrated solar radiation (ISR) (A, C, E). Weighted evapotranspiration (WETc) and accumulated WETc (Acc. WETc) values of strawberries (B, D, F) were measured in a coir hydrponic system with different volumes and dust ratios of coir substrates in December (A, B), January (C, D), and February (E, F). The lines indicate standard deviations, with n=31 for December and January, and n=28 for February.
In February, the hourly and accumulated WETc increased notably alongside the higher levels of solar radiation and ISR outcomes compared to the previous months. The maximum solar radiation reached 557 W·m-2 and the ISR attained a values of 13 MJ·m-2 (Fig. 5E). From 11 a.m. to 2 p.m., during periods of rapidly increasing solar radiation, the WETc of V40D10 was 2–4 g·plant-1 higher than those of the other treatments, culminating in an accumulated WETc of 130.3 g·plant-1, while the other treatments were around 110 g·plant-1 (Fig. 5F).
In conclusion, a load cell was used successfully to estimate the WETc values of strawberry plants in a coir hydroponic system. It was determined that the WETc of strawberry plants in a hydroponic system varied due to the volume and dust ratio of the coir substrates, as well as the daily weather and environmental conditions within the greenhouse. Consequently, strawberry hydroponics farms may consider minimizing the drained water volume if irrigation is strategically managed using WETc. According to the findings of this study, moderate, daily irrigation amounts per plant of 90 (80–100) mL·plant-1 for December, 100 (90–110) mL·plant-1 for January, and 150 (140–160) mL·plant-1 for February could optimize the coir substrate volumes and ratios.
According to Ren et al. (2021), the WETc value of melon plants fluctuates during blooming or fruiting stages rather than during the fruit expansion stage. Likewise, the WETc value of strawberry plants varies by growth stage. Thus, it would be valuable for future research to determine one supply irrigation amounts should be applied.
