

Introduction
Materials and Methods
Plant Materials and Environmental Conditions
Pot Volume and Substrate Types
Data Collection
Results
Strawberry Plant Growth and Flowering Characteristics
Drainage Solution Characteristics by Growing Period
Ion Absorption Characteristics of the Substrates by Growing Period
Discussion
Pot Volume and Substrate Type Suitable for Pot Cultivation according to the Plant Growth and Related Characteristics
pH, Electrical Conductivity (EC), and Ion Concentrations of Drainage Solutions for Hydroponic Pot Cultivation
Conclusion
Introduction
Strawberry fruit cultivation has transitioned from conventional field cultivation methods to advanced production systems with precisely controlled growing environments, such as hydroponics, which offer a potential solution to the issues of seasonality and land availability limitations (Hernández-Martínez et al., 2023). Furthermore, plant factories, facilities that can grow crops year-round regardless of seasonal changes, have been utilized in recent research (Yoshida et al., 2016; Iwao et al., 2021; Le et al., 2021) to enable control over diverse environments, thereby enhancing crop yields and quality levels.
The utilization of individual pots in elevated-bench hydroponic cultivation of strawberries is increasing due to the various advantages. Pot cultivation allows for flexibility in land utilization by maximizing the use of the area (Fussy and Papenbrock, 2022), avoiding soil issues such as soil-borne diseases and pests, and increasing the efficiency of the nutrient supply to enable the precise delivery of nutrients to the plants (Williams and Nelson, 2016). Pot cultivation offers benefits to growers, including the advantage of being able to manage plants independently. Moreover, it is recognized as an advanced agricultural system emphasizing resource efficiency and sustainability (Fussy and Papenbrock, 2022).
Pot cultivation involves structurally limiting rooting substrates to provide environmental conditions for root development and plant production and ultimately applied with pots and substrates (Leutscher, 1995). During pot cultivation, the average soil moisture content varies according to the structure of the pot with saturated soil at the bottom and a low soil moisture content at the top of the pot (Turner, 2019; Passioura, 2006). Management of the appropriate root volume, irrigation volume, and drainage rate is crucial in strawberry pot cultivation based on the physical and chemical properties of the substrates and the plant growth characteristics (Pignata et al., 2017). The physical and chemical properties of substrates, such as the particle size, pot volume, and nutrient composition (Gabriëls et al., 1986), can significantly affect plant growth and yield outcomes. Inorganic substrates (e.g., vermiculite and perlite) and organic substrates (e.g., peat moss and coir) are commonly used for the hydroponic cultivation of various crops, including fruits and vegetables, and their selection is crucial in hydroponics (Milks et al., 1989; Bussell and McKennie, 2004). Different organic and inorganic substrates can enhance nutrient uptake, the water and oxygen holding capacities, and the overall performance of plants (Verdonck et al., 1983).
Reusing drained nutrient solutions in hydroponic systems has attracted significant attention due to the potential of this strategy to reduce nutrient leaching and enhance resource-use efficiency. Methodological studies aimed at recycling drainage solutions have explored various techniques, including denitrification, microalgae cultivation, constructed wetlands, and activated carbon methods (Richa et al., 2020). Drainage characteristics are essential for understanding plant nutrient uptake and utilization in hydroponic systems, also revealing the extent of nutrient accumulation in the substrate and the potential for nutrient loss via drainage. Several studies have attempted to reuse drained nutrient solutions in strawberry cultivation (Jun et al., 2011a, 2011b).
However, changes in the physical and chemical properties of substrates according to the growing period and the relationship between the pot volume and strawberry growth have yet to be well revealed. This study aimed to determine the optimal substrates and pot volumes by analyzing drainage solution compositions to promote strawberry growth ultimately to develop a hydroponic cultivation system. These findings can contribute to developing sustainable and efficient strawberry cultivation methodologies that maximize resource utilization while ensuring high-quality yields.
Materials and Methods
Plant Materials and Environmental Conditions
Strawberry plants (Fragaria × ananassa Duch. ‘Seolhyang’) were cultivated in a Venlo-type greenhouse at an experimental farm operated by Seoul National University in Suwon (E 127.0°, N 37.3°), Korea, from August 15, 2021, to February 10, 2022. Each substrate was fertigated with Yamazaki strawberry nutrient solution (pH 5.2–5.8, EC 0.76–1.14 dS·m-1) daily at 10:00 am. Tap water (pH 7.2, EC 0.19 dS·m-1) was used for irrigation 35 to 56 days after transplanting (DAT) for flower initiation. The number of leaves of the plant was maintained at five or six during the experimental period.
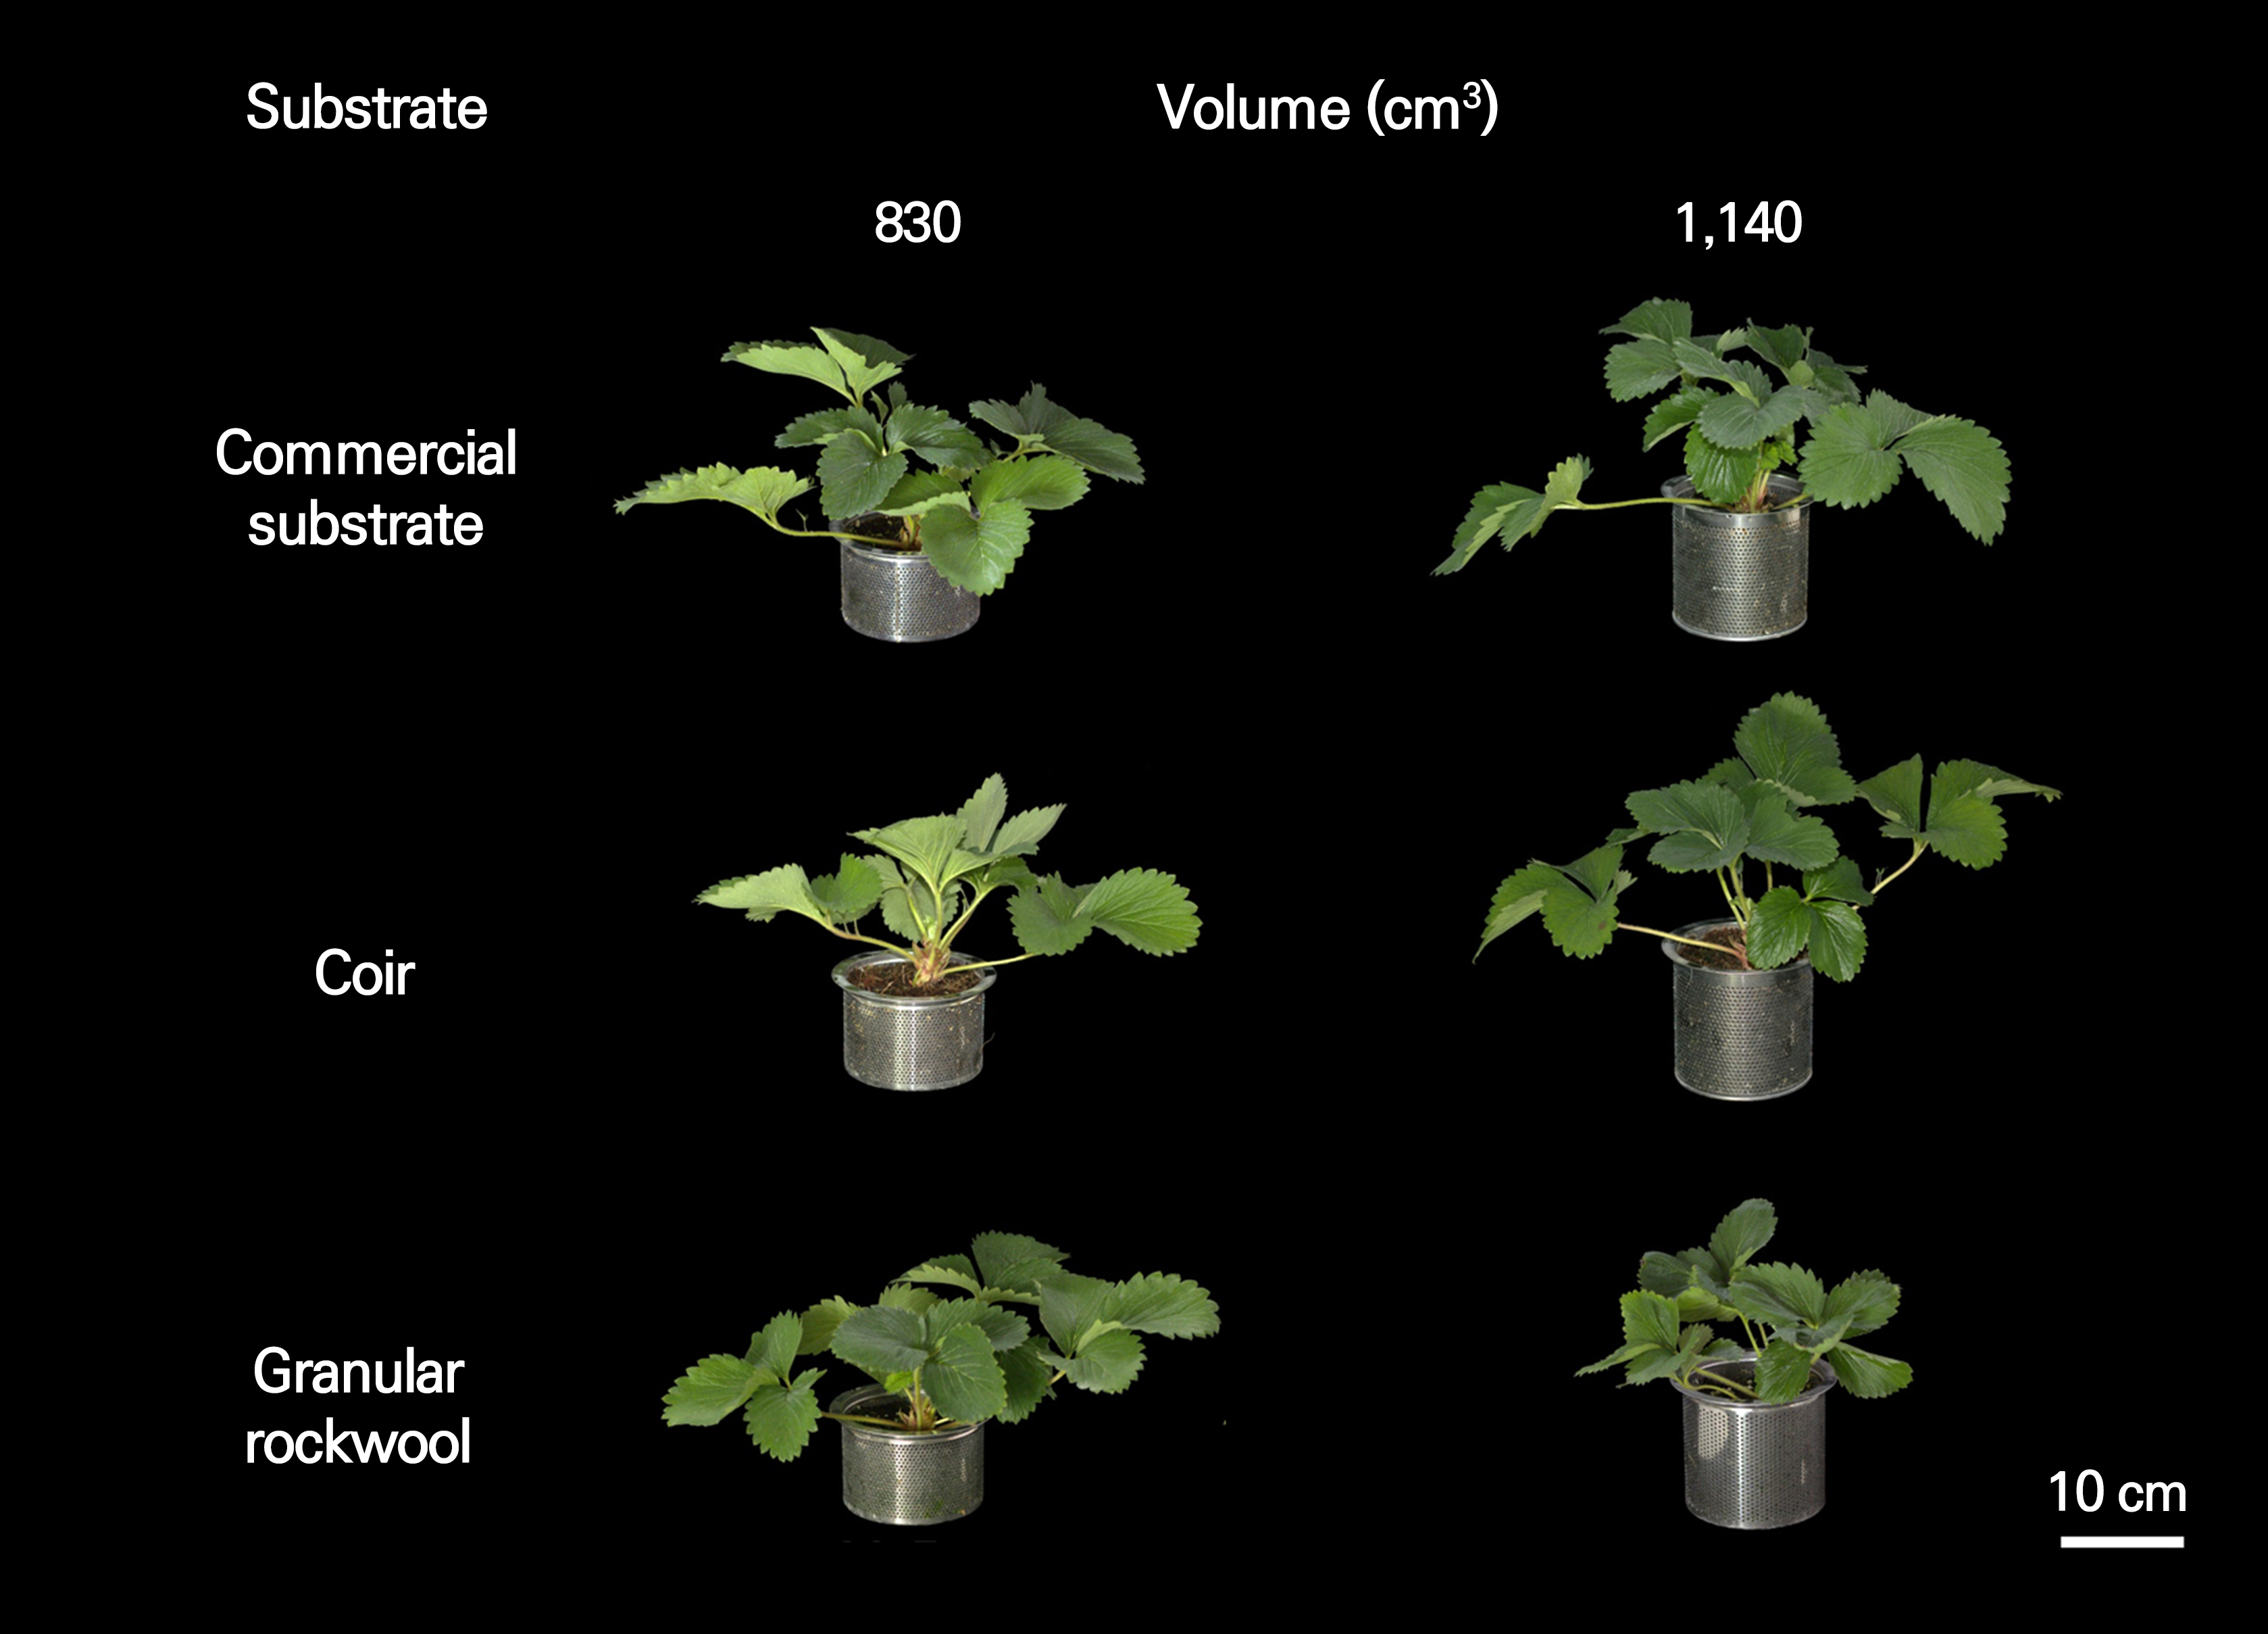
Pot Volume and Substrate Types
Strawberry plants were transplanted into two different volumes of pots with three different types of substrates. The two different pot volumes used here were 830 and 1,140 cm3 (115 × 80 cm and 115 × 110 cm, diameter × height), denoted 830 and 1,140, respectively. The three different types of substrates were commercial substrate (Plant World, Nongwoo Bio Co., Ltd., Suwon, Korea; composition: cocopeat 58.8%, peat moss 17%, perlite 10%, vermiculate 10%, zeolite 4%, pyroligneous acid 0.004%, and wetting agent 0.01%), coir (Power, Daeyoung GS Co., Daegu, Korea; composition: crushed chips 50% and dust 50%), and granular rockwool (Woollite, Korea Agriculture Rockwool Co., Seoul, Korea), denoted Cs, Co, and Gr, respectively. Combinations of different pot volumes and substrate types were used as treatments. The substrates were buffered with Yamazaki’s solution (pH 5.6, EC 1.0 dS·m-1) for one week before transplantation.
Data Collection
Growth measurements and flower anthesis characteristics
Growth with each treatment was measured after treatments for 63 and 182 DAT. The crown diameter, leaf area, and dry weights of the shoots and roots were measured nine weeks after treatment, and the dry weights of the shoots and roots were measured 26 weeks after treatment. The top root ratios (T/R ratio) were calculated with the shoot and root dry weight at nine and 26 weeks after treatment. The first and tenth flower anthesis dates were recorded as the number of DAT.
Drainage solution
The pH, EC, and ion concentrations of drainage solutions were measured at 20-day intervals from August 30 to November 18. The EC and pH were measured using an amperometric EC and total dissolved solids sensor (Combo pH/Conductivity/TDS Tester HI98130, Hanna Instruments, Woonsocket, RI, USA). The concentrations of NO3– and NH4+ were measured using an ion chromatography system (ICS-3000, Dionex, Sunnyvale, CA, USA). The concentrations of total phosphorous, K+, Ca2+, Mg2+, and SO42– were measured using an inductively coupled plasma atomic emission spectrometer (VARIAN 730ES, Varian, Sydney, Australia).
Experimental design and statistical analyses
The experiments utilized a randomized complete block design with 12 plants for each treatment. Plant growth at 63 and 182 DAT was measured with six and five plants, respectively, and nutrient and drainage solutions were analyzed with four samples in each treatment. The data were analyzed using SAS software version 9.4 (SAS Institute Inc., Cary, NC, USA). A two-way ANOVA was conducted for plant growth, the flower anthesis date, and for a nutrient and drainage solution analysis. For parameters with significant ANOVA results, the statistical significance of the differences in each parameter was determined using Duncan’s multiple range tests following a significant one-way analysis of variance, with p < 0.05.
Results
Strawberry Plant Growth and Flowering Characteristics
The growth parameters at 63 DAT after treatment, the crown diameter, leaf area, shoot, and root dry weights were significantly highest in the 830 Cs treatment, followed by the 1,140 Cs treatment and the 830 Co treatment (Table 1). The results of the two-way ANOVA analysis indicate that except for the root dry weight and T/R ratio, the growth parameters were significantly affected by the substrate type and the Cs had higher values at both the 830 and 1,140 cm3 volumes. The root dry weight was greater at the 830 cm3 volume than at the 1,140 cm3 volume and was greatest in Cs, followed by Co and Gr, while the T/R ratio was greatest in Gr, which had the lowest root dry weight.
Table 1.
Crown diameter, maximum petiole length, leaf area, dry weights of shoot and root, and top/root (T/R) ratio 63 days after transplantation (DAT) and dry weights of shoot and root and T/R ratio at 182 DAT
| Volumez | Substratey | 63 DAT | 182 DAT | ||||||||
|
Crown diameter (mm) |
Maximum petiole length (cm) |
Leaf area (cm2) |
Shoot dry weight (g) |
Root dry weight (g) |
T/R ratio |
Shoot dry weight (g) |
Root dry weight (g) |
T/R ratio | |||
| 830 | Cs | 16.9 ax | 14.8 a | 849.5 a | 7.9 a | 4.2 a | 2.0 b | 5.4 a | 8.5 a | 0.7 ab | |
| Co | 15.1 b | 12.3 b | 750.6 ab | 6.9 ab | 3.6 ab | 2.2 b | 5.4 a | 6.9 a | 0.8 a | ||
| Gr | 14.6 b | 11.9 b | 721.6 ab | 6.5 b | 2.5 bc | 2.7 ab | 3.9 c | 7.9 a | 0.5 b | ||
| 1,140 | Cs | 15.6 ab | 14.2 ab | 822.9 ab | 7.3 ab | 3.0 abc | 2.5 ab | 5.6 a | 7.1 a | 0.8 a | |
| Co | 15.2 b | 13.2 ab | 779.6 ab | 6.5 b | 2.8 bc | 2.6 ab | 5.0 ab | 7.8 a | 0.7 ab | ||
| Gr | 14.8 b | 13.2 ab | 692.0 b | 5.9 b | 1.8 c | 3.3 a | 5.1 ab | 8.5 a | 0.6 ab | ||
| Significancew | |||||||||||
| Volume | ns | ns | ns | ns | * | * | ns | ns | ns | ||
| Substrate | ** | * | * | * | ** | ns | * | ns | * | ||
|
Volume × Substrate | ns | ns | ns | ns | ns | ns | ns | ns | ns | ||
Regarding the growth parameters at 182 DAT after treatment, the shoot dry weight was significantly highest in the 830 Cs, 830 Co, and 1,140 Cs treatments, while the 830 Gr treatment had the lowest shoot dry weight. The root dry weight showed no significant differences depending on the treatments, and the tendency of the T/R ratio was similar to that of the shoot dry weight.
The 1st flower anthesis day was significantly delayed in the 830 Co treatment case and was early in the 1,140 Gr treatment case (Table 2). The 1st flower anthesis was significantly earlier with the 1,140 cm3 volume than with the 830 cm3 volume, while the 10th anthesis day showed no significant differences that depended on the treatment.
Table 2.
Days to the flowering of 1st and 10th flowers in relation to pot volumes (830 and 1,140 cm3) and substrates (commercial substrate, coir, and granular rockwool)
| Volumez | Substratey | Days to flowering | |
| 1st flower | 10th flower | ||
| 830 | Cs | 90.0 abx | 103.8 |
| Co | 91.5 a | 102.5 | |
| Gr | 90.2 ab | 103.0 | |
| 1,140 | Cs | 89.0 ab | 101.2 |
| Co | 89.5 ab | 102.5 | |
| Gr | 88.3 b | 100.8 | |
| Significancew | |||
| Volume | * | ns | |
| Substrate | ns | ns | |
| Volume × Substrate | ns | ns | |
Drainage Solution Characteristics by Growing Period
The pH value of the drainage solution was significantly influenced by the pot volume, substrate, and their interaction at 20 and 40 DAT (Fig. 1A and 1B) and was influenced by the pot volume and substrate at 60, 80, and 100 DAT (Fig. 1C-1E). The pH value of the drainage solution of Gr was highest from 20 to 60 DAT and was low in the order of Cs and Co, except at 40 DAT (Fig. 1A-1C). The pattern was similar to that at 20 and 60 DAT, with a volume of 1,140 cm3 at 80 and 100 DAT (Fig. 1A-1E). The pH value of the drainage solution of Cs was highest at 80 DAT with the 830 cm3 volume and was low in the order of Gr followed by Co (Fig. 1D and 1E).
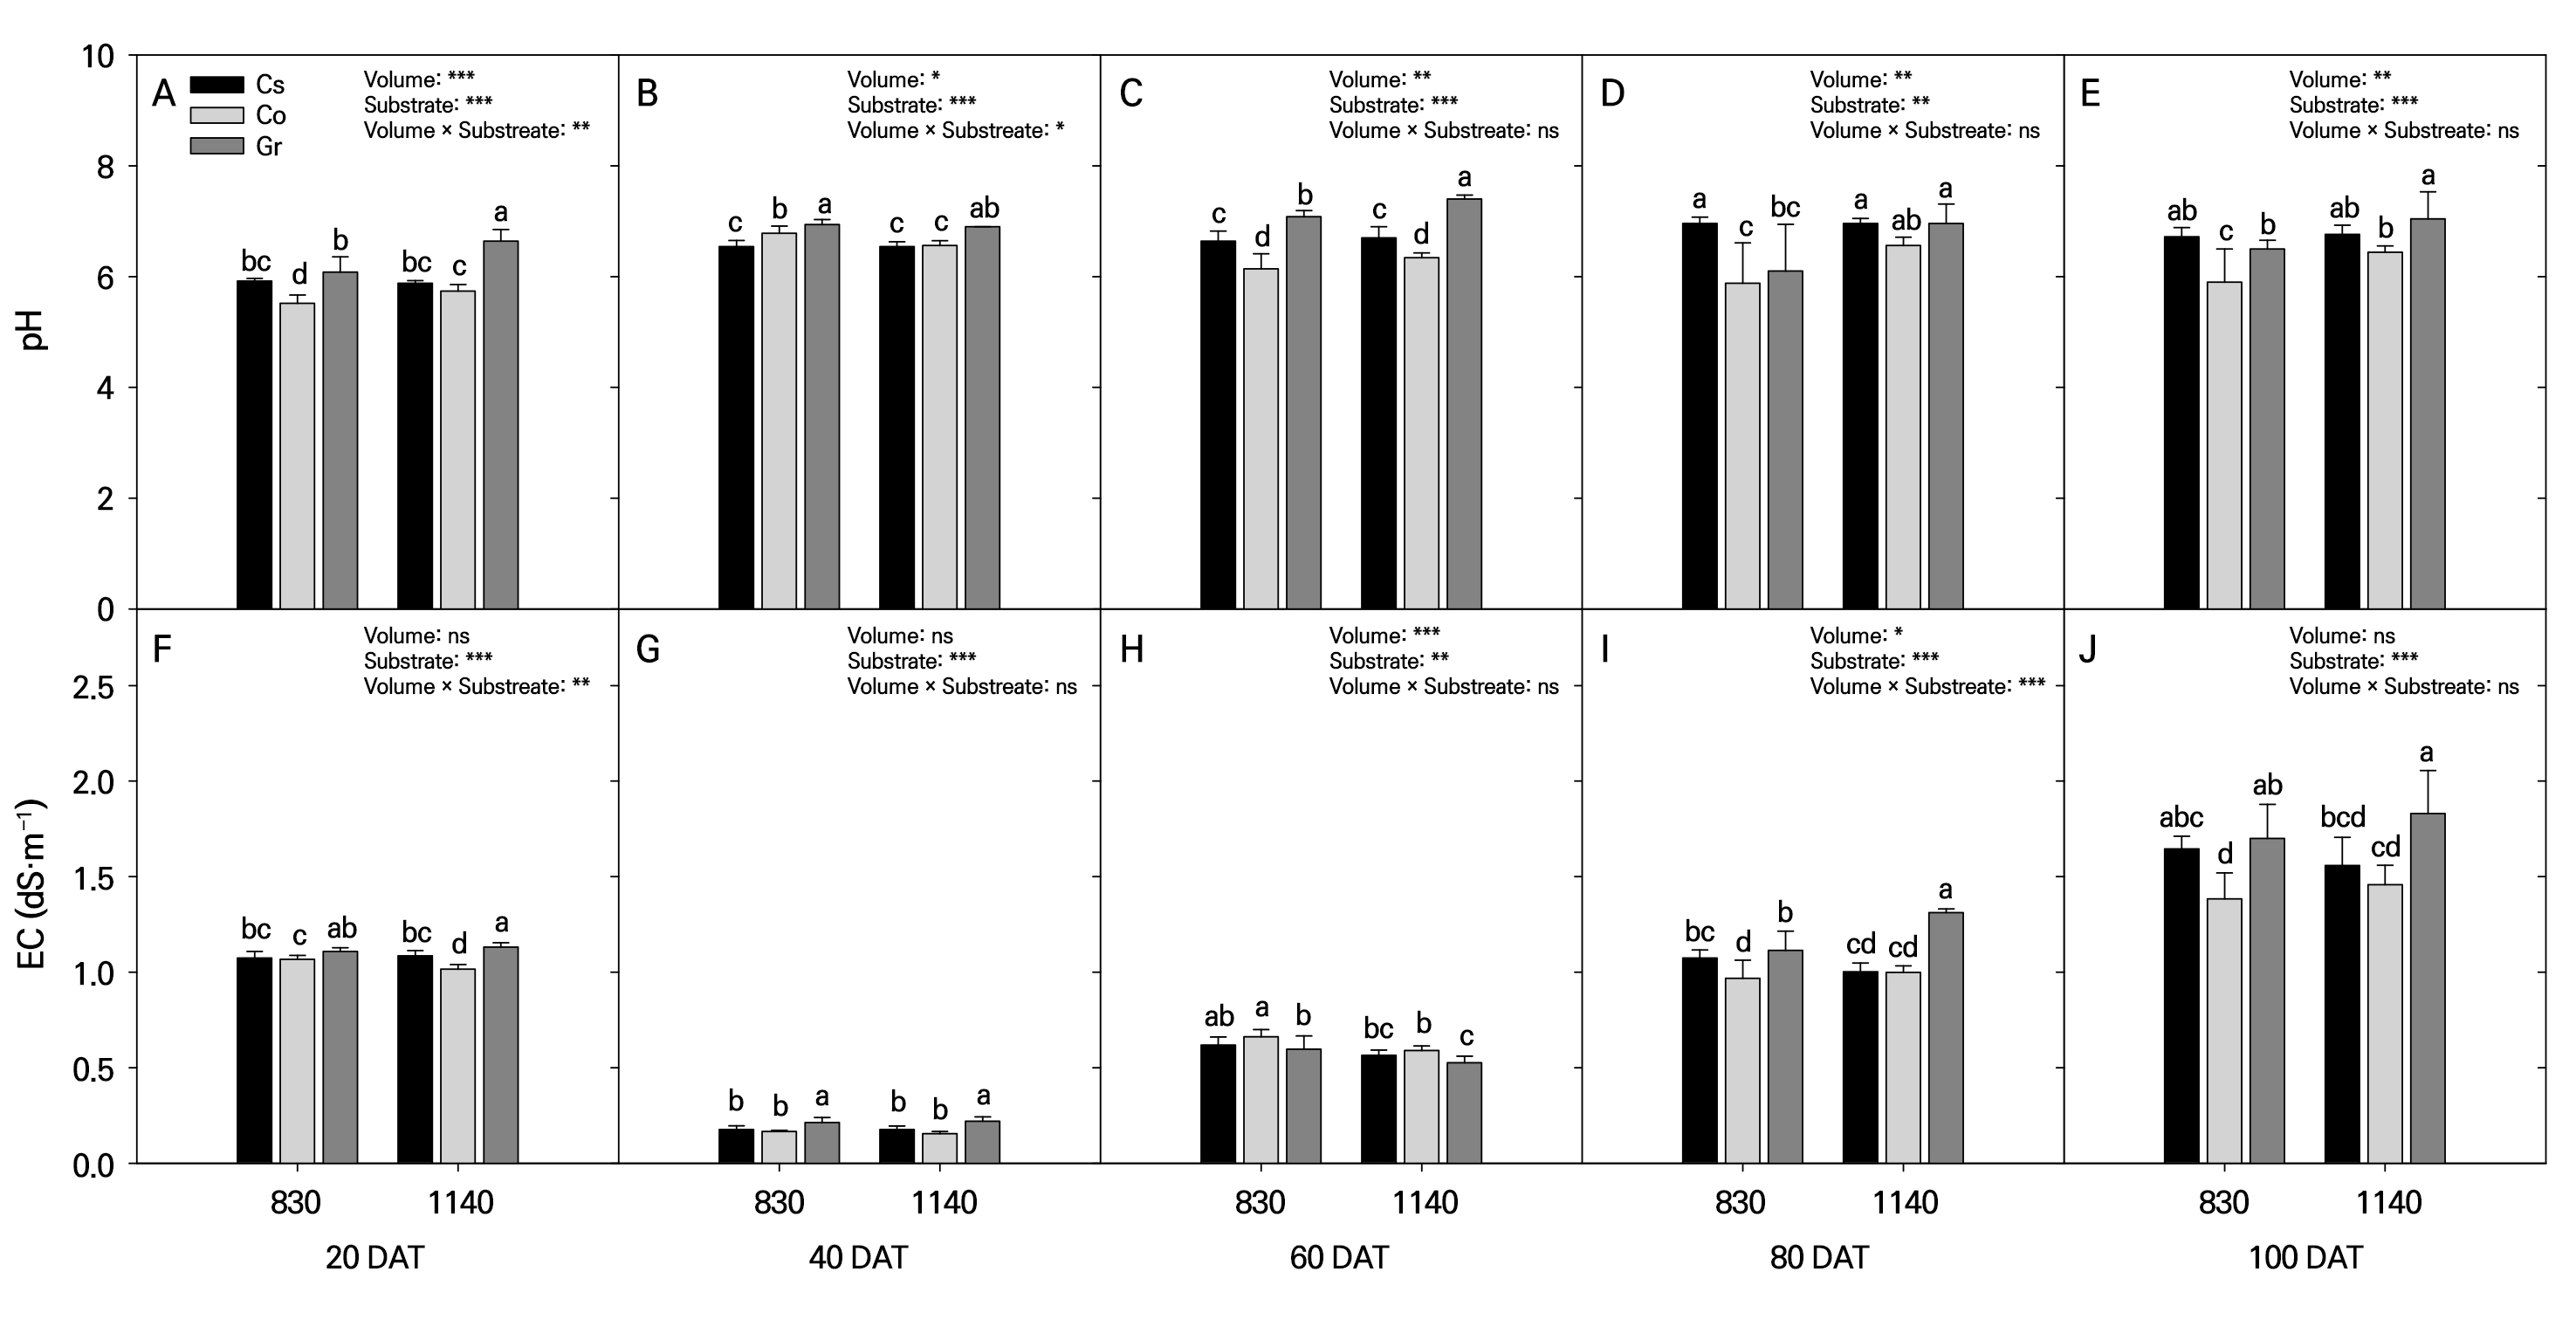
Fig. 1.
The pH (A-E) and EC (F-J) values of drainage solution after drip irrigation of the two different substrate volumes (830 and 1,140 cm3) and three different types of substrates (Cs; commercial substrate, Co; coir, and Gr; granular rockwool) sampled 20, 40, 60, 80, and 100 days after transplantation (DAT).
The substrates significantly influenced the EC value of the drainage solution during the experimental period (Fig. 1F-1J). The EC value of the drainage solution of Gr was highest, followed by Cs and Co, except at 60 DAT. During the entire experimental period, the difference in the EC value between the nutrient solution and the drainage solution was greatest in the drainage solution of Gr, followed by Cs and Co. The EC of the drainage solution at 40 DAT was slightly lower than that of tap water, except for Gr. The EC of the drainage solution at 60 DAT was lower in all treatments than that in the nutrient solution.
Ion Absorption Characteristics of the Substrates by Growing Period
During the strawberry cultivation period, the concentration of NO3– in the nutrient solution was higher than that in the drainage solution, except at 40 and 100 DAT (Fig. 2A). The concentration of NO3– in the drainage solution was lower than that in the nutrient solution in the order of Co, Cs, and Gr at 60 DAT and higher than that in the nutrient solution in the order of Co, Cs, and Gr. The concentration of NH4+ in the nutrient solution was higher than that in the drainage solution during the entire cultivation period (Fig. 2B).
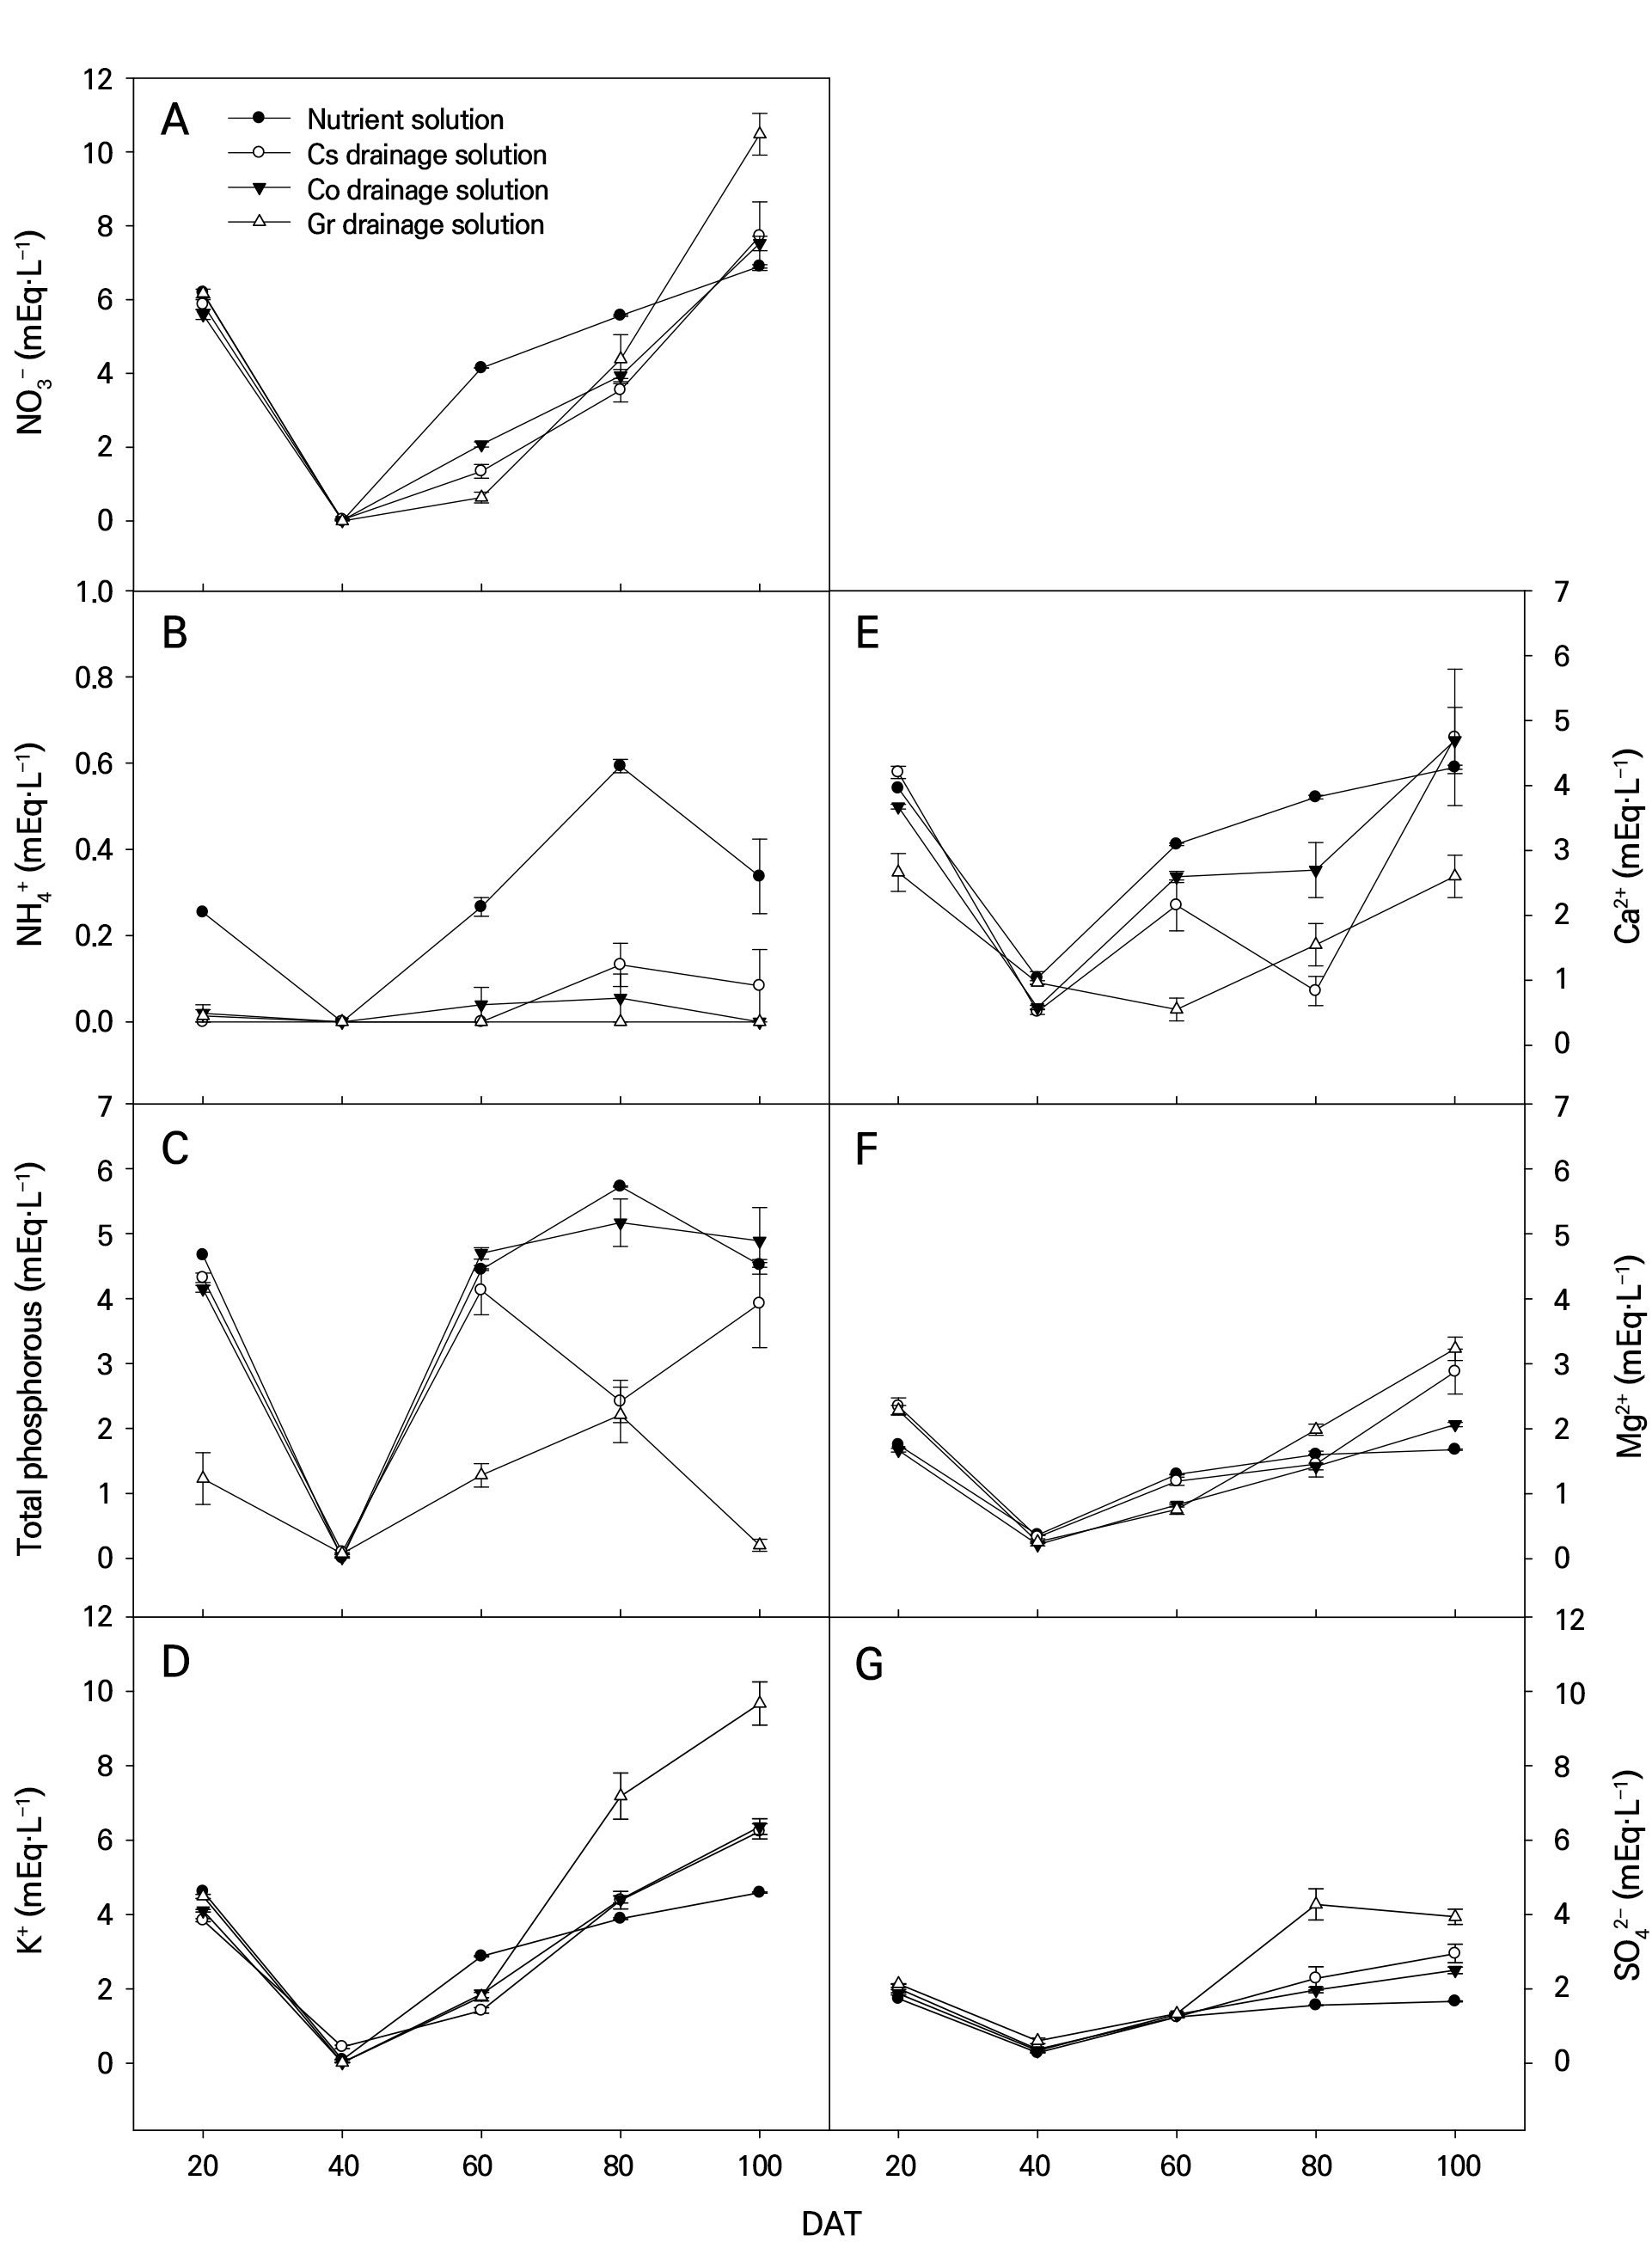
Fig. 2.
Ion concentrations of NO3– (A), NH4+ (B), total phosphorous (C), K+ (D), Ca2+ (E), Mg2+ (F), and SO42–(G) in nutrient solution and drainage solution from the three different types of substrates (Cs; commercial substrate, Co; coir, and Gr; granular rockwool) in a volume of 1,140 cm3 after drip irrigation 20, 40, 60, 80, and 100 days after transplanting (DAT).
The total phosphorous concentration in the nutrient solution was higher than that in the drainage solution at 20 and 80 DAT (Fig. 2C). The total phosphorous concentration difference between the nutrient and drainage solution was lowest in Co and highest in Gr. The concentration of K+ in the nutrient solution was higher than that in the drainage solution at 20 and 60 DAT, whereas it was lower than that in the drainage solution at 80 and 100 DAT (Fig. 2D). The drainage solution in the Cs and Co cases had a K+ concentration pattern similar to that of the cultivation period.
The concentration of Ca2+ was significantly highest in the nutrient solution at 40, 60, and 80 DAT (Fig. 3E). The Cs and Co cases had the highest concentration at 100 DAT. The drainage solution of Gr had the lowest concentration of Ca2+, at a significant level, except at 40 and 80 DAT. The concentration of Mg2+ in the nutrient solution was higher than that in the drainage solution at 40 and 60 DAT, while Gr and Co had significantly higher concentrations at 20 and 100 DAT (Fig. 3F). The concentration of SO42– in the nutrient solution was lowest during the experimental period, and the drainage solution of Gr was highest (Fig. 3G).
Discussion
Pot Volume and Substrate Type Suitable for Pot Cultivation according to the Plant Growth and Related Characteristics
The volume of the pot was not the main factor limiting the growth of the aerial parts. The growth of the aerial parts was affected by the substrate types. These levels were greatest in Cs, followed by Co and Gr at 63 DAT after treatment (Table 1). The dry weight of the root was greater in the 830 cm3 pot volume than in the 1,140 cm3 pot volume, indicating that the pot volume affected root growth at 63 DAT. Similar to this study, among substrate volumes of 75, 150, and 300 cm3, the root dry mass of ‘Sweet Charlie’ strawberry at a volume of 150 cm3 was greatest after four weeks with identically sized substrate particles (Bish et al., 1998). In general, a plant’s growth is enhanced as the volume of the substrate increases; however, 63 DAT was a relatively early cultivation period, and the proportion of roots in the substrate would be relatively lower compared to that in the later cultivation period.
At 63 DAT, the substrate type significantly affected the plant growth parameters, with the root dry weight being higher in Cs and lower in Gr (Table 1). Similar to the present study, for ‘Chandler’ strawberry, plant growth and fruit production were better with a mixture of coco peat, perlite, and vermiculite at a ratio of 50:25:25 than with pure coco peat (Raja et al., 2018). At coir and peat mixing ratios of 3:7, 5:5, 7:3, and 10:0, Endo et al. (2006) reported that as the coir ratio increased, the gas phase increased, the liquid phase decreased, the water absorption of strawberries decreased, and the yield decreased. The Cs used in the experiment was a mixture of coco peat, peat moss, perlite, vermiculite, etc., whereas Co containing 50% of crushed chips resulted in an increased gas phase. Similar to the study, plant growth and fruit production in ‘Chandler’ strawberries were better with a mixture of coco peat, perlite, and vermiculite at a ratio of 50:25:25 than with pure coco peat (Raja et al., 2018). The root dry weight was lowest in the Gr case in this experiment. Wei et al. (2020) mentioned that rockwool cubes and granular rockwool have strong water retention properties, which can cause water stress and inhibit root growth during strawberry propagation.
The 1st flower anthesis date was earliest in the 1,140 Gr treatment case, which had the lowest growth parameters at 63 DAT (Tables 1 and 2). Studies have reported that various conditions can affect the flower anthesis timing of strawberries (Cui et al., 2021; Shin et al., 2023). However, the 10th flower anthesis date was 100 to 103 DAT, resulting in no significant differences according to the pot volumes and substrate types. There were no significant differences in the strawberry plant yield by substrate with coir fiber, perlite, rockwool, and an agrotextile in a closed soilless growing system (Palencia et al., 2016). These results indicate that flower anthesis overall was not affected by the pot volume or substrate type.
Most research has reported that the higher the substrate volume is, the greater the fruit yield (Poorter et al., 2012). A small pot implies a small substrate volume, which reduces the availability of resources to the plants, hindering root development (Poorter et al., 2012). Smaller pots heat more rapidly due to their higher surface area-to-volume ratio. Consequently, temperature fluctuations within smaller pots may inhibit root respiration and growth, leading to increased microbial activity and ultimately hindering plant growth (Keever et al., 1986). The ‘Elsanta’ strawberry produced in 250 cm3 pots showed greater vegetative growth and induced earlier flower differentiation compared to when these strawberries were produced in 150 cm3 pots (Massetani et al., 2014). Likewise, the substrate volume increased from 1,800 to 2,500 cm3, and fruit production increased (Massetani et al., 2017). However, for pot cultivation, it is crucial to set the range of the appropriate substrate volume according to the cultivation period. The shoot dry weight showed no significant differences between the 830 Cs and the 830 Co, and the 1,140 Cs treatment at 182 DAT. The root dry weight also showed no significant differences according to the pot volume and substrate type. These results indicate that up to 182 DAT, the volume of the substrate could be minimized to 830 cm3 when using a commercial substrate and coir.
pH, Electrical Conductivity (EC), and Ion Concentrations of Drainage Solutions for Hydroponic Pot Cultivation
To ensure optimal plant growth and root activity, it is essential to maintain the proper pH of the growing substrate and drainage solution. The pH value of the drainage solution was higher than the pH of the nutrient solution during the experimental period, except at 40 DAT when tap water was supplied (Fig. 1A-1E). If the pH of the drainage solution deviates from the optimal range for a particular nutrient, the availability of that nutrient to the plant roots can be reduced, resulting in nutrient deficiencies. The pH value of the drainage solution has a direct effect on root activity in ‘Seolhyang’ strawberry plants; the pH value of the drainage was lower, and the root activity was low with a high EC concentration of the nutrient solution (Jun et al., 2011a). In this study, the pH at the volume of 830 cm3 was lower than that of the 1,140 cm3 volume, except for the Cs case and at 40 DAT. However, the pH of the drainage solution did not change drastically according to the cultivation period, and the pH of the drainage solution of Co was closest to the pH of the nutrient solution.
The EC value of the drainage solution is an important indicator of nutrient uptake in a hydroponic system. The EC of the drainage solution increased from 40 DAT to 100 DAT (Fig. 1G-1J). Similar to this study, the EC of a drainage solution was 0.8 to 1.5 dS·m-1 when the corresponding nutrient solution was 1.0 to 1.5 dS·m-1 during the cultivation period, and with more reuse of the substrate, the EC of the drainage solution increased (Lee et al., 2019). The EC value of the drainage solution changed drastically from 80 to 100 DAT during the flowering periods (Table 2 and Fig. 1I-1J). The nutrient uptake patterns varied between the vegetative and reproductive stages, and fruit-vegetable plants showed the highest nutrient uptake from the vegetative to flowering stage (Lieten and Misotten, 1992; Lim et al., 2021). The EC of the drainage solution was highest in Gr, which was higher than the EC of the nutrient solution, except at 60 DAT. On the other hand, Co had the lowest EC of the drainage solution, with this metric similar to that of the nutrient solution (Fig. 1F-1J). Similar to this study, the EC of the drainage solution was highest in rockwool between coir (crushed chips: dust = 5: 5 = v/v) and rockwool when the nutrient solution was 1.2 dS·m-1 during the cultivation period (Lee et al., 2018). Nutrients not used by plants accumulate in the growing substrate and are removed with the used substrate at the end of the cultivation period. These results indicate that the nutrient solution leaches into the drainage solution in Gr.
The concentration of macroelements in the drainage solution was similar to that of the EC value of the drainage solution. Most ion concentrations in the nutrient solution were close to those in the drainage solution at 20 DAT because all of the substrates used in this experiment were buffered with a nutrient solution. During the later cultivation period, at 80 and 100 DAT, EC for drainage was highest in the Gr case. Additionally, during the later cultivation period, the concentrations of NO3–, K+, Mg2+, and SO42– ions in the drainage solution were greater than those in the nutrient solution in the Gr case (Figs 1 and 2). In ‘Albion’ strawberry plants, the NH4+ ion concentration in the drainage solution was low when the NO3– and NH4+ ratio in the nutrient solution was 100:0 to 80:20. However, when the NH4+ ratio in the nutrient solution exceeded 40%, the NH4+ ion concentration in the drainage solution was high (Shi et al., 2021). In this study, the NH4+ ion concentration in the drainage solution was lower than that in the nutrient solution for all substrates and in all cultivation periods (Fig. 2B). The substrate with the most similar ion concentrations of the nutrient solution and drainage solution was Co throughout the experimental period. In hydroponics, maintaining a target EC level is a common practice for recycling solutions, but this may not result in an optimal concentration of individual plant nutrients in the recycling solutions (Savvas and Gizas, 2002; Miller et al., 2020).
A regular nutrient composition analysis should be conducted when the solution is supplied and drained for each cultivation period to achieve long-term and precise nutrient solution reuse in hydroponics. In this study, by providing nutrient solution information at different growth stages based on the pot volume and substrate type, it was possible to utilize and set the pH and EC levels of nutrient solution for each growth stage. Furthermore, by examining the characteristics of drainage solutions at different stages, it will be possible to establish a strategy for reusing drainage solutions. Furthermore, optimizing the appropriate pot volume and substrate in a plant factory using pot cultivation can enhance the efficiency in the cultivation area, ultimately increasing the yield.
Conclusion
This study aimed to optimize the pot volume and substrate for strawberry cultivation using pots. The results indicated that a pot volume of 830 cm3 and a coir substrate were most suitable for pot cultivation, lasting approximately six months. While larger substrate volumes benefited plant growth, it is important to consider the desired cultivation period and establish a range of substrate volumes accordingly. Analyzing changes in nutrient solution characteristics based on the substrate and cultivation period can enhance nutrient management and resource utilization, enabling precise control of hydroponic cultivation and promoting research on nutrient solution reuse in hydroponic systems. Overall, determining the optimal pot volume and substrate for strawberry pot cultivation contributes to our understanding of substrate stability throughout the cultivation period and supports the recycling of culture systems.
